Archive for year: 2018

For the third year in a row, Lonsec has been announced as the Research House of the Year according to Money Management’s 2018 Rate the Raters Survey, voted on by financial advisers, winning eight out of a possible ten categories. Most notably, Lonsec ranked first for quality of staff, client service and corporate strength, highlighting the depth of knowledge and expertise across our Research team.

Here’s a full list of categories in which Lonsec was rated highest:

Website and Tools
Demonstrating the strength of our online Research portal, iRate.

Staff
Quality of staff and the level of professional experience amongst the team.

Client Service
Client-focused and helping our clients achieve their goals.

Value for Money
The level of value our research gives financial advisers as part of the high-quality, tailored advice solutions offered to clients.

Corporate Strength
Our corporate governance has strengthened this year.

Asset Allocation Research
Recognition of the rigorous research methodology and the value-add it brings to our clients.

Model Portfolio
Quality of the tailored, institutional-grade model portfolios created by the Investment Solutions team.

Overall
Our research offering provides the highest value available in the market.

To find out more about the Money Management Rate the Raters survey, visit: https://www.moneymanagement.com.au/features/rate-raters/planners-keep-lonsec-top-podium

The past decade has seen managed accounts transform from a technologically viable but largely unexplored solution to one that is now fully embedded in financial advice models.

A key benefit of managed accounts is the efficiency they bring to financial advice practices. A large component of this efficiency relates to the fact that once a client is invested within a separately managed account structure there is no requirement for the financial adviser to issue a Record of Advice (RoA) when portfolio changes are made.

For the average advice firm with an average book size, this represents a serious advantage. Advisers can be high-energy individuals but contacting 80 clients every time a change is made to the portfolio is a tall order. Not only is it inefficient, but by the time the adviser is part way through the process of implementing the changes and notifying clients, market dynamics have changed, and previously identified investment opportunities have faded away.

This raises another significant advantage of managed accounts: responsiveness. Changes made to managed and SMA portfolios are instructed to all relevant platforms usually within two days after an investment committee has recommended a change. This means that advice clients can be aligned to the recommended portfolio structure almost immediately, allowing them to capture the full benefits of portfolio changes.

The advantage this provides for financial advisers and their clients goes beyond saving advisers time and making the process of portfolio implementation more efficient. Delays in implementation can cost clients investment upside, and in the long run can have a significant impact on investment performance and outcomes.

Measuring the cost of delay

While the cost of delayed implementation might seem like an academic issue, it isn’t. These costs are quantifiable, and they have a real impact on investment performance.

Lonsec conducted analysis using the Lonsec SMA – Australian Equities Core to illustrate the impact portfolio implementation delays can have on portfolio performance. The portfolio is an active concentrated portfolio investing in Australian listed equities. We have used actual portfolio changes recommended in December 2016 and then measured what the hypothetical excess return would look like over a three-month, six-month and one-year period under four implementation scenarios.

What these results show is that over a one-year period, implementing the portfolio changes with no delay resulted in an excess return of 1.3% above the benchmark S&P/ASX 200 Accumulation Index. This compares to an excess return of 0.2% with a six-month delay, a -2.0% excess return for a 12-month delay, and a -3.5% excess return if the portfolio change was not implemented.

Hypothetical excess return to March 2018 (delays to implement December 2016 portfolio changes)

Source: Lonsec

Responsive implementation allows clients to capture the full upside associated with changes in dynamic asset allocation and security selection. This is invaluable in an environment where the expectations of advice clients for actively managed, tailored and responsive portfolio management are growing. Increasingly, advisers need to be able to justify the costs involved in providing advice, and this means being able to show that their investment solutions are fit for purpose and able to respond nimbly to market opportunities in line with the client’s investment objectives.

Responsive, contemporary, active

Financial advisers can harness the managed account model to create a more efficient financial advice business and create more time to focus on the individual needs of clients. But often overlooked is the way in which responsive implementation enhances the value of the advice offering through better investment outcomes and by meeting the client’s expectations for active and timely management of their investments. This is where financial advice businesses can build a strong value proposition.

Meeting clients’ expectations in today’s advice world means meeting three criteria: responding market developments quickly, providing contemporary multi-asset portfolios, and actively managing and monitoring the client’s investment. In order to achieve this, advisers are increasingly turning to professional managed portfolio managers and SMA providers, outsourcing day-to-day portfolio management to an experienced team of investment consultants and focusing on providing holistic, goals-based advice.

By using Lonsec’s managed portfolios and SMA’s, advisers can access contemporary, actively managed multi-asset portfolios with dynamic asset allocation and active investment selection, backed by an investment committee comprising our senior investment consultants, research sector leads, and external economists.

This means investment solutions are backed by a highly qualified, well-resourced, and experienced group of investment professionals. They can also ensure their clients receive responsive and efficient implementation of investment decisions, avoiding delays that can eat into investment performance while winning back time to build enduring client relationships with an appropriate level of service.

Important Notice: This document is published by Lonsec Investment Solutions Pty Ltd ACN: 608 837 583, a corporate authorised representative (CAR number: 1236821) (LIS) of Lonsec Research Pty Ltd ABN: 11 151 658 561 AFSL: 421 445 (Lonsec Research)). LIS creates the model portfolios it distributes using the investment research provided by Lonsec Research but has not had any involvement in the investment research process for Lonsec Research. LIS and Lonsec Research are owned by Lonsec Holdings Pty Ltd ACN: 151 235 406. Please read the following before making any investment decision about any financial product mentioned in this document.
Disclosure at the date of publication: Lonsec Research receives a fee from the relevant fund manager or product issuers for researching financial products (using objective criteria) which may be referred to in this document. Lonsec Research may also receive a fee from the fund manager or product issuer (s) for subscribing to research content and other Lonsec Research services. Lonsec Research receives fees for providing investment consulting advice, approved product lists and other advice, to clients. LIS receives a fee for providing the model portfolios to financial services professionals. LIS’ and Lonsec Research’s fees are not linked to the financial product rating(s) outcome or the inclusion of the financial product(s) in model portfolios. LIS and Lonsec Research may hold any financial product(s) referred to in this document. Lonsec Research’s representatives and/or their associates may hold any financial product(s) referred to in this document, but details of these holdings are not known to the analyst(s).
Warnings: Past performance is not a reliable indicator of future performance. Any express or implied rating or advice presented in this document is limited to “general advice” (as defined in the Corporations Act 2001 (Cth)) and based solely on consideration of the investment merits of the financial product(s) alone, without taking into account the investment objectives, financial situation and particular needs (“financial circumstances”) of any particular person. Before making an investment decision based on the rating or advice, the reader must consider whether it is personally appropriate in light of his or her financial circumstances or should seek independent financial advice on its appropriateness. If the advice relates to the acquisition or possible acquisition of a particular financial product, the reader should obtain and consider the Investment Statement or the Product Disclosure Statement for each financial product before making any decision about whether to acquire the financial product.
Disclaimer: LIS provides this document for the exclusive use of its clients. It is not intended for use by a retail client or a member of the public and should not be used or relied upon by any other person. No representation, warranty or undertaking is given or made in relation to the accuracy or completeness of the information presented in this document, which is drawn from public information not verified by LIS. Financial conclusions, ratings and advice are given on reasonable grounds held at the time of completion (refer to the date of this document) but subject to change without notice. LIS assumes no obligation to update this document following publication. Except for any liability which cannot be excluded, LIS and Lonsec, their directors, officers, employees and agents disclaim all liability for any error or inaccuracy in, misstatement or omission from, this document or any loss or damage suffered by the reader or any other person as a consequence of relying upon it.
Copyright © 2018 Lonsec Investment Solutions Pty Ltd ACN: 608 837 583 (LIS), a corporate authorised representative (CAR number: 1236821) of Lonsec Research Pty Ltd ABN: 11 151 658 561 AFSL: 421 445 (Lonsec Research). This report is subject to copyright of LIS. Except for the temporary copy held in a computer’s cache and a single permanent copy for your personal reference or other than as permitted under the Copyright Act 1968 (Cth), no part of this report may, in any form or by any means (electronic, mechanical, micro-copying, photocopying, recording or otherwise), be reproduced, stored or transmitted without the prior written permission of LIS.
This report may also contain third party supplied material that is subject to copyright. Any such material is the intellectual property of that third party or its content providers. The same restrictions applying above to LIS copyrighted material, applies to such third-party content.

The SuperRatings and Lonsec Day of Confrontation 2018 may be over, but the conversation hasn’t finished. Once again, the event has sparked discussion on a range of critical issues, from the government’s view on the ‘Best in Show’ proposal to the future of financial advice and the vexed issue of licensing. Below is a selection of articles flowing from the day’s event as well as the 16th Fund of the Year Awards dinner.

Market turmoil could force super mergers

Australian Financial Review
A detailed review and survey prepared for the event by SuperRatings executive director, Kirby Rappell, suggest operating expenses for an average super fund are rising by around 5 per cent a year. Read

Top super funds announced by SuperRatings

Sydney Morning Herald
The $70 billion fund for those working in the higher education and research sector, UniSuper, was named fund of the year by researcher SuperRatings at a dinner at Melbourne’s Grant Hyatt on Tuesday night. Read.

Robert wants ‘mutt’ funds closed

The Australian
In remarks at the annual “Day of Confrontation” conference organised by research company SuperRatings, Mr Robert said there were 220 funds in existence — which “would seem to be very, very excessive especially when a whole heap aren’t working.” Read

Super sector faces rising costs as funds fight for active members

Adviser Voice
Super funds are battling to improve active member ratios while operating costs per member are rising across the sector, with long-term implications for the sustainability of smaller funds. Read

Congratulations to all of the award winners & finalists from this year’s SuperRatings and Lonsec Fund of the Year Awards Dinner. A full list of the awards is available below.

SuperRatings Fund of the Year Award

Winner
UniSuper


SuperRatings Pension of the Year Award

Winner
QSuper

Finalists
AustralianSuper
BUSSQ
Cbus Super
Equip
HESTA
Sunsuper
TelstraSuper
UniSuper
VicSuper

SuperRatings MyChoice Super of the Year Award

Winner
Sunsuper

Finalists

CareSuper
Cbus Super
Hostplus
Mercer Super Trust
QSuper
Statewide Super
TelstraSuper
UniSuper
VicSuper


SuperRatings MySuper of the Year Award

Winner
UniSuper

Finalists
AustralianSuper
CareSuper
First State Super
HESTA
Hostplus
Intrust Super
QSuper
Rest
Sunsuper

SuperRatings Career Fund of the Year Award

Winner
Hostplus

Finalists
Cbus Super
HESTA
Intrust Super
Telstra Super


SuperRatings Best New Innovation Award

Winner
Sunsuper BEAM

Finalists
BUSSQ Centrelink Asssist Program
QSuper Online Tax Deduction Claims Facility
WA Super Scaled Advice Tool


SuperRatings Rising Star Award

Winner
Tasplan Super

Finalists
HUB24
MTAA Super
netwealth
WA Super

SuperRatings Infinity Award

Winner
Australian Ethical Super


In addition to the SuperRatings honours, Lonsec also presented a number of awards recognising excellence across the broader wealth management industry:

Lonsec Innovation Award

Winner
Magellan Global Trust

Finalists
Challenger CarePlus
Partners Group Global Real Estate Fund

Lonsec Rising Star Award

Winner
Lennox Capital Partners Pty Ltd

Finalists
Affirmative Investment Management Partners Ltd
India Avenue Investment Management

Lonsec Disruptor Award

Winner
BetaShares Australia 200 ETF

Finalists
BetaShares Australian Investment Grade Corporate Bond ETF
CFM IS Trends Trust

Listed Fund Award

Winner
MCP Master Income Trust

Finalists
VanEck Vectors Australian Floating Rate ETF
Vanguard Global Value Equity Active ETF

Pendal Retirement Innovation Award

Winner
Sam Harris – General Manager, Insights and Customer Experience, HESTA

Finalists
Jean-Luc Ambrosi – Executive General Manager, Marketing & Digital, TelstraSuper
Steven Hack – Manager – Product and Advice, BUSSQ
Lyn Melcer – Head of Technical Advice, QSuper


The evening was proudly supported by our principal sponsor Pendal, and the Link Group.

For some time, we have flagged that volatility in markets has been subdued, underpinned by a wave of liquidity being pumped into global economies by central banks in the form of Quantitative Easing (QE). We have seen bond yields trade at historic lows and the subsequent low interest rate environment has led to increasing debt levels among both corporates and households.

With central banks unwinding their QE programs and interest rates in the US going up, from an equities perspective the focus will increasingly be on future earnings growth, which to date has been trading above nominal GDP, partly due to low wage growth. The unwinding of the Fed’s balance sheet—which began around a year ago—has been a catalyst for rising yields, as has the prospect of growth with inflation.

US equity market performance and size of Fed balance sheet

Source: Lonsec, Bloomberg

An important factor recently has been uncertainty regarding the so-called ‘neutral’ Fed funds rate. The FOMC has for some time suggested that the neutral rate—meaning the rate that is consistent with full employment and inflation at target—would rise to around 2.9% over coming years. Markets had also implicitly priced in a peak of around 2.9% for the Fed funds rate by mid-2019.

However, Fed Chair Jay Powell surprised markets by commenting that there would be less emphasis on the neutral rate going forward, given that the funds rate is likely converging on the neutral level and that the actual neutral rate cannot be calculated with a high degree of accuracy. New York Fed President John Williams—considered the expert on the neutral policy concept and its measurement—noted that, going forward, the Fed would determine proximity to the neutral rate by observing changes in growth and inflation data. Sensible enough, but hardly the kind of solid forward guidance that markets have become accustomed to.

IMPORTANT NOTICE: This document is published by Lonsec Research Pty Ltd ABN 11 151 658 561, AFSL 421 445 (Lonsec).

Please read the following before making any investment decision about any financial product mentioned in this document.

Warnings: Lonsec reserves the right to withdraw this document at any time and assumes no obligation to update this document after the date of publication. Past performance is not a reliable indicator of future performance. Any express or implied recommendation, rating, or advice presented in this document is a “class service” (as defined in the Financial Advisers Act 2008 (NZ)) or limited to “general advice” (as defined in the Corporations Act (C’th)) and based solely on consideration of data or the investment merits of the financial product(s) alone, without taking into account the investment objectives, financial situation and particular needs (“financial circumstances”) of any particular person.

Warnings and Disclosure in relation to particular products: If our general advice relates to the acquisition or possible acquisition or disposal or possible disposal of particular classes of assets or financial product(s), before making any decision the reader should obtain and consider more information, including the Investment Statement or Product Disclosure Statement and, where relevant, refer to Lonsec’s full research report for each financial product, including the disclosure notice. The reader must also consider whether it is personally appropriate in light of his or her financial circumstances or should seek further advice on its appropriateness. It is not a “personalised service” (as defined in the Financial Advisers Act 2008 (NZ)) and does not constitute a recommendation to purchase, hold, redeem or sell any financial product(s), and the reader should seek independent financial advice before investing in any financial product. Lonsec may receive a fee from Fund Manager or Product Issuer (s) for reviewing and rating individual financial product(s), using comprehensive and objective criteria. Lonsec may also receive fees from the Fund Manager or Financial Product Issuer (s) for subscribing to investment research content and services provided by Lonsec.

Disclaimer: This document is for the exclusive use of the person to whom it is provided by Lonsec and must not be used or relied upon by any other person. No representation, warranty or undertaking is given or made in relation to the accuracy or completeness of the information presented in this document, which is drawn from public information not verified by Lonsec. Conclusions, ratings and advice are reasonably held at the time of completion but subject to change without notice. Lonsec assumes no obligation to update this document following publication. Except for any liability which cannot be excluded, Lonsec, its directors, officers, employees and agents disclaim all liability for any error, inaccuracy, misstatement or omission, or any loss suffered through relying on the information.

Copyright © 2018 Lonsec Research Pty Ltd, ABN 11 151 658 561 AFSL 421 445. All rights reserved. Read our Privacy Policy here.

Voluntary superannuation contributions have eased slightly after approaching record highs as super members appeared to take a breather after riding the bull market of recent years.

The latest data from superannuation research house SuperRatings reveals the average voluntary contribution over the course of the 2017 financial year was $1,054. This was a 10 percent decline on the prior year but just $158 per year less than the highest average contribution of $1,212 in the 2008 financial year and $260 higher than the eleven year average. Voluntary contributions more than halved in the years following the GFC but have slowly climbed since then.

Member contribution per active member


Source: SuperRatings

It remains to be seen how volatility throughout 2018 has affected member contributions but super balances remain well ahead over the course of the last decade despite recent fluctuations.

Data released by SuperRatings last week revealed that $100,000 invested in a Balanced Option in 2008 would be worth $193,751 as at the end of September 2018. This is a 9.7 percent annual return over the ten-year period. This return is despite the volatility of the first two weeks of October having cost members in a Balanced Option $2,700, while those 100 percent exposed to

Australian shares have experienced a decline of around $4,800 for the same period.

Best and worst performing options over 10 years to 30 September 2018*


Source: SuperRatings
*Interim results only

The latest data comes just a week before the annual SuperRatings Day of Confrontation, which brings together leaders from the superannuation industry along with policy makers and regulators to discuss trends across the sector.

Release ends

Australia’s superannuation funds have faced their first test of the financial year, with a major market selloff in October likely to put a dent in account balances. According to preliminary estimates from SuperRatings, over the period 28 September to 11 October, a typical balanced option account with a $100,000 balance will have lost $2,700. For members with pure Australian share exposure, this amount rises to $4,800.

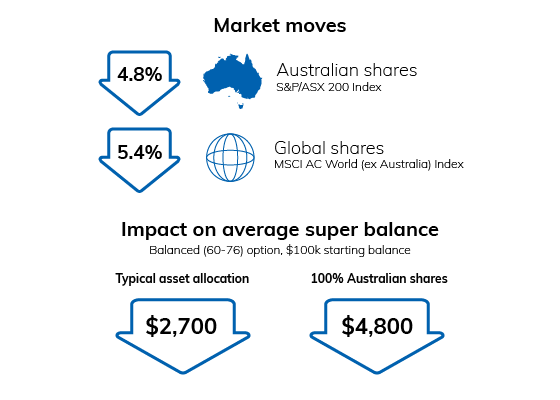
Impact of fall in share price index over the period 28 September to 11 October 2018

Source: SuperRatings, FE

October’s market jitters come on the back of lacklustre returns in the previous month, which saw super fund performance flat to slightly negative. According to SuperRatings, the median balanced option returned -0.1% in September as Australian shares came under pressure. However, while super funds may have taken a hit through the month, the data shows that superannuation has held up well over the past year, with the median balanced option delivering 9.7%.

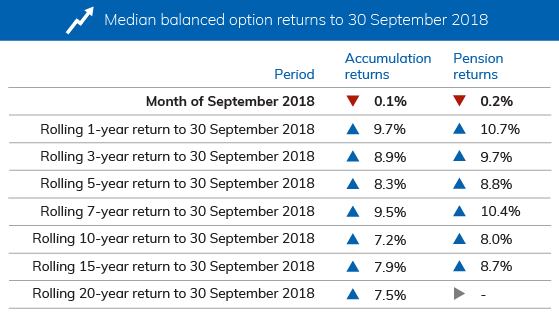
Interim results only. Median Balanced Option refers to ‘Balanced’ options with exposure to growth style assets of between 60% and 76%. Approximately 60% to 70% of Australians in our major funds are invested in their fund’s default investment option, which in most cases is the balanced investment option. Returns are net of investment fees, tax and implicit asset-based administration fees

“The market pullback is another timely reminder to members that good times should not be taken for granted,” said SuperRatings Executive Director Kirby Rappell. “We do not believe that recent selling will translate into a bear market for shares, but it certainly presents a clear message to super funds and other investment managers to be wary of holding too much risk.”

“These sort of market moves will inevitably impact superannuation account balances in the short term. However, over longer periods, as well as over the past 12 months, super returns are holding up well. The challenge for super funds in this environment will be to maintain discipline and stick to their long-term investment strategy.”

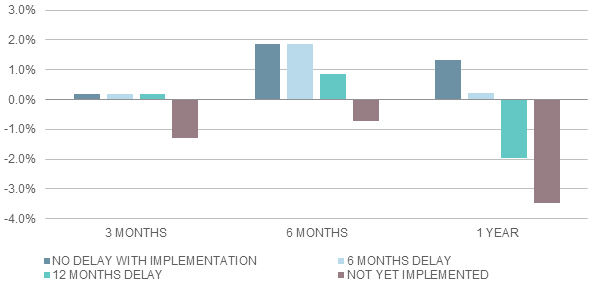
When there is a market drop, the balance of your superannuation can fall. However, it isn’t expected to affect most members directly as they cannot access their super. However, this is more challenging for those members nearing or in retirement. For most members, it is important to keep a long term view as volatility is unavoidable. Therefore, timing markets is a fraught exercise and one to be extremely cautious of.

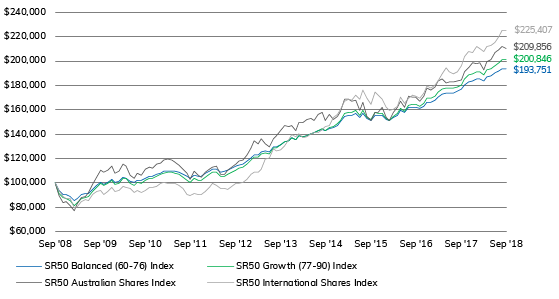
Growth in $100,000 invested for 10 years to 30 September 2018

Select index

SR50 Balanced (60-76) Index
SR50 Growth (77-90) Index
SR50 Australian Shares Index
SR50 International Shares Index
SR50 Cash Index

Source: SuperRatings

Interim results only

Source: SuperRatings

Interim results

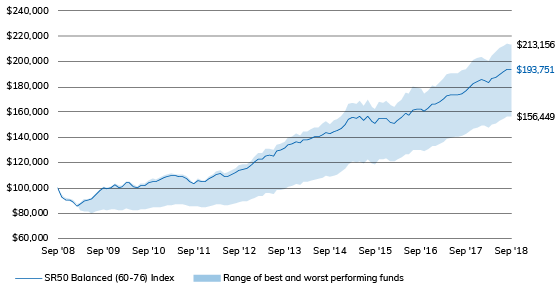
When considered over the longer term, the recent selling will not significantly diminish the stellar performance achieved by super funds over recent years. An investment of $100,000 in the median balanced fund 10 years ago would now be worth around $193,751 as at the end of September 2018. In the best performing balanced fund over that period, the same $100,000 investment would have doubled in value to $213,156.

Best and worst performing balanced options to 30 September 2018

Source: SuperRatings

Interim results

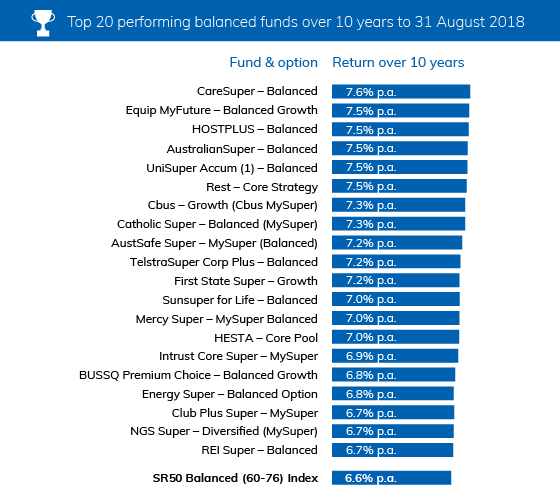
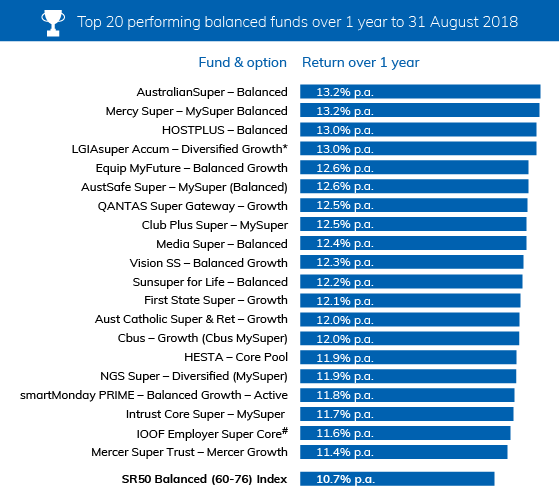
A comparison of balanced option returns shows that CareSuper remains ahead of the pack with an annual return of 7.6% over the past decade, followed closely by Equip MyFuture and HOSTPLUS. While the global financial crisis, continues to cast a shadow over long-term returns, Australia’s top performing funds have nevertheless delivered some impressive results.

Source: SuperRatings

Source: SuperRatings

*Interim results

# IOOF Employer Super Core – IOOF MultiMix Balanced Growth Trust

Release ends

Warnings: Past performance is not a reliable indicator of future performance. Any express or implied rating or advice presented in this document is limited to “General Advice” (as defined in the Corporations Act 2001(Cth)) and based solely on consideration of the merits of the superannuation or pension financial product(s) alone, without taking into account the objectives, financial situation or particular needs (‘financial circumstances’) of any particular person. Before making an investment decision based on the rating(s) or advice, the reader must consider whether it is personally appropriate in light of his or her financial circumstances, or should seek independent financial advice on its appropriateness. If SuperRatings advice relates to the acquisition or possible acquisition of particular financial product(s), the reader should obtain and consider the Product Disclosure Statement for each superannuation or pension financial product before making any decision about whether to acquire a financial product. SuperRatings research process relies upon the participation of the superannuation fund or product issuer(s). Should the superannuation fund or product issuer(s) no longer be an active participant in SuperRatings research process, SuperRatings reserves the right to withdraw the rating and document at any time and discontinue future coverage of the superannuation and pension financial product(s). Copyright © 2018 SuperRatings Pty Ltd (ABN 95 100 192 283 AFSL No. 311880 (SuperRatings)). This media release is subject to the copyright of SuperRatings. Except for the temporary copy held in a computer’s cache and a single permanent copy for your personal reference or other than as permitted under the Copyright Act 1968 (Cth.), no part of this media release may, in any form or by any means (electronic, mechanical, micro-copying, photocopying, recording or otherwise), be reproduced, stored or transmitted without the prior written permission of SuperRatings. This media release may also contain third party supplied material that is subject to copyright. Any such material is the intellectual property of that third party or its content providers. The same restrictions applying above to SuperRatings copyrighted material, applies to such third party content.

// GLOBAL PARAMETERS

var chartHeight = 376;
var chartWidth = 700;
var startAmt = 100000;
var numAxes = 9;
var dateNum = 10;

// DATA

// SR50 Balanced (60-76) Index

var balancedPrices = [
100000,
93352.9,
90449.62481,
90338.1908722341,
88669.7348250148,
85423.9791817451,
87337.4763154162,
90005.6362168522,
90914.6931426424,
91396.5410162984,
94705.0958010884,
97655.1595352923,
100145.366103442,
99093.1387417934,
100391.258859311,
102592.337209801,
100366.083492349,
101206.047245096,
104141.022615204,
104055.418694614,
101429.892370112,
100179.667516758,
102184.1624841,
101782.885278025,
104062.821908253,
105455.078402564,
105268.001093478,
107042.714323912,
108102.437195719,
109280.753761153,
109652.30832394,
109811.30417101,
109531.285345374,
108808.378862095,
107304.320641084,
105333.998705472,
103425.767984924,
106297.798136097,
105222.914801345,
105108.221824212,
107509.839584673,
109439.641205218,
111072.371212359,
111405.588325996,
108960.90409577,
109234.069082338,
110408.335324973,
112219.032024303,
113877.180441494,
114846.389124231,
115459.094610209,
117670.829026562,
120684.849641249,
123038.204209253,
122809.722264036,
125288.513698214,
126153.004442731,
125390.787989888,
129204.298025025,
129774.088979315,
131505.14555221,
133828.315453536,
134878.867729846,
136821.123425156,
135663.479899855,
138501.69556284,
138010.014543592,
139007.274908684,
140471.994564397,
140724.844154613,
142441.687253299,
143675.802031662,
142817.626466127,
144567.999296096,
145646.332002845,
147346.024697318,
150189.360935903,
154641.424162126,
155570.973762764,
155103.016273686,
156605.188986296,
153441.764168773,
157001.613097489,
152421.091035369,
150902.367284293,
155411.631823482,
154909.030606165,
155160.60287187,
151661.731277109,
150911.005707287,
153491.28208287,
155594.41962997,
159149.752118515,
157558.25459733,
161735.754159723,
162199.774038407,
162272.763936725,
161039.490930806,
162917.37243455,
166420.095941892,
166237.033836356,
168065.641208556,
170569.819262564,
172943.81000706,
173762.698947444,
173797.451487233,
173884.350212977,
174922.265899398,
176557.789085557,
180563.53220433,
182827.618334641,
183906.301282815,
185451.114213591,
185092.266307587,
183759.601990173,
186736.507542413,
187423.884626677,
189935.364680675,
191929.686009822,
193906.561775723,
193751.436526302
];

// SR50 Growth (77-90) Index

var growthPrices = [
100000,
91467.9,
87758.876655,
87399.0652607145,
85267.3146599404,
81293.8577967872,
83676.6620626689,
86973.522547938,
88265.0793577749,
89103.5976116738,
93041.9766261098,
96428.7045753001,
99234.7798784414,
97715.6938680622,
99147.2287832293,
101814.289237498,
98983.8519966957,
99960.5256643471,
103639.073008795,
103421.430955477,
99863.7337306082,
98116.1183903226,
100500.340067207,
99706.3873806765,
102383.503881848,
103987.853387676,
103748.681324885,
105737.232299839,
106889.768131907,
108204.512279929,
108496.664463085,
108540.06312887,
107975.6548006,
106939.088514514,
104933.980604867,
102296.150200422,
100011.058797245,
103564.951771605,
102045.653929116,
101802.887318418,
104521.02440982,
106726.418024867,
108617.716878686,
108834.952312443,
105492.957431785,
105762.386445066,
107065.590570842,
109014.184319231,
110758.411268339,
111815.821820718,
112491.972095268,
114955.546284154,
118580.324569586,
121165.375645203,
120807.93778705,
123655.743304504,
124635.962381679,
123676.26547134,
128294.213547774,
128862.043736937,
130885.048961563,
133555.103960379,
134789.954451596,
136919.635731932,
135303.984030295,
138668.994113128,
137934.048444329,
139037.520831883,
140658.281212221,
140735.643266887,
142826.83419019,
144131.98580102,
143087.893695877,
144975.938453194,
146237.664045553,
148297.421543634,
151518.441539562,
157068.259016273,
158041.925153915,
157520.544842832,
159372.828929639,
155456.082285864,
159762.215765183,
153920.670107944,
151996.661731595,
157386.159363274,
156794.859562546,
157026.131980401,
152516.184443792,
151326.55820513,
154306.93476898,
156808.558795455,
161078.612660014,
158775.188498976,
163828.050097767,
164174.054939574,
164131.698033399,
162359.075694639,
164891.877275475,
169483.95116572,
169009.396102456,
171189.617312177,
174082.721844753,
176799.456801862,
177555.981677517,
177413.936892175,
177344.745456787,
178490.392512438,
180457.535128318,
185340.35511382,
188141.2185603,
189495.835333934,
191211.530627048,
190663.900803332,
188528.465114334,
192449.857188713,
193315.881546062,
196058.260641674,
198626.62385608,
201228.632628595,
200846.2982266
];

// SR50 Australian Shares Index

var australianPrices = [
100000,
89359.3,
83774.34375,
84226.6414319062,
80857.57577463,
77173.0577617316,
83237.9340251106,
87672.1020085623,
88969.649118289,
92056.8959426936,
98325.970556391,
104473.9001914,
110428.91250231,
108662.049902273,
110107.255165973,
114069.795064886,
108012.688946941,
109683.753257639,
115407.051502622,
113883.678422788,
106217.484726079,
103428.213577172,
107741.170083341,
106362.083106274,
111143.058741901,
113134.186639262,
112071.404089973,
115746.113358679,
116000.754808068,
118448.370734518,
119230.129981366,
118802.809195513,
116709.028486251,
114736.645904833,
110891.017744041,
108268.445174395,
102696.95098572,
109405.629308862,
105838.786982135,
104485.003057846,
109042.32543622,
111495.777758535,
112911.662640291,
113885.751553889,
107054.314746929,
107050.996063172,
110412.397339555,
113269.318120716,
115421.43516501,
118237.487340166,
118828.674776867,
122536.129429905,
128295.32751311,
134378.578762472,
132147.894355015,
136548.419237037,
132260.798872994,
129472.476711153,
135745.547680286,
139056.24584266,
142540.439138494,
147322.243250273,
145849.02081777,
147103.322396803,
143165.660662885,
149364.733769588,
149853.75390795,
152094.067528874,
152978.038249351,
150882.239125335,
156404.529077323,
157556.761243035,
150740.6981949,
155941.252282624,
152073.909226015,
154735.202637471,
158713.135226875,
168546.842372397,
168955.56846515,
166568.226282737,
167489.681710533,
159450.176988428,
165869.481663805,
154747.932918247,
151457.991864405,
157788.935924337,
157773.157030744,
161565.865952606,
153767.727866538,
151318.207961624,
157493.655346746,
161568.488691532,
166770.9940274,
162042.369262747,
171246.375836871,
169874.007380914,
170458.713714319,
166964.310083176,
171024.882104398,
177344.251498156,
175960.96633647,
178723.553507953,
183960.153625736,
185555.272117825,
181942.139859146,
182749.962960121,
182836.220942638,
183787.517800203,
184289.441511315,
191295.573209251,
194534.207263683,
198409.523206583,
197973.022255529,
198581.789298964,
192763.342872505,
199413.678201606,
201418.383908567,
207078.240496398,
209418.224614007,
211847.476019529,
209856.109744946
];

// SR50 International Shares Index

var internationalPrices = [
100000,
93420,
88496.766,
87348.07797732,
86710.4370080856,
79669.549523029,
80383.0700085573,
84940.7900780425,
86558.9121290292,
85772.6975301612,
90237.8526181863,
92584.0367862592,
93537.6523651577,
90601.411919763,
92726.0150292814,
95934.3351492946,
93065.8985283307,
93531.2280209723,
97057.355317363,
96556.2481918594,
95543.6628170714,
92462.3796912208,
93843.0279447701,
91891.0929635189,
93865.4649869331,
95887.9841610065,
95917.9012120648,
97008.1999951423,
99763.2328750043,
100461.575505129,
99718.1598463914,
99215.9791934049,
99357.2627477764,
97915.7875798316,
95213.3118426283,
90156.0567841071,
89191.3869765171,
91125.234628942,
90670.9753343167,
90689.1095293835,
92865.6481580887,
96039.7031464841,
99469.0888664387,
98216.1762230771,
95601.1705311376,
95004.5236258528,
94401.2449008286,
97402.5436799607,
99744.7826478327,
99413.5302246592,
100384.402760833,
102699.869394915,
106848.944118469,
108302.08975848,
108714.93732464,
111483.689348424,
119515.420263841,
120519.349794058,
127468.133945134,
125951.263151187,
127238.611011855,
130068.397720759,
135390.146213503,
139779.765534038,
137484.302224438,
140586.085566923,
137050.345514915,
137528.377120071,
140168.646904022,
141154.733334992,
141112.386914992,
143250.239576754,
146444.719919315,
146991.837392934,
153224.291298394,
155744.064768796,
159950.867702266,
167122.584757433,
168369.152117138,
167873.81007161,
172252.294785898,
168454.476190458,
175904.375399981,
169079.109730086,
164700.806183626,
174132.397849731,
171711.086857631,
168259.694011792,
161788.762699487,
159631.794915177,
160208.384958411,
162796.551417414,
170106.279372607,
165286.998371702,
169819.829015047,
171894.178226466,
170734.408205972,
169197.798532119,
173614.030271605,
179075.58043589,
177660.883350446,
180414.627042378,
183644.048866437,
189796.124503462,
194412.345843635,
191244.202255768,
189720.9421848,
191208.733813414,
195984.363149137,
203295.363832053,
208052.475345723,
206887.381483787,
211449.455132886,
209779.004437336,
207932.949198287,
212091.608182253,
212510.277016805,
215082.501409816,
219835.824690973,
224979.982988742,
225407.444956421
];

// SR50 Cash Index

var cashPrices = [
100000,
100570,
100966.54751,
101295.39555524,
101623.086159861,
101856.819258029,
102056.254910136,
102274.349126879,
102496.284464484,
102726.798608245,
102963.070245044,
103189.588999583,
103437.244013182,
103664.805950011,
103923.967964886,
104204.562678391,
104506.755910159,
104799.374826707,
105101.825822457,
105417.551707228,
105744.34611752,
106097.637977899,
106468.979710821,
106830.974241838,
107188.110188729,
107572.379563755,
107938.125654272,
108335.553832931,
108736.395382113,
109095.225486874,
109487.968298627,
109871.176187672,
110266.712421947,
110663.672586666,
111050.99544072,
111450.112718334,
111833.055305634,
112235.654304734,
112606.03196394,
112985.176473562,
113360.287259455,
113700.368121233,
114077.853343395,
114454.310259429,
114832.009483285,
115135.165988321,
115453.860127776,
115775.514582092,
116091.813287931,
116405.261183808,
116685.215836955,
116989.414194642,
117273.815460549,
117529.706925884,
117793.67864764,
118076.501270073,
118348.077222994,
118596.608185162,
118869.380383988,
119118.649474653,
119359.030909293,
119597.748971112,
119833.834927581,
120064.994395156,
120299.601394204,
120520.11056356,
120756.209460154,
120985.646258128,
121223.262067379,
121465.708591514,
121708.640008697,
121942.442306153,
122171.572155247,
122410.661921954,
122641.406019677,
122897.726558258,
123155.443090851,
123379.093375504,
123606.604423689,
123813.769092703,
124021.652411009,
124215.002167118,
124411.758730551,
124610.81754452,
124796.238441026,
124995.912422532,
125181.656348391,
125377.315277264,
125579.047377545,
125767.415948611,
125972.03953436,
126186.192001568,
126399.446666051,
126589.04583605,
126788.296994196,
126983.677759864,
127155.613659551,
127333.631518674,
127504.131251278,
127682.509530898,
127861.265044242,
128027.484688799,
128206.723167363,
128381.725344487,
128570.061335567,
128746.716599842,
128915.503545305,
129083.093699914,
129250.901721723,
129431.852984134,
129596.619732983,
129763.410582579,
129948.323442659,
130104.26143079,
130273.39697065,
130456.407583428,
130647.134851315,
130826.252073196,
131035.574076514,
131232.127437628,
131415.852416041
];

// Dates

var dates = [“Sep 2008″,”Oct 2008″,”Nov 2008″,”Dec 2008″,”Jan 2009″,”Feb 2009″,”Mar 2009″,”Apr 2009″,”May 2009″,”Jun 2009″,”Jul 2009″,”Aug 2009″,”Sep 2009″,”Oct 2009″,”Nov 2009″,”Dec 2009″,”Jan 2010″,”Feb 2010″,”Mar 2010″,”Apr 2010″,”May 2010″,”Jun 2010″,”Jul 2010″,”Aug 2010″,”Sep 2010″,”Oct 2010″,”Nov 2010″,”Dec 2010″,”Jan 2011″,”Feb 2011″,”Mar 2011″,”Apr 2011″,”May 2011″,”Jun 2011″,”Jul 2011″,”Aug 2011″,”Sep 2011″,”Oct 2011″,”Nov 2011″,”Dec 2011″,”Jan 2012″,”Feb 2012″,”Mar 2012″,”Apr 2012″,”May 2012″,”Jun 2012″,”Jul 2012″,”Aug 2012″,”Sep 2012″,”Oct 2012″,”Nov 2012″,”Dec 2012″,”Jan 2013″,”Feb 2013″,”Mar 2013″,”Apr 2013″,”May 2013″,”Jun 2013″,”Jul 2013″,”Aug 2013″,”Sep 2013″,”Oct 2013″,”Nov 2013″,”Dec 2013″,”Jan 2014″,”Feb 2014″,”Mar 2014″,”Apr 2014″,”May 2014″,”Jun 2014″,”Jul 2014″,”Aug 2014″,”Sep 2014″,”Oct 2014″,”Nov 2014″,”Dec 2014″,”Jan 2015″,”Feb 2015″,”Mar 2015″,”Apr 2015″,”May 2015″,”Jun 2015″,”Jul 2015″,”Aug 2015″,”Sep 2015″,”Oct 2015″,”Nov 2015″,”Dec 2015″,”Jan 2016″,”Feb 2016″,”Mar 2016″,”Apr 2016″,”May 2016″,”Jun 2016″,”Jul 2016″,”Aug 2016″,”Sep 2016″,”Oct 2016″,”Nov 2016″,”Dec 2016″,”Jan 2017″,”Feb 2017″,”Mar 2017″,”Apr 2017″,”May 2017″,”Jun 2017″,”Jul 2017″,”Aug 2017″,”Sep 2017″,”Oct 2017″,”Nov 2017″,”Dec 2017″,”Jan 2018″,”Feb 2018″,”Mar 2018″,”Apr 2018″,”May 2018″,”Jun 2018″,”Jul 2018″,”Aug 2018″,”Sep 2018”];

// All prices

var allPrices = balancedPrices.concat(growthPrices, australianPrices, internationalPrices, cashPrices);

// FUNCTIONS

var balancedPoints = calcpoints(balancedPrices, chartHeight, chartWidth);
createchart(balancedPoints, balancedPrices);
createaxes(balancedPrices);
createDates();

function removeChart(){
var lines = document.getElementsByClassName(“line”);
while(lines.length > 0){
lines[0].parentNode.removeChild(lines[0]);
};
var labels = document.getElementsByClassName(“price-label”);
while(labels.length > 0){
labels[0].parentNode.removeChild(labels[0]);
};
var polyline = document.getElementById(“polyline-id”);
polyline.setAttribute(“points”, “”);
var polylineFill = document.getElementById(“polyline-fill”);
polylineFill.setAttribute(“points”, “”);
};

function report(portfolio){
if(portfolio == “balanced”){
removeChart();
createaxes(balancedPrices);
createDates();
var balancedPoints = calcpoints(balancedPrices, chartHeight, chartWidth);
createchart(balancedPoints, balancedPrices);
} else if(portfolio == “growth”){
removeChart();
createaxes(growthPrices);
createDates();
var growthPoints = calcpoints(growthPrices, chartHeight, chartWidth);
createchart(growthPoints, growthPrices);
} else if(portfolio == “australian”){
removeChart();
createaxes(australianPrices);
createDates();
var australianPoints = calcpoints(australianPrices, chartHeight, chartWidth);
createchart(australianPoints, australianPrices);
} else if(portfolio == “international”){
removeChart();
createaxes(internationalPrices);
createDates();
var internationalPoints = calcpoints(internationalPrices, chartHeight, chartWidth);
createchart(internationalPoints, internationalPrices);
} else if(portfolio == “cash”){
removeChart();
createaxes(cashPrices);
createDates();
var cashPoints = calcpoints(cashPrices, chartHeight, chartWidth);
createchart(cashPoints, cashPrices);
};
};

function numberWithCommas(num){
var parts = num.toString().split(“.”);
parts[0] = parts[0].replace(/\B(?=(\d{3})+(?!\d))/g, “,”);
return parts.join(“.”);
};

function dataconvert(prices, dates){
var data = [];
for(var i = 0; i < prices.length; i++){
var datum = {
price: prices[i],
date: dates[i]
};
data.push(datum);
};
return data;
};

function calcdollar(data, startAmt){
var oneData = [];
for(var i = 0; i < data.length; i++){
oneData.push(data[i] + 1);
};
var dollarAmts = [];
var start = startAmt;
var accum = start;
for(var i = 0; i < oneData.length; i++){
accum = oneData[i] * accum;
dollarAmts.push(accum);
};
return dollarAmts;
};

function calcpoints(prices, chartHeight, chartWidth){
var points = [];
var xPoint = 0;
var step = chartWidth / prices.length;
var max = Math.max.apply(null, allPrices);
var min = Math.min.apply(null, allPrices);
var range = max – min;
var firstInterval = range / numAxes;
var interval = 20000;

var minAxis = 60000 // startAmt – (interval * Math.ceil((startAmt – min) / interval));
var maxAxis = 240000 // minAxis + (numAxes * interval);
var axisRange = maxAxis – minAxis;

for(var i = 0; i < prices.length; i++){
if(prices[i] === maxAxis){
var yPoint = 0;
} else if(prices[i] === minAxis){
var yPoint = chartHeight;
} else {
var yPoint = ((maxAxis – prices[i]) / axisRange) * chartHeight;
}
var xandy = {
x: xPoint,
y: yPoint
};
points.push(xandy);
var xPoint = xPoint + step;
};
return points;
};

function createaxes(prices){
var max = Math.max.apply(null, allPrices);
var min = Math.min.apply(null, allPrices);
var range = max – min;
var firstInterval = range / numAxes;
var interval = 20000;

var minAxis = 60000 // startAmt – (interval * Math.ceil((startAmt – min) / interval));
var maxAxis = 240000 // minAxis + (numAxes * interval);
var axisRange = maxAxis – minAxis;

var step = chartHeight / numAxes;
var accum = step;
var d = "";

// DRAW AXES

for(var i = 1; i minAxis; i = i – interval){
accum = accum + step;
var div = document.createElement(“div”);
div.style.position = “absolute”;
div.className = “price-label”;
div.style.left = chartWidth + 5 + “px”;
div.style.top = accum – 12 + “px”;
var commaNum = numberWithCommas(priceLabel);
div.innerHTML = “$” + commaNum;
document.getElementById(“main-chart”).appendChild(div);
priceLabel = priceLabel – interval;
};
};

// DRAW DATES

function createDates() {
var step = chartWidth / dateNum;
var left = 0 – 25;

for(var i = 0; i <= dateNum * 12; i += 12) {
var date = dates[i];
var div = document.createElement("div");
div.className = "price-label";
div.style.position = "absolute";
div.style.top = chartHeight + 5 + "px";
div.style.left = left + "px";
div.style.zIndex = "4";
div.innerHTML = date;
document.getElementById("main-chart").appendChild(div);
var step
left += step;
};
};

function createchart(points, prices){

// DRAW CHART LINE

var pairs = [];
for(var i = 0; i < points.length; i++){
var xPoint = points[i].x;
var yPoint = points[i].y;
pairs.push(xPoint);
pairs.push(yPoint);

var chart = document.getElementById("chart");
var point = chart.createSVGPoint();
point.x = xPoint;
point.y = yPoint;
var polyline = document.getElementById("polyline-id");
polyline.points.appendItem(point);
};

// DRAW CHART FILL

for(var i = 0; i < points.length; i++){
var xPoint = points[i].x;
var yPoint = points[i].y;
pairs.push(xPoint);
pairs.push(yPoint);

var chart = document.getElementById("chart");
var point = chart.createSVGPoint();
point.x = xPoint;
point.y = yPoint;
var polyline = document.getElementById("polyline-fill");
polyline.points.appendItem(point);
};

var num = points.length – 1;

var chart = document.getElementById("chart");
var point = chart.createSVGPoint();
point.x = points[num].x;
point.y = chartHeight;
var polyline = document.getElementById("polyline-fill");
polyline.points.appendItem(point);

var chart = document.getElementById("chart");
var point = chart.createSVGPoint();
point.x = 0;
point.y = chartHeight;
var polyline = document.getElementById("polyline-fill");
polyline.points.appendItem(point);

var chart = document.getElementById("chart");
var point = chart.createSVGPoint();
point.x = 0;
point.y = points[0].y;
var polyline = document.getElementById("polyline-fill");
polyline.points.appendItem(point);

var left = 0;
var step = chartWidth / points.length;

// CREATE INTERACTIVE ELEMENTS

for(var i = 0; i < points.length; i++){
var top = points[i].y;
var div = document.createElement("div");
div.id = left;
div.className = "line";
div.style.position = "absolute";
div.style.height = chartHeight + "px";
div.style.width = step + "px";
div.style.left = left – (step / 2) + "px";
div.style.top = "0px";
document.getElementById("chart-container").appendChild(div);

var div = document.createElement("div");
div.className = "cursor";
div.style.height = chartHeight – points[i].y + "px";
div.style.top = chartHeight – (chartHeight – points[i].y) + "px";
div.style.left = "2px";
div.style.position = "absolute";
div.style.zIndex = "2";
document.getElementById(left).appendChild(div);

var div = document.createElement("div");
div.className = "dot";
div.style.position = "absolute";
div.style.top = points[i].y – 6 + "px";
div.style.left = 0 – (step / 2) + "px";
div.style.zIndex = "3";
document.getElementById(left).appendChild(div);

var div = document.createElement("div");
div.className = "label-chart";
div.style.position = "absolute";
div.style.top = chartHeight – 26 + "px";
div.style.left = "-50px";
div.style.zIndex = "4";
var num = Math.round(prices[i]);
var commaNum = numberWithCommas(num);
div.innerHTML = dates[i] + ": $" + commaNum;
document.getElementById(left).appendChild(div);

var left = left + step;
};
};

Don’t miss the premier awards night for superannuation and wealth management industries

The 16th Annual SuperRatings & Lonsec Fund of the Year Awards Dinner is a must-attend black tie, gala event for the superannuation and funds management industries – and the prestigious conclusion to the SuperRatings & Lonsec Day of Confrontation.

Join over 400 colleagues for an exclusive evening of celebration and entertainment, where we recognise the highest achieving funds that have stood out amongst their peers, demonstrating passion, innovation and a single-minded commitment to going above and beyond for members and investors.

Along with the coveted Fund of the Year Award, SuperRatings will be presenting a number of awards. The key award categories include:

Pension of the Year

  • AustralianSuper
  • BUSSQ
  • Cbus Super
  • Equip
  • HESTA
  • QSuper
  • Sunsuper
  • TelstraSuper
  • UniSuper
  • VicSuper


MyChoice Super of the Year

  • CareSuper
  • Cbus Super
  • Hostplus
  • Mercer Super Trust
  • QSuper
  • Statewide Super
  • Sunsuper
  • Telstra Super
  • UniSuper
  • VicSuper


MySuper of the Year

  • AustralianSuper
  • CareSuper
  • First State Super
  • HESTA
  • Hostplus
  • Intrust Super
  • QSuper
  • Rest
  • Sunsuper
  • UniSuper


Career Fund of the Year

  • Cbus Super
  • HESTA
  • Hostplus
  • Intrust Super
  • Telstra Super


Best New Innovation

  • BUSSQ Centrelink Asssist Program
  • QSuper Online Tax Deduction Claims Facility
  • Sunsuper BEAM
  • WA Super Scaled Advice Tool


Rising Star

  • HUB24
  • MTAA Super
  • netwealth
  • Tasplan
  • WA Super


Fund of the Year

  • Announced on the night


Infinity Award

  • Announced on the night


In addition to the SuperRatings honours, Lonsec will be presenting a number of awards recognising excellence across the broader wealth management industry. The key award categories include:

Lonsec Innovation Award

  • Challenger CarePlus
  • Magellan Global Trust
  • Partners Group Global Real Estate Fund


Lonsec Rising Star Award

  • Affirmative Investment Management Partners Ltd
  • India Avenue Investment Management
  • Lennox Capital Partners Pty Ltd


Lonsec Disruptor Award

  • BetaShares Australia 200 ETF
  • BetaShares Australian Investment Grade Corporate Bond ETF
  • CFM IS Trends Trust


Listed Fund Award

  • MCP Master Income Trust
  • VanEck Vectors Australian Floating Rate ETF
  • Vanguard Global Value Equity Active ETF


We are also proud to announce the nominees for the Pendal Retirement Innovation Award, which recognises those individuals who significantly enhance Australians’ experiences in their retirement years.


Pendal Retirement Innovation Award

  • Jean-Luc Ambrosi – Executive General Manager, Marketing & Digital, TelstraSuper
  • Steven Hack – Manager – Product and Advice, BUSSQ
  • Sam Harris – General Manager, Insights and Customer Experience, HESTA
  • Lyn Melcer – Head of Technical Advice, QSuper


The evening is proudly supported by our principal sponsor Pendal, and the Link Group.


[tc_seat_chart class=”btn btn-lg btn-success” id=”2647″ show_legend=”true” button_title=”Register Here” subtotal_title=”Subtotal” cart_title=”Go to Cart”]


Event details

Where: Grand Hyatt, Melbourne

When: Tuesday 30 October 2018

Time: 7:00pm to 11:00pm

Dress Code: Black Tie


Awards dinner: $275 + GST

Combo (Day and Awards Dinner): $599 + GST

All delegates can receive special accommodation rates at the Grand Hyatt. Simply enter your dates and special offer code ‘EVENT’. For more details, click here.


[tc_seat_chart class=”btn btn-lg btn-success” id=”2647″ show_legend=”true” button_title=”Choose Awards Dinner” subtotal_title=”Subtotal” cart_title=”Go to Cart”]


Investors are constantly warned of an impending crisis in financial markets with the resultant damage to asset prices. Yet while a crisis can have a severe impact on markets, investors who avoid herd-like selling can often ride out the slumps. For active and contrarian fund managers, such periods of disruption can also present opportunities.

The below chart reveals the impact on financial markets of eight memorable political and market crises over the last twenty years. The chart shows the impact each event had on the performance of US shares, measured by the Dow Jones Industrial Average, on the day of the crisis and over the subsequent 150 trading days.

Dow Jones Industrial Index performance following a crisis


Source: Lonsec, Bloomberg, FE

In all but one case—the Global Financial Crisis which began in 2008—the Dow Jones had rebounded by the 150-day mark and in many instances had produced gains that exceeded the initial loss. Lonsec does not recommend a strategy that seeks to time the market but the analysis highlights that in general major crises have an only short-term impact on markets.

Release ends

The managed account model is at the centre of a nascent revolution in financial advice. As pressures build on traditional advice businesses, the efficiencies offered by managed accounts have led advisers to rethink how they deliver advice and manage investments on behalf of clients. But while there are clear opportunities, the drive to shift to a managed account offering can result in rushed implementation, poorly aligned business practices and, critically, sub-optimal investment outcomes.

A well marketed but misconceived view is that the accessibility of managed account technology will inevitably lead to a win-win for businesses and clients. While the headline is correct, unfortunately this outcome is not guaranteed by the technology itself. For advisers to unlock the full benefits of the managed account model, as well as meet their clients’ best interests, they need to be able to provide quality portfolios backed by the right governance and compliance structures.

The implementation dilemma — adapting to the new world of financial advice

Successful implementation of managed accounts requires a whole of business transformation, and this naturally presents a range of commercial and operating risks. A number of advice practices have opted to go it alone by offering a private label managed account solution, acting as both adviser and model manager. Putting aside ASIC’s concerns regarding vertically integrated advice, the real risk for advisers is in underestimating the resources and skills required in the development of the model portfolios, as well as ongoing analysis and reporting of a public offer document.

The development of an institutional grade solution involves proof of concept with the construction and management of the portfolios, as well as time-consuming monitoring and reporting on investment performance. Naturally, this requires an investment committee with the right mix of skills and knowledge, a clear investment philosophy and process, and the capacity to filter and analyse the investment product universe. Advisers embarking on the managed account journey with minimal research, outdated traditional models, or poorly funded governance and compliance structures may end up facing higher costs in the long run. It will also place them clearly within the regulatory eyesight of ASIC.

What this means is that managed accounts, while presenting an opportunity for advisers, also present a very real dilemma. There are significant risks involved in implementation, but it is impossible for advisers to ignore the benefits of managed accounts. For ethical advisers who care about their clients, there is a need to balance a responsive and scalable investment solution with regulatory requirements and the costs of implementation. For many advisers, ASIC’s requirement for all discretionary account providers to be licensed, which came into effect this month, will make separately managed accounts (SMAs) an even more attractive solution.

As the wealth industry confronts the revelations from the Royal Commission into Financial Services, it awaits to be seen what recommendations will flow from the hearings and how the federal government will respond. While financial advice is unlikely to be radically impacted, advisers are still adapting to ongoing regulatory change, the most significant of which is FASEA’s education and training requirements. Nearly all advisers will be required to undertake further study, and many practices will need to recruit additional qualified advisers. Add to this the supervision of ethical standards compliance and advisers are facing increasing costs at a time when the demand for qualified advice is rising. In this environment, the ability to scale financial advice and the investment process is critical.

Scale and quality — the role of professional portfolio construction

One of the first steps to success for advisers is ensuring that they have the right research capabilities in place. The second step is to leverage this research with the right investment knowledge. This is where the help of external experts can be invaluable. By partnering with an investment research provider, advisers can expand the depth and breadth of their research and keep their clients informed of events impacting their portfolio as and when they occur.

Increasingly, however, advisers are taking this a step further and drawing directly on the expertise of their portfolio manager. This can be in the form of prepackaged model portfolios designed to cater to an array of risk profiles, or through a tailored, white label solution that reflects the adviser’s investment philosophy and client needs.

When considering an in-house managed account solution, the adviser should ensure they are of sufficient size to achieve scale benefits and that their in-house investment committee is equipped to deliver reliable investment outcomes on par with a dedicated team of research and portfolio construction professionals. From a client interest perspective, they should also ensure that their suite of model portfolio solutions is broad enough to cater to a range of risk profiles, or specialized enough to cater to particular retirement goals. Naturally, a small- to medium-sized client base makes this very difficult.

The future role of managed accounts, when coupled with excellent governance and sourcing of financially secure external experts, is a positive step for the advice profession and their clients. The key to success for participants is determining where the advice skill set is best used and where the cost of governance starts and ends in the new world.

Important information: Any express or implied rating or advice is limited to general advice, it doesn’t consider any personal needs, goals or objectives.  Before making any decision about financial products, consider whether it is personally appropriate for you in light of your personal circumstances. Obtain and consider the Product Disclosure Statement for each financial product and seek professional personal advice before making any decisions regarding a financial product.