Archive for year: 2018

I have learnt over my many years of investing that there are three reasons why dividends are key for investors:

1. Dividends are an important part of the return of an equity portfolio

2. The level of dividends is not impacted by the level of the sharemarket

3. The dividend yield on stocks can act as a ‘safety net’ in times of volatility

Dividends are an important part of the return

Over the long term, returns from an equity portfolio come from 2 sources – the capital appreciation from the shares held in the portfolio as well as the dividends received.
When one analyses the returns of these two components from the Australian sharemarket (the ASX 300) over the last 20 and 40 years the results are as follows:

Source: Calculated using IRESS data indices 31 December 1979 – 30 June 2018

As can be seen from the table above around half of the returns from the Australian sharemarket in the last 20 and 40 years have come from dividends – emphasising how important the dividends received from one’s portfolios are to the total return received from that an equity portfolio over time.

As can be seen from the table above around half of the returns from the Australian sharemarket in the last 20 and 40 years have come from dividends – emphasising how important the dividends received from one’s portfolios are to the total return received from that an equity portfolio over time.

The level of dividends received are not impacted by the level of the sharemarket

While the level of capital returns from an equity portfolio over any period depends on the movement in the share prices, the level of dividends received by an investor from an equity portfolio is dependent on the performance of the underlying companies’ earnings. The level of dividends and the dividend payout ratio of any company is set by the Board of the company and is generally a reflection of the overall profitability of a company – independent of its share price.

This is an important point to remember as it means that in negative periods in the sharemarket, an investor’s level of dividends from a diversified portfolio – if made up of quality companies with the right attributes – should not vary greatly from year to year and is largely irrelevant of what is happening on the overall sharemarket.

The chart below demonstrates this by comparing the volatility of the level of capital return to the level of dividend from the ASX 300 over the last 20 years.

Chart 1: volatility of returns of capital and income of the ASX 300 over 20 years

Source: IML, S&P ASX300 31/03/1998 – 30/06/2018

As can be seen from the chart above while the level of capital returns’ volatility has been quite high over the last 20 years – not surprisingly perhaps as it contains periods such as the tech boom and bust and the GFC and Eurozone crisis – the volatility of the dividends received by an investor from the ASX 300 has been very low – depicting the steadiness of dividends and this part of an investor’s returns.

The movement in the sharemarket particularly over shorter time periods of 6 to 12 months is more often than not dictated by the mood of investors. The mood of investors is impacted by things such as the predictions for future level of economic activity, inflation and interest rates as well as perceptions of geopolitical stability.

Often with hindsight what are quite minor events from an economic standpoint can cause the mood of investors to sour markedly and lead to large declines in the sharemarket. For example, Iraq’s invasion of Kuwait in 1991 led to all sorts of gloomy predictions about an impending global recession by many market analysts and economists.

Times of a perceived crisis can cause many investors to panic, and the prices of most shares can fall heavily initially as many investors/traders reduce their overall level of sharemarket exposure by rapidly selling shares indiscriminately and independent of their quality. What I have observed over the many years of investing is that once the panic subsides and some sort of normality is restored, those companies with sustainable earnings that can support a healthy dividend stream are often the shares that recover the quickest.

The reason for this is fairly obvious – rational long-term investors are always attracted to companies that pay a healthy dividend from a sustainable earnings stream as they understand that the level of returns from dividends is not dependent on future share price performance.

In other words, once shares in quality companies fall to a level where the dividend yield is attractive, this attracts long-term investors to start buying these shares as they ‘lock in’ the attractive dividend yield, despite a volatile sharemarket.

Concluding remarks
The lesson for investors is to always remember the importance of dividends when investing in the sharemarket. Dividends provide sharemarket investors not only with a consistent part of their total return but can also act as a ‘safety net’ in down trending markets. Dividends also provide investors with a relatively stable part of returns through the delivery of real cash flow, irrespective of the sharemarket cycle.

As a bottom-up value manager, fundamentals are crucial to deciding which companies are included in IML’s portfolios – mainly the quality and transparency of the earnings, cash flow generation, gearing levels or balance sheet strength – which ultimately is what is important in the level of dividends paid by companies to investors.

While the information contained in this article has been prepared with all reasonable care, Investors Mutual Limited (AFSL 229988) accepts no responsibility or liability for any errors, omissions or misstatements however caused. This information is not personal advice. This advice is general in nature and has been prepared without taking account of your objectives, financial situation or needs. The fact that shares in a particular company may have been mentioned should not be interpreted as a recommendation to buy, sell or hold that stock.


Anton Tagliaferro, Investors Mutual Limited

In the wake of Facebook’s plummeting share price, there has been much talk of the so-called FAANG shares and their earnings performance. But investors should not be misled by the market’s bucket mentality, which has a tendency to group together certain stocks, often for superficial reasons.

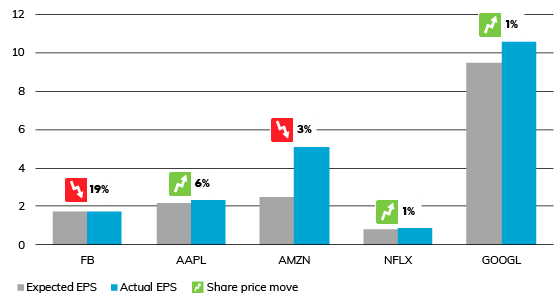
The recent round of earnings announcements shows that the five FAANG shares—Facebook, Apple, Amazon, Netflix and Google (which trades as Alphabet)—are hitting or exceeding their earnings per share (EPS) estimates, but have experienced wildly divergent share price reactions.

FAANG earnings per share (EPS) and share price reactions

 
Source: Lonsec, Bloomberg, company reports

While the FAANG shares have largely risen together in recent months, Facebook’s violent decoupling from the FAANG growth trajectory shows it is a mistake to think of these shares as behaving as a group. While Facebook met the market’s EPS target, it undershot the consensus revenue estimate and suffered the consequences.

In contrast, Amazon reported strong EPS growth and slightly down-beat revenue versus consensus, leading to only a moderate fall in price. Netflix reported lower than expected revenue and subscriber growth and saw a small bump in its price.

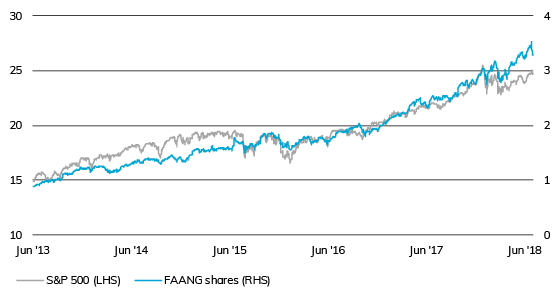
While the FAANG shares may have much in common—they are all technology-related shares—they are fundamentally different businesses. What they have most in common is that they are, with the exception of Netflix, among the highest value shares in the index. When they move in the same direction they can move the market with them, but when they diverge it can leave investors wondering how meaningful the FAANG label is.

FAANG market cap (US $trillion)

FAANG market cap (US $trillion)
Source: Lonsec, Bloomberg

Release ends

Smaller super funds have nearly 45 percent more low balance accounts as a proportion of total membership than the average fund leaving them most exposed to the Federal Government’s cap on fees for low balance accounts.

This is the latest data from superannuation research house SuperRatings who have assessed the impact to super funds from the Federal Government’s proposed 3 percent cap on fees for super accounts with balances lower than $6,000.

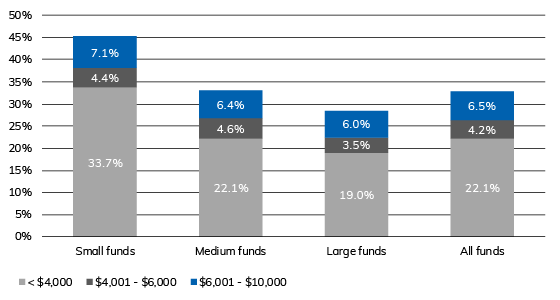
The SuperRatings analysis reveals that smaller funds (defined as funds with less than $2 billion of net assets) have around 38 percent of total accounts with a balance lower than $6,000. This is compared to 26 percent for all funds and 22.5 percent for large funds.

Small funds have the highest proportion of low balance accounts


Source: SuperRatings
Small funds are defined as funds with net assets of less than $2 billion, medium funds with between $2 billion and $10 billion, and large funds with more than $10 billion.

The prevalence of low balance accounts within smaller super funds is even greater below the $4,000 threshold. Nearly 34 percent of all accounts held with smaller funds have balances below $4,000 compared to 22 percent for the median and 19 percent for the largest funds.

Release ends

When it comes to investment objectives, many retirees―quite understandably―want to have their cake and eat it: they want enough income to enjoy an adequate lifestyle for their remaining years, and they want to preserve enough capital so that they have some insurance against adversity.

From an investment perspective, the key to meeting these potentially conflicting demands lies in strategies that can reduce volatility in retirees’ portfolios and produce reasonably consistent total returns that would help meet both these income and capital objectives.

Financial-market turbulence or asset-price volatility work against nearly all investors, but particularly retirees, who―because they are drawing down capital to meet expenses―are less able to recoup losses when markets recover after downturns.

Broadly speaking, low-volatility strategies fall into two categories: those that use derivatives, and those that don’t. From an investment perspective, both have their advantages and disadvantages, and some investors will naturally prefer simplicity to the complexity implied by derivatives.

But how should retirees, given their special investment objectives, weigh these strategies’ relative merits? They should consider several factors, in our view, including volatility, price and performance. Just as importantly, they should also reflect on their own behavioural biases.

Avoiding Index Volatility

Let’s look, first, at how such strategies compare in terms of general characteristics. An equity-based strategy will typically rely heavily on its manager’s stock-picking ability, which will be essential to identifying shares which have relatively low correlation to the market’s ups and downs.

This is important, because it’s a well-attested fact that a portfolio of low-volatility stocks can outperform a broad index-based portfolio over time, on a risk-adjusted basis. It’s a phenomenon commonly known as the “low-volatility paradox”.

There are several types of derivatives-based low-volatility strategies, and one question that a retiree might want to ask in assessing them is: what role, if any, does stock selection play, and does it try to take advantage of the naturally-occurring low-volatility paradox?

Perhaps surprisingly, some derivative-based strategies have little if any concern about singling out low-volatility stocks for their equity portfolios. Instead, the portfolios replicate the broad market index while a derivative overlay attempts to smooth out the inherent volatility.

This need not be a bad thing, but there are two points to bear in mind. The first is that derivatives cost money, and the cost is likely to be reflected in the management fee. How does the fee charged by the derivatives-based strategy compare to its equity-based counterparts?

The second consideration is that the Australian share market, which is small and concentrated by world standards, is inherently volatile. The financials and materials sectors, which are both volatile, make up about 33% and 18% of the S&P/ASX 300 Accumulation Index respectively.

This means that some derivative overlay strategies―for example, put or call options on the S&P/ASX 300―need to offset broad market volatility to be effective.

One of the problems with this is that market volatility can take different forms―a short, sharp fall, for example, or a slow grind downwards―and some derivatives strategies are better able to deal with specific types of volatility than others.

A retiree looking at a derivatives-based strategy, therefore, needs to understand which kind of volatility the strategy is best equipped to handle. Strategies designed to offset many kinds of volatility tend to be expensive.

By contrast, an equities-based strategy using a portfolio of carefully selected low-volatility stocks starts off by being inherently less volatile than the market.

Managing the Upside and Downside

Relative performance is another point to bear in mind. The reason that low-volatility stocks can outperform the broad market over time is that they tend to lose less in a downturn but participate―not fully, but enough―in the upturn when markets recover.

Their limited exposure to downside risk means that they have less ground to make up when markets recover. This, combined with sufficient participation in the upside, explains how they can outperform over the medium to long term.

While the limitations in upside/downside behaviour of low-volatility stocks can be regarded as natural and inherent, however, the limitations on the upside and downside potential of derivatives-based strategies are essentially artificial.

For example, some derivatives-based strategies might attempt to limit downside risk by buying put options on their underlying stocks, and seek to offset the cost of this by selling a call option on the same trade.

The purchased put option would give the manager the right to sell the underlying stock at a predetermined price if the market price of the stock fell, while the sold call option would oblige the
manager to sell the stock at a pre-determined price if the stock’s market price rose.

In other words, the potential for this strategy to participate in market upside is limited by the sale of the call option. Some derivative strategies even target the income opportunity available from selling both calls and puts, thereby limiting both their upside potential and ability to limit downside risk.

Having weighed these pros and cons from a dispassionate investment perspective, what other factors should the retiree consider?

Behavioural Considerations for Retirees

Top of the list should be the retiree’s own risk appetite and financial circumstances―in respect of which there is no substitute for professional financial advice. The issue may not be “Which strategy should I choose?”, but how best to use both kinds as a form of portfolio diversification.

Either way, there are points that both the adviser and retiree may wish to consider, in our view.

One is that retirees tend to take a lot more interest in their investments than they did when they were in the accumulation phase and preoccupied with careers and raising families. Given their likely level of financial expertise, would they prefer to monitor complex or relatively simple investments?

As a general point, equities-based low-volatility strategies tend to be simpler and more transparent than their derivatives-based equivalents, and a lot easier to understand.

The other is the fact―well recognised in the literature of retirement planning―that our cognitive abilities tend to decline after the age of 75. Financially expert or not, it’s unlikely that most retirees would want to be grappling with the minutiae of derivatives strategies during their sunset years.


DISCLAIMER

This document is provided solely for informational purposes and is not an offer to buy or sell securities. The information, forecasts and opinions set out in this document have not been prepared for any recipient’s specific investment objectives, financial situation or particular needs. Neither this document nor the information contained in it are intended to take the place of professional advice. You should not take action on specific issues based on the information contained in the attached without first obtaining professional advice.

The views expressed herein do not constitute research, investment advice or trade recommendations and do not necessarily represent the views of all AB portfolio-management teams.

INFORMATION ABOUT AB

AB is a leading global investment management and research firm. We bring together a wide range of insights, expertise and innovations to advance the interests of our institutional investors, individuals and private clients in major world markets.

AB offers a comprehensive range of research, portfolio management, wealth management and client-service offices around the world, reflecting our global capabilities and the needs of our clients. As at June 30, 2018, our firm managed US$540 billion in assets, including US$25 billion on behalf of institutions. These include pension plans, superannuation schemes, charities, insurance companies, central banks, and governments in more than 45 countries,

We’re truly global, but we’re not just portfolio managers and analysts in one location investing globally. We have an extensive global footprint that we’ve built over four decades. Our global teams collaborate across asset classes and investment strategies in order to spark new thinking and deliver superior outcomes for our clients. Every day brings a new set of investment challenges and opportunities. Through our unique combination of expertise, innovative offerings and global reach, we anticipate and advance what’s next—applying collective insights to help keep our clients at the forefront of change.

This document is released by AllianceBernstein Australia Limited (“ABAL”) ABN 53 095 022 718, AFSL 230 698. AllianceBernstein Australia Limited (ABAL) is a wholly owned subsidiary of the AllianceBernstein, L.P. Group (AB)

Investors sticking to the traditionally high quality, conservative part of global bond markets may be surprised to learn that they are more exposed to riskier credit now than prior to the GFC.

Unlike high quality AAA-rated bonds, a BBB bond is only one or two downgrades away from ‘high-yield’ or ‘junk’ status. When the economy turns sour, these companies can quickly find themselves relegated.

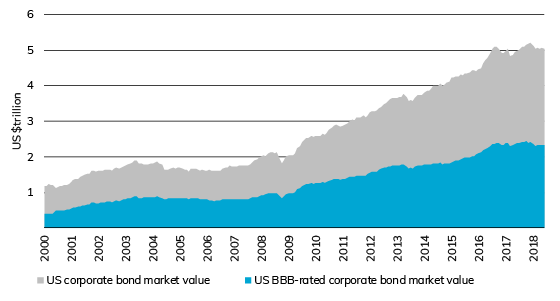
At the start of 2000, the BBB-rated market was worth around US$400 billion, or one third of the total investment grade market. By the end of June 2018, this had grown to $2.3 trillion, compared to a total market value of $5 trillion (see chart below).

The value of the US BBB-rated corporate bond market is growing

Chart - US corporate bond market value vs US BBB-rated Corporate Bond market value

Source: Lonsec, Bloomberg

Bloomberg Barclays US Corporate Bond Index

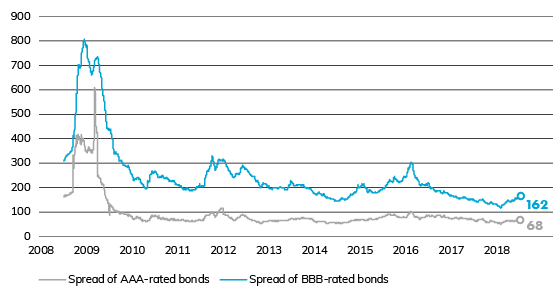
Globally, companies are increasingly prepared to push their debt ratios higher to fund expansion, and they have found an audience of investors keen to squeeze extra yield from their portfolios. This demand is reflected in US spreads on BBB bonds, which have moved lower and converged with AAA spreads over the past two years (see chart below).

AAA and BBB spreads have converged

Graph - Spread of AAA-rated bonds vs Spread of BBB-rated bonds

Source: Lonsec, FRED

ICE BofAML US Corporate Option-Adjusted Spread

Firms have also sought to lock in access to cheap finance for as long as they can, meaning investors are not only exposed to lower quality credit, but may also be exposed to bonds that are more sensitive to moves in both underlying yields and a widening in credit spreads. In contrast to the global landscape, Australia’s investment grade bond market is dominated by financials, meaning exposure to BBB bonds is comparatively lower.

Investment managers at the conservative end of the risk spectrum, such as pension funds and insurers, rely on the investment grade market for stable and predictable returns. But the ‘risking-in’ trend means that even the safest parts of an investor’s portfolio might not be as safe as they think, and could be exposed to ‘glittering junk’ – companies that appear to offer safe yields but are at risk of being crushed by debt when their equity value falls.

Release ends

Australia’s superannuation fund members have reason to expect a pickup in performance in the second half of 2018, following a volatile first half that saw super funds scrambling to recover from a global selloff earlier in the year.

SuperRatings’ data shows the median balanced option grew at an estimated 1.3% in June, bringing the June quarter return to 3.3%, ending the financial year on a high in what is historically the weakest quarter for superannuation.

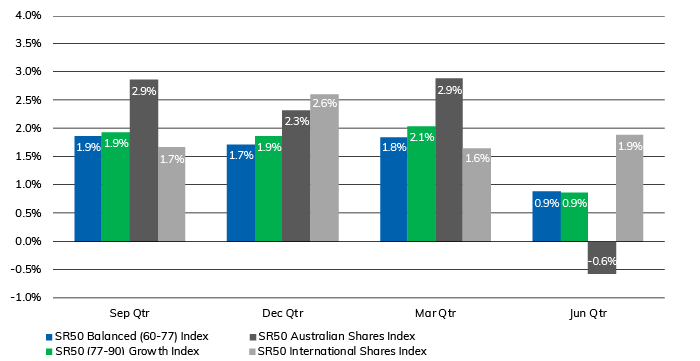
According to SuperRatings’ analysis, super funds have historically recorded higher returns in the second half of the calendar year. Over the past 10 years, balanced options have delivered an average return of 1.9% in the September quarter and 1.7% in the December quarter. In contrast, the average return for the June quarter is only 0.9%, reflecting the historic seasonal impact on equity markets.

The results are even more exaggerated for higher growth options. For example, options with a pure Australian shares focus have an average return of 2.3% in the December quarter and -0.6% in the June quarter (see chart below).

Average option returns for each FY quarter (2008-2018)
Source: SuperRatings

“Luckily this year investors forgot the old adage of ‘sell in May and go away’”, said SuperRatings CEO Kirby Rappell. “Instead we saw a strong recovery which ended up producing a very positive June quarter for superannuation.”

“If history is a guide, members can anticipate a bit of a kick in coming periods, although this is conditional on the management of some downside risks to the Australian economy, as well as the broader global growth picture.”

According to SuperRatings, Australian shares are set to move higher through the rest of 2018, but will likely continue to underperform global markets.

“With the Australian share market dominated by the banks, it is sensible to expect softer growth in the wake of the Royal Commission into Financial Services,” said Mr Rappell. “The Australian economy has a bit of extra baggage, including low wage growth and a cooling property sector which could impact sentiment, but overall our outlook is positive.”

Despite the comeback in the June quarter, the financial-year return for the median balanced option is expected to be in single-digit territory at around 9.2%, bringing the 5-year return to 8.9% p.a. and the 10-year return to 6.5% p.a.
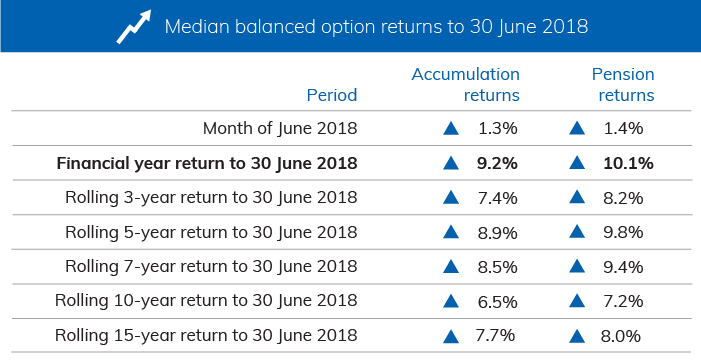
Interim results only. Median Balanced Option refers to ‘Balanced’ options with exposure to growth style assets of between 60% and 76%. Approximately 60% to 70% of Australians in our major funds are invested in their fund’s default investment option, which in most cases is the balanced investment option. Returns are net of investment fees, tax and implicit asset-based administration fees

Super funds add $150 billion over past financial year

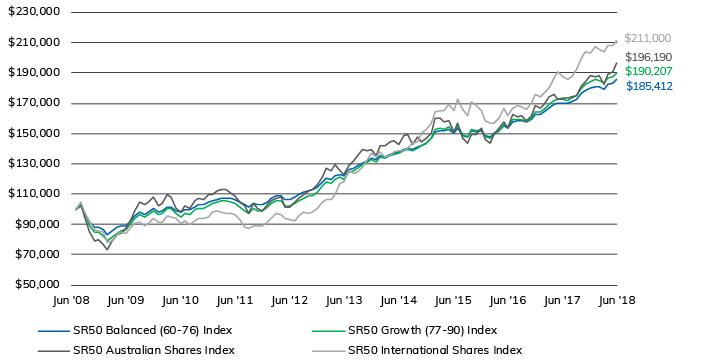
Super funds continue to amass wealth for members, with the median balanced option adding more than 85% over the past 10 years, while members in growth options have seen their savings grow by over 90%. This is despite the significant drawdowns members experienced during the Global Financial Crisis, with balanced options taking nearly two years to fully recover.

Growth in $100,000 invested for 10 years to 30 June 2018

Select index

SR50 Balanced (60-76) Index
SR50 Growth (77-90) Index
SR50 Australian Shares Index
SR50 International Shares Index
SR50 Cash Index

Source: SuperRatings

Interim results only
Source: SuperRatings

Interim results

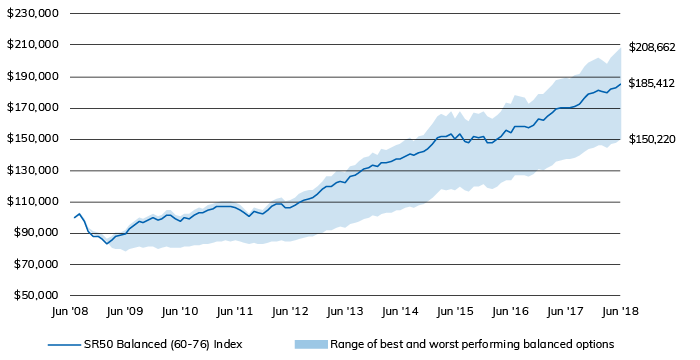
Over the last ten years the median balanced option has returned 6.5% p.a., meaning an account balance of $100,000 in 2008 has now accumulated to $185,412. Growth members have experienced a modest bonus, with a similar starting balance growing to $190,207.

Share focused options have delivered the highest returns, with the median Australian share option growing to $196,190 and the median international share option growing to $211,000, more than doubling in size.

Best and worst performing balanced options to 30 June 2018
Source: SuperRatings

Interim results

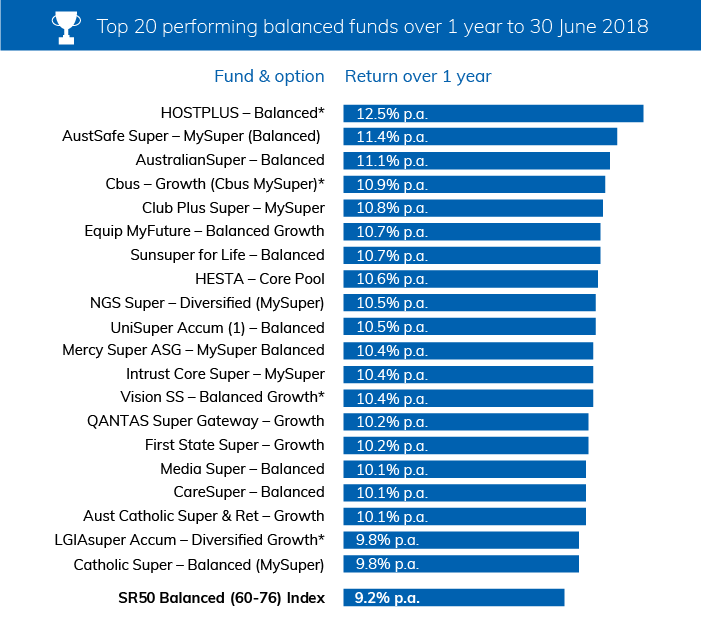
SuperRatings’ data shows HOSTPLUS was the best performing balanced option for the 2017-18 financial year, returning 12.5%, followed by AustSafe on 11.4% and AustralianSuper on 11.1%.

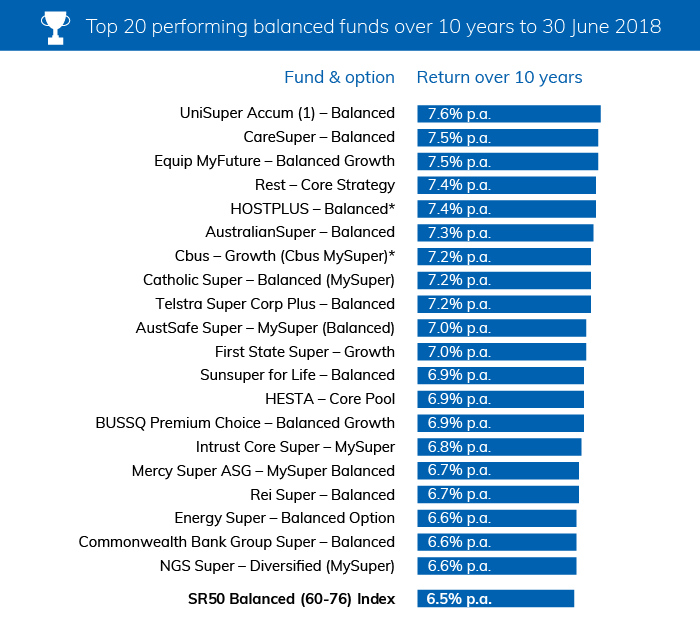
Over 10 years, the results show UniSuper narrowly moving ahead of both CareSuper and Rest in the balanced option rankings, while Equip has moved up into third sport. Each has returned well over 7.0% p.a. over the past 10 years, compared to the median balanced option return of 6.5% p.a.
Source: SuperRatings

*Interim results. Includes public offer funds only
Source: SuperRatings

*Interim results

Release ends

Warnings: Past performance is not a reliable indicator of future performance. Any express or implied rating or advice presented in this document is limited to “General Advice” (as defined in the Corporations Act 2001(Cth)) and based solely on consideration of the merits of the superannuation or pension financial product(s) alone, without taking into account the objectives, financial situation or particular needs (‘financial circumstances’) of any particular person. Before making an investment decision based on the rating(s) or advice, the reader must consider whether it is personally appropriate in light of his or her financial circumstances, or should seek independent financial advice on its appropriateness. If SuperRatings advice relates to the acquisition or possible acquisition of particular financial product(s), the reader should obtain and consider the Product Disclosure Statement for each superannuation or pension financial product before making any decision about whether to acquire a financial product. SuperRatings research process relies upon the participation of the superannuation fund or product issuer(s). Should the superannuation fund or product issuer(s) no longer be an active participant in SuperRatings research process, SuperRatings reserves the right to withdraw the rating and document at any time and discontinue future coverage of the superannuation and pension financial product(s). Copyright © 2018 SuperRatings Pty Ltd (ABN 95 100 192 283 AFSL No. 311880 (SuperRatings)). This media release is subject to the copyright of SuperRatings. Except for the temporary copy held in a computer’s cache and a single permanent copy for your personal reference or other than as permitted under the Copyright Act 1968 (Cth.), no part of this media release may, in any form or by any means (electronic, mechanical, micro-copying, photocopying, recording or otherwise), be reproduced, stored or transmitted without the prior written permission of SuperRatings. This media release may also contain third party supplied material that is subject to copyright. Any such material is the intellectual property of that third party or its content providers. The same restrictions applying above to SuperRatings copyrighted material, applies to such third party content.

// GLOBAL PARAMETERS

var chartHeight = 376;
var chartWidth = 700;
var startAmt = 100000;
var numAxes = 8;
var dateNum = 10;

// DATA

// SR50 Balanced (60-76) Index

var balancedPrices = [
100000,
102333.7,
97657.04991,
91165.6881454324,
88330.4352441095,
88221.6121478887,
86592.2471931294,
83422.5379846249,
85291.2028354804,
87896.8490821044,
88784.6072578336,
89255.1656763002,
92486.2026737822,
95367.1478870705,
97799.0101581908,
96771.4359584587,
98039.1417695145,
100188.649952811,
98014.5562488351,
98834.8400700817,
101701.050432114,
101617.452168659,
99053.4406155392,
97832.5079065121,
99790.0385572135,
99398.1630757993,
101624.681928697,
102984.318548221,
102801.624367117,
104534.756952322,
105569.65104615,
106720.360242553,
107083.209467378,
107238.480121105,
106965.021996796,
106259.052851618,
104790.23396405,
102866.075688002,
101002.553860838,
103807.293779,
102757.594424306,
102645.588646384,
104990.937701365,
106875.525033105,
108470.000991073,
108795.410994047,
106408.004495193,
106674.769362463,
107821.523133109,
109589.796112492,
111209.09493985,
112155.595546883,
112753.945649126,
114913.860231981,
117857.263847963,
120155.480492998,
119932.351765722,
122353.066353762,
123197.302511603,
122452.944409828,
126177.105808164,
126733.546844778,
128424.04562614,
130692.784816172,
131718.723176979,
133615.472790727,
132484.952275445,
135256.669961999,
134776.508783634,
135750.403836105,
137180.805841326,
137427.73129184,
139104.3496136,
140309.549698653,
139471.480758303,
141180.843226476,
142233.911136103,
143893.780879061,
146670.499168684,
151018.252775542,
151926.023492975,
151469.030014309,
152936.007569997,
149846.700217083,
153323.143662119,
148849.940945777,
147366.800134193,
151770.414855803,
151279.58933416,
151525.267387238,
148108.372607656,
147375.236163248,
149895.057951168,
151948.920035214,
155420.952858019,
153866.743329439,
157946.366162076,
158399.514286595,
158470.794068024,
157266.416033107,
159100.299710469,
162520.956154244,
162342.183102474,
164127.947116601,
166573.453528639,
168891.82285485,
169691.525636068,
169725.463941195,
169810.326673166,
170823.924513078,
172421.128207275,
176333.018764042,
178544.058486324,
179597.468431393,
181106.087166217,
180755.64688755,
179454.20622996,
182361.364370885,
183032.636553135,
185412.060828325
];

// SR50 Growth (77-90) Index

var growthPrices = [
100000,
102722.4,
97004.7684936,
88728.2246409576,
85130.2951317667,
84781.2609217265,
82713.3611865846,
78858.9185552898,
81170.3523170639,
84368.4641983562,
85621.3358917018,
86434.738582673,
90255.1540280271,
93540.4416346473,
96262.4684862155,
94788.8826186286,
96177.5397489915,
98764.7155682393,
96019.0564754423,
96966.4765056855,
100534.842841095,
100323.719671128,
96872.5837144416,
95177.3134994389,
97490.1222174752,
96719.9502519572,
99316.8809162222,
100873.176440179,
100641.168134367,
102570.157403998,
103688.172119702,
104963.536636774,
105246.938185694,
105289.036960968,
104741.533968771,
103736.015242671,
101790.964956871,
99232.1436797847,
97015.4960542657,
100462.941706554,
98989.1503517189,
98753.6551630322,
101390.377755885,
103529.714726534,
105364.364801203,
105575.093530806,
102333.199133755,
102594.558124343,
103858.728269551,
105748.957124057,
107440.940438042,
108466.679096404,
109122.5771049,
111512.361543497,
115028.569327686,
117536.19213903,
117189.46037222,
119951.967521574,
120902.826768118,
119971.875002003,
124451.504842703,
125002.327203137,
126964.738737899,
129554.819408152,
130752.6832684,
132818.57566404,
131251.316471205,
134515.536711844,
133802.604367271,
134873.025202209,
136445.240056991,
136520.284939023,
138548.839852932,
139814.899151508,
138802.080022054,
140633.573467945,
141857.507457837,
143855.57045038,
146980.113440562,
152363.701035663,
153308.203618384,
152802.439854646,
154599.243744897,
150799.812730623,
154976.967543261,
149310.389702009,
147444.009830734,
152672.079531312,
152098.490528513,
152322.835802043,
147947.971634972,
146793.977456219,
149685.08484222,
152111.779437682,
156253.935303549,
154019.504028708,
158921.020724918,
159256.661920689,
159215.573701913,
157496.045505933,
159952.983815825,
164407.514462112,
163947.173421618,
166062.091958757,
168868.54131286,
171503.903768589,
172237.768972815,
172099.978757636,
172032.859765921,
173144.192040009,
175052.414180482,
179788.982403377,
182505.953505457,
183819.996370696,
185484.302617836,
184953.075575139,
182881.601128697,
186685.538432174,
187525.623355119,
190207.239769097
];

// SR50 Australian Shares Index

var australianPrices = [
100000,
103600,
94742.2,
84660.9667246,
79369.6563043125,
79798.1730786995,
76606.2461555515,
73115.4527307353,
78861.4499299383,
83062.4782291561,
84291.8029069476,
87216.7284678187,
93156.1876764771,
98980.8714671365,
104622.781140763,
102948.816642511,
104318.035903857,
108072.233379964,
102333.597787488,
103916.800878859,
109339.179548717,
107895.902378674,
100632.781814152,
97990.1649637119,
102076.354842699,
100769.777500712,
105299.378999369,
107185.817374143,
106178.91380573,
109660.414210506,
109901.667121769,
112220.592298039,
112961.248207206,
112556.395093631,
110572.701186501,
108704.022536449,
105060.589813095,
102575.906864015,
97297.350696793,
103653.300131061,
100273.995240188,
98991.3905670709,
103309.098049435,
105633.552755547,
106974.99324199,
107897.866508688,
101425.612986165,
101422.468792162,
104607.134312236,
107313.843912565,
109352.806946904,
112020.796730795,
112580.900714448,
116093.424816739,
121549.815783126,
127313.221848299,
125199.822365617,
129368.976450392,
125306.79058985,
122665.072830634,
128608.318274352,
131744.946548745,
135045.94792947,
139576.33434466,
138180.571001213,
139368.923911824,
135638.296556552,
141511.434797451,
141974.743234978,
144097.265646341,
144934.758954277,
142949.152756604,
148181.091747495,
149272.741850399,
142815.053765209,
147742.173120109,
144078.16722673,
146599.535153198,
150368.316002916,
159684.986494141,
160072.222586389,
157810.402081243,
158683.409225557,
151066.60558273,
157148.396056885,
146611.596101271,
143494.633568158,
149492.709251307,
149477.759980382,
153071.05585255,
145682.928270771,
143362.199223418,
149212.953935925,
153073.540693109,
158002.508703427,
153522.50557165,
162242.58388812,
160942.37182084,
161496.335464648,
158185.660587622,
162032.735853113,
168019.845442886,
166709.290648431,
169326.626511612,
174287.896668402,
175799.147020414,
172375.986029632,
173141.335407604,
173223.058117916,
174124.337689304,
174599.871255533,
181237.634561055,
184305.987714173,
187977.547295428,
187563.996691378,
188140.755981204,
182628.231830954,
188928.905829122,
190828.208119422,
196190.480767578
];

// SR50 International Shares Index

var internationalPrices = [
100000,
104478.9,
98084.79132,
91630.812051144,
86801.8682560487,
85675.1800060852,
85049.7511920408,
78143.7113952471,
78843.5664745029,
83313.9966936072,
84901.1283306204,
84129.9713819934,
88509.6094321972,
90810.8592774343,
91746.2111279919,
88866.2058144731,
90950.1183408225,
94096.992435415,
91283.4923615961,
91739.909823404,
95198.5044237464,
94706.9945454066,
93713.8022936089,
90691.53216964,
92045.7381279971,
90131.1867749347,
92067.745453981,
94051.5291652779,
94080.8732423775,
95150.2905285236,
97852.5587795336,
98537.5266909904,
97808.348993477,
97315.7861479459,
97454.3638274206,
96040.4959170124,
93389.7782297028,
88429.3801590322,
87483.1857913305,
89379.9962256581,
88934.4369444732,
88952.2238318621,
91087.0772038268,
94200.3424155764,
97564.0482425518,
96335.1314908886,
93770.2086149437,
93184.9887429778,
92593.2640644599,
95537.0817088613,
97834.4619127143,
97509.5536647022,
98461.8319657916,
100732.952581915,
104802.563866224,
106227.878734805,
106632.819408542,
109348.544053238,
117226.45056101,
118211.152745722,
125026.853179583,
123539.033626745,
124801.726089444,
127577.316477674,
132797.142381358,
137102.691331646,
134851.190934598,
137893.568653273,
134425.545401643,
134894.421704004,
137484.124811878,
138451.325629929,
138409.79023224,
140506.698554259,
143639.997932019,
144176.636964293,
150289.726371579,
152761.24092176,
156887.474800297,
163921.838507918,
165144.531501349,
164658.676289672,
168953.303884659,
165228.22144061,
172535.439533821,
165840.891944469,
161546.442047567,
170797.399051421,
168422.461217611,
165037.169747137,
158690.170273002,
156574.512922922,
157140.0600636,
159678.657733927,
166848.389144838,
162121.407431976,
166567.42490939,
168602.046004658,
167464.488000265,
165957.307608263,
170288.959294146,
175645.909375621,
174258.306691554,
176959.310445273,
180126.882102243,
186161.132652668,
190688.943721046,
187581.476694168,
186087.390232299,
187546.687546501,
192230.853614662,
199401.833377904,
204067.836278947,
202925.056395785,
207399.756814368,
205761.298735534,
203950.599306662,
208029.611292795,
208440.261745487,
210999.763727431
];

// SR50 Cash Index

var cashPrices = [
100000,
100535,
100972.32725,
101547.869515325,
101948.272764824,
102280.318289219,
102611.195118885,
102847.200867658,
103048.575686957,
103268.7904932,
103492.88376857,
103725.639264166,
103964.208234473,
104192.929492589,
104442.992523371,
104672.767106923,
104934.44902469,
105217.772037057,
105522.903575964,
105818.367705977,
106123.759515176,
106442.55528876,
106772.527210155,
107129.254223564,
107504.206613347,
107869.720915832,
108230.329392854,
108618.335123727,
108987.637463148,
109388.929944287,
109793.668985081,
110155.988092732,
110552.549649866,
110939.48357364,
111338.865714505,
111739.685631077,
112130.774530786,
112533.77253445,
112920.438576878,
113326.952155755,
113700.931097869,
114083.762132876,
114462.520223157,
114805.907783826,
115187.063397668,
115567.180706881,
115948.552403213,
116254.656581558,
116576.449470976,
116901.231459202,
117220.605623548,
117537.101258732,
117819.777987259,
118126.934148472,
118414.100725387,
118672.48029317,
118939.018683908,
119224.591267768,
119498.807827684,
119749.755324122,
120025.179761368,
120276.872563327,
120519.59129216,
120760.630474744,
120999.011959302,
121232.419053371,
121469.307200201,
121691.960440299,
121930.354990802,
122162.022665284,
122401.948877799,
122646.752775555,
122892.046281106,
123128.121902012,
123359.479643066,
123600.894144727,
123833.88183019,
124092.694643215,
124352.917023882,
124578.741921197,
124808.4651213,
125017.644108843,
125227.548733302,
125422.778481777,
125621.448162892,
125822.442479953,
126009.666274363,
126211.281740402,
126398.831705068,
126596.393079023,
126800.086675487,
126990.286805501,
127196.900002133,
127413.134732137,
127628.462929834,
127819.905624229,
128021.094155681,
128218.374661775,
128391.982341067,
128571.731116345,
128743.88866431,
128924.001364551,
129104.494966461,
129272.330809918,
129453.312073052,
129630.015844031,
129820.183077275,
129998.556008823,
130168.98411575,
130338.203795101,
130507.643460035,
130690.354160879,
130856.722981725,
131025.135584203,
131211.84640241,
131369.300618093,
131540.080708897,
131724.870783733,
131917.452544819,
132101.023981894
];

// Dates

var dates = [“Jul 2008″,”Aug 2008″,”Sep 2008″,”Oct 2008″,”Nov 2008″,”Dec 2008″,”Jan 2009″,”Feb 2009″,”Mar 2009″,”Apr 2009″,”May 2009″,”Jun 2009″,”Jul 2009″,”Aug 2009″,”Sep 2009″,”Oct 2009″,”Nov 2009″,”Dec 2009″,”Jan 2010″,”Feb 2010″,”Mar 2010″,”Apr 2010″,”May 2010″,”Jun 2010″,”Jul 2010″,”Aug 2010″,”Sep 2010″,”Oct 2010″,”Nov 2010″,”Dec 2010″,”Jan 2011″,”Feb 2011″,”Mar 2011″,”Apr 2011″,”May 2011″,”Jun 2011″,”Jul 2011″,”Aug 2011″,”Sep 2011″,”Oct 2011″,”Nov 2011″,”Dec 2011″,”Jan 2012″,”Feb 2012″,”Mar 2012″,”Apr 2012″,”May 2012″,”Jun 2012″,”Jul 2012″,”Aug 2012″,”Sep 2012″,”Oct 2012″,”Nov 2012″,”Dec 2012″,”Jan 2013″,”Feb 2013″,”Mar 2013″,”Apr 2013″,”May 2013″,”Jun 2013″,”Jul 2013″,”Aug 2013″,”Sep 2013″,”Oct 2013″,”Nov 2013″,”Dec 2013″,”Jan 2014″,”Feb 2014″,”Mar 2014″,”Apr 2014″,”May 2014″,”Jun 2014″,”Jul 2014″,”Aug 2014″,”Sep 2014″,”Oct 2014″,”Nov 2014″,”Dec 2014″,”Jan 2015″,”Feb 2015″,”Mar 2015″,”Apr 2015″,”May 2015″,”Jun 2015″,”Jul 2015″,”Aug 2015″,”Sep 2015″,”Oct 2015″,”Nov 2015″,”Dec 2015″,”Jan 2016″,”Feb 2016″,”Mar 2016″,”Apr 2016″,”May 2016″,”Jun 2016″,”Jul 2016″,”Aug 2016″,”Sep 2016″,”Oct 2016″,”Nov 2016″,”Dec 2016″,”Jan 2017″,”Feb 2017″,”Mar 2017″,”Apr 2017″,”May 2017″,”Jun 2017″,”Jul 2017″,”Aug 2017″,”Sep 2017″,”Oct 2017″,”Nov 2017″,”Dec 2017″,”Jan 2018″,”Feb 2018″,”Mar 2018″,”Apr 2018″,”May 2018″,”Jun 2018”];

// All prices

var allPrices = balancedPrices.concat(growthPrices, australianPrices, internationalPrices, cashPrices);

// FUNCTIONS

var balancedPoints = calcpoints(balancedPrices, chartHeight, chartWidth);
createchart(balancedPoints, balancedPrices);
createaxes(balancedPrices);
createDates();

function removeChart(){
var lines = document.getElementsByClassName(“line”);
while(lines.length > 0){
lines[0].parentNode.removeChild(lines[0]);
};
var labels = document.getElementsByClassName(“price-label”);
while(labels.length > 0){
labels[0].parentNode.removeChild(labels[0]);
};
var polyline = document.getElementById(“polyline-id”);
polyline.setAttribute(“points”, “”);
var polylineFill = document.getElementById(“polyline-fill”);
polylineFill.setAttribute(“points”, “”);
};

function report(portfolio){
if(portfolio == “balanced”){
removeChart();
createaxes(balancedPrices);
createDates();
var balancedPoints = calcpoints(balancedPrices, chartHeight, chartWidth);
createchart(balancedPoints, balancedPrices);
} else if(portfolio == “growth”){
removeChart();
createaxes(growthPrices);
createDates();
var growthPoints = calcpoints(growthPrices, chartHeight, chartWidth);
createchart(growthPoints, growthPrices);
} else if(portfolio == “australian”){
removeChart();
createaxes(australianPrices);
createDates();
var australianPoints = calcpoints(australianPrices, chartHeight, chartWidth);
createchart(australianPoints, australianPrices);
} else if(portfolio == “international”){
removeChart();
createaxes(internationalPrices);
createDates();
var internationalPoints = calcpoints(internationalPrices, chartHeight, chartWidth);
createchart(internationalPoints, internationalPrices);
} else if(portfolio == “cash”){
removeChart();
createaxes(cashPrices);
createDates();
var cashPoints = calcpoints(cashPrices, chartHeight, chartWidth);
createchart(cashPoints, cashPrices);
};
};

function numberWithCommas(num){
var parts = num.toString().split(“.”);
parts[0] = parts[0].replace(/\B(?=(\d{3})+(?!\d))/g, “,”);
return parts.join(“.”);
};

function dataconvert(prices, dates){
var data = [];
for(var i = 0; i < prices.length; i++){
var datum = {
price: prices[i],
date: dates[i]
};
data.push(datum);
};
return data;
};

function calcdollar(data, startAmt){
var oneData = [];
for(var i = 0; i < data.length; i++){
oneData.push(data[i] + 1);
};
var dollarAmts = [];
var start = startAmt;
var accum = start;
for(var i = 0; i < oneData.length; i++){
accum = oneData[i] * accum;
dollarAmts.push(accum);
};
return dollarAmts;
};

function calcpoints(prices, chartHeight, chartWidth){
var points = [];
var xPoint = 0;
var step = chartWidth / prices.length;
var max = Math.max.apply(null, allPrices);
var min = Math.min.apply(null, allPrices);
var range = max – min;
var firstInterval = range / numAxes;
var interval = 20000;

var minAxis = 60000 // startAmt – (interval * Math.ceil((startAmt – min) / interval));
var maxAxis = 220000 // minAxis + (numAxes * interval);
var axisRange = maxAxis – minAxis;

for(var i = 0; i < prices.length; i++){
if(prices[i] === maxAxis){
var yPoint = 0;
} else if(prices[i] === minAxis){
var yPoint = chartHeight;
} else {
var yPoint = ((maxAxis – prices[i]) / axisRange) * chartHeight;
}
var xandy = {
x: xPoint,
y: yPoint
};
points.push(xandy);
var xPoint = xPoint + step;
};
return points;
};

function createaxes(prices){
var max = Math.max.apply(null, allPrices);
var min = Math.min.apply(null, allPrices);
var range = max – min;
var firstInterval = range / numAxes;
var interval = 20000;

var minAxis = 60000 // startAmt – (interval * Math.ceil((startAmt – min) / interval));
var maxAxis = 220000 // minAxis + (numAxes * interval);
var axisRange = maxAxis – minAxis;

var step = chartHeight / numAxes;
var accum = step;
var d = "";

// DRAW AXES

for(var i = 1; i minAxis; i = i – interval){
accum = accum + step;
var div = document.createElement(“div”);
div.style.position = “absolute”;
div.className = “price-label”;
div.style.left = chartWidth + 5 + “px”;
div.style.top = accum – 12 + “px”;
var commaNum = numberWithCommas(priceLabel);
div.innerHTML = “$” + commaNum;
document.getElementById(“main-chart”).appendChild(div);
priceLabel = priceLabel – interval;
};
};

// DRAW DATES

function createDates() {
var step = chartWidth / dateNum;
var stepFirst = (chartWidth / dateNum) * (11/12);
var left = 0 – 25 + stepFirst;

var div = document.createElement(“div”);
div.className = “price-label”;
div.style.position = “absolute”;
div.style.top = chartHeight + 5 + “px”;
div.style.left = left + “px”;
div.style.zIndex = “4”;
div.innerHTML = dates[11];
document.getElementById(“main-chart”).appendChild(div);
left += step;

for(var i = 23; i < dateNum * 12; i += 12) {
var date = dates[i];
var div = document.createElement("div");
div.className = "price-label";
div.style.position = "absolute";
div.style.top = chartHeight + 5 + "px";
div.style.left = left + "px";
div.style.zIndex = "4";
div.innerHTML = date;
document.getElementById("main-chart").appendChild(div);
var step
left += step;
};
};

function createchart(points, prices){

// DRAW CHART LINE

var pairs = [];
for(var i = 0; i < points.length; i++){
var xPoint = points[i].x;
var yPoint = points[i].y;
pairs.push(xPoint);
pairs.push(yPoint);

var chart = document.getElementById("chart");
var point = chart.createSVGPoint();
point.x = xPoint;
point.y = yPoint;
var polyline = document.getElementById("polyline-id");
polyline.points.appendItem(point);
};

// DRAW CHART FILL

for(var i = 0; i < points.length; i++){
var xPoint = points[i].x;
var yPoint = points[i].y;
pairs.push(xPoint);
pairs.push(yPoint);

var chart = document.getElementById("chart");
var point = chart.createSVGPoint();
point.x = xPoint;
point.y = yPoint;
var polyline = document.getElementById("polyline-fill");
polyline.points.appendItem(point);
};

var num = points.length – 1;

var chart = document.getElementById("chart");
var point = chart.createSVGPoint();
point.x = points[num].x;
point.y = chartHeight;
var polyline = document.getElementById("polyline-fill");
polyline.points.appendItem(point);

var chart = document.getElementById("chart");
var point = chart.createSVGPoint();
point.x = 0;
point.y = chartHeight;
var polyline = document.getElementById("polyline-fill");
polyline.points.appendItem(point);

var chart = document.getElementById("chart");
var point = chart.createSVGPoint();
point.x = 0;
point.y = points[0].y;
var polyline = document.getElementById("polyline-fill");
polyline.points.appendItem(point);

var left = 0;
var step = chartWidth / points.length;

// CREATE INTERACTIVE ELEMENTS

for(var i = 0; i < points.length; i++){
var top = points[i].y;
var div = document.createElement("div");
div.id = left;
div.className = "line";
div.style.position = "absolute";
div.style.height = chartHeight + "px";
div.style.width = step + "px";
div.style.left = left – (step / 2) + "px";
div.style.top = "0px";
document.getElementById("chart-container").appendChild(div);

var div = document.createElement("div");
div.className = "cursor";
div.style.height = chartHeight – points[i].y + "px";
div.style.top = chartHeight – (chartHeight – points[i].y) + "px";
div.style.left = "2px";
div.style.position = "absolute";
div.style.zIndex = "2";
document.getElementById(left).appendChild(div);

var div = document.createElement("div");
div.className = "dot";
div.style.position = "absolute";
div.style.top = points[i].y – 7 + "px";
div.style.left = 0 – (step / 2) + "px";
div.style.zIndex = "3";
document.getElementById(left).appendChild(div);

var div = document.createElement("div");
div.className = "label-chart";
div.style.position = "absolute";
div.style.top = chartHeight – 26 + "px";
div.style.left = "-50px";
div.style.zIndex = "4";
var num = Math.round(prices[i]);
var commaNum = numberWithCommas(num);
div.innerHTML = dates[i] + ": $" + commaNum;
document.getElementById(left).appendChild(div);

var left = left + step;
};
};

SuperRatings’ response to the Productivity Commission’s draft report on efficiency and competitiveness of superannuation indicates support for a review of the current system, with insight provided into some of the draft findings and recommendations where we foresee implementation issues that could potentially present challenges.

View the full response here

What can fund managers learn from the most successful World Cup teams? For every on-field win, there is a lot going on behind the scenes, and the same is true for Australia’s leading investment managers. Here are some universal tips on how funds can set themselves up for lasting success, based on the match-winning habits of the stars of the world game.

1. Beware the star player model

After winning the match against Portugal, Uruguay’s Edinson Cavani was struck out with a calf injury and forced to sit out a two-goal loss to France. In the risk management literature, this is known as key person risk. If your star portfolio manager leaves, your fund may underperform and you may be forced to change up your entire investment strategy. Successful teams reduce their reliance on a single star player by developing their other players and fully utilising the field. Having said that, it doesn’t hurt to have a few flamboyant strikers.

2. Maintain discipline

Winning teams are able to maintain focus and stick to their game plan even when the match is moving against them. Belgium’s astounding comeback against Japan from two goals down shows that discipline wins games and complacency loses them. Don’t panic when volatility rears its head or the market corrects. Stick to your investment strategy and make sure you are doing what you told your investors you would do. Timing the market is hard, and the chance of success diminishes rapidly when you are overcome by fear.

3. Take responsibility

When things go pear-shaped, avoid losing your head and admit when you have made a mistake. As we learned from the bizarre theatrics of Brazil’s forward Neymar, a refusal to take responsibility on and off the field will quickly see your fans disappear. Likewise, fund managers who blame the market for not doing what it should have done are unlikely to build trust with their investors.

4. Remember to score

This may seem like an obvious point, but scoring goals is the key to winning matches. Don’t be like the Australian team and overload your defence at the expense of scoring opportunities. Balance risk and return appropriately and if you have an active mandate, use it. If you are an active equity manager wondering why your investment product is being overtaken by smart beta alternatives, remember what you are there to do: generate alpha. Locking up play might work in the early rounds, but it is not a World Cup winning strategy.

5. Review your strategies

Successful teams continually assess their strategies against different sides by reviewing game footage and analysing their opponents. Investment managers should plan for a range of different market scenarios, including the worst-case scenario, and test investment hypotheses in a clinical manner. Assess your fund’s track record over long time periods and through different economic and market conditions. A lot has changed since 1966, and what worked then may no longer work now. The best teams can adapt to new ways of playing while identifying what still works.

IMPORTANT NOTICE: This document is published by Lonsec Research Pty Ltd ABN 11 151 658 561, AFSL 421 445 (Lonsec).

Please read the following before making any investment decision about any financial product mentioned in this document.

Warnings: Lonsec reserves the right to withdraw this document at any time and assumes no obligation to update this document after the date of publication. Past performance is not a reliable indicator of future performance. Any express or implied recommendation, rating, or advice presented in this document is a “class service” (as defined in the Financial Advisers Act 2008 (NZ)) or limited to “general advice” (as defined in the Corporations Act (C’th)) and based solely on consideration of data or the investment merits of the financial product(s) alone, without taking into account the investment objectives, financial situation and particular needs (“financial circumstances”) of any particular person.

Warnings and Disclosure in relation to particular products: If our general advice relates to the acquisition or possible acquisition or disposal or possible disposal of particular classes of assets or financial product(s), before making any decision the reader should obtain and consider more information, including the Investment Statement or Product Disclosure Statement and, where relevant, refer to Lonsec’s full research report for each financial product, including the disclosure notice. The reader must also consider whether it is personally appropriate in light of his or her financial circumstances or should seek further advice on its appropriateness. It is not a “personalised service” (as defined in the Financial Advisers Act 2008 (NZ)) and does not constitute a recommendation to purchase, hold, redeem or sell any financial product(s), and the reader should seek independent financial advice before investing in any financial product. Lonsec may receive a fee from Fund Manager or Product Issuer (s) for reviewing and rating individual financial product(s), using comprehensive and objective criteria. Lonsec may also receive fees from the Fund Manager or Financial Product Issuer (s) for subscribing to investment research content and services provided by Lonsec.

Disclaimer: This document is for the exclusive use of the person to whom it is provided by Lonsec and must not be used or relied upon by any other person. No representation, warranty or undertaking is given or made in relation to the accuracy or completeness of the information presented in this document, which is drawn from public information not verified by Lonsec. Conclusions, ratings and advice are reasonably held at the time of completion but subject to change without notice. Lonsec assumes no obligation to update this document following publication. Except for any liability which cannot be excluded, Lonsec, its directors, officers, employees and agents disclaim all liability for any error, inaccuracy, misstatement or omission, or any loss suffered through relying on the information.

Copyright © 2018 Lonsec Research Pty Ltd, ABN 11 151 658 561 AFSL 421 445. All rights reserved. Read our Privacy Policy here.

Don’t bother calling your broker when the World Cup is on the TV. Analysis of share volumes shows there is a noticeable dip in the number of trades during World Cup matches in which the market’s national team is playing.

Happily, most World Cup matches this year have been scheduled during European evenings or weekends, leaving traders free to focus on their job during the day. But when matches are played in the afternoon, it seems it can interfere with the critical period leading up to the market’s close, when a very high proportion of trades are cleared.

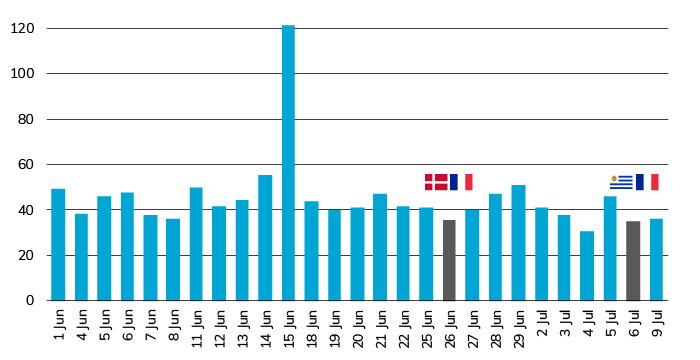
Using World Cup contender France as an example, the French national team has played two matches corresponding with the final 90 minutes of Paris trading. Compared with the final 90 minutes of recent trading days, both ended up being the second- and third-lowest volume periods.

French CAC 40, volume in final 90 minutes of trading (million)

Source: Lonsec, Bloomberg

As the chart above shows, volume in the final 90 minutes of trade on 26 June (France v Denmark) was around 36 million, and on 6 July (Uruguay v France) it was around 35 million. This compares to an average volume for the period of around 45 million, although this number is skewed by the high-volume period on 15 June when trade-related fears gripped Europe’s markets.

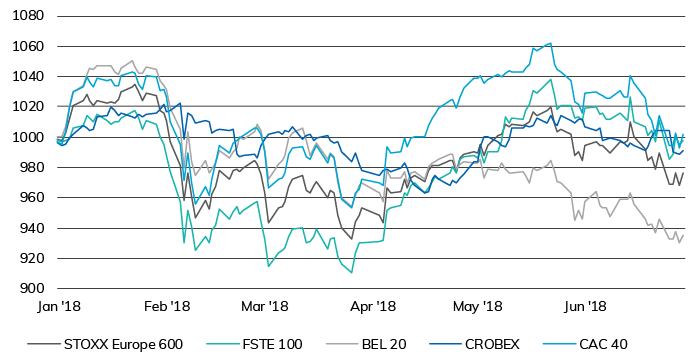
France is not only beating the competition on the field, it is also leading its rivals in share market performance. While it has been a rocky start for European shares since the start of the year, the French CAC 40 index remains ahead of the UK, Belgium and Croatia, as well as world game juggernaut Germany, bouncing back from the global share dip at the start of 2018.

Performance of World Cup qualifying markets (H1 2018)

Source: Lonsec, Bloomberg

Release ends

IMPORTANT NOTICE: This document is published by Lonsec Research Pty Ltd ABN 11 151 658 561, AFSL 421 445 (Lonsec).

Please read the following before making any investment decision about any financial product mentioned in this document.

Warnings: Lonsec reserves the right to withdraw this document at any time and assumes no obligation to update this document after the date of publication. Past performance is not a reliable indicator of future performance. Any express or implied recommendation, rating, or advice presented in this document is a “class service” (as defined in the Financial Advisers Act 2008 (NZ)) or limited to “general advice” (as defined in the Corporations Act (C’th)) and based solely on consideration of data or the investment merits of the financial product(s) alone, without taking into account the investment objectives, financial situation and particular needs (“financial circumstances”) of any particular person.

Warnings and Disclosure in relation to particular products: If our general advice relates to the acquisition or possible acquisition or disposal or possible disposal of particular classes of assets or financial product(s), before making any decision the reader should obtain and consider more information, including the Investment Statement or Product Disclosure Statement and, where relevant, refer to Lonsec’s full research report for each financial product, including the disclosure notice. The reader must also consider whether it is personally appropriate in light of his or her financial circumstances or should seek further advice on its appropriateness. It is not a “personalised service” (as defined in the Financial Advisers Act 2008 (NZ)) and does not constitute a recommendation to purchase, hold, redeem or sell any financial product(s), and the reader should seek independent financial advice before investing in any financial product. Lonsec may receive a fee from Fund Manager or Product Issuer (s) for reviewing and rating individual financial product(s), using comprehensive and objective criteria. Lonsec may also receive fees from the Fund Manager or Financial Product Issuer (s) for subscribing to investment research content and services provided by Lonsec.

Disclaimer: This document is for the exclusive use of the person to whom it is provided by Lonsec and must not be used or relied upon by any other person. No representation, warranty or undertaking is given or made in relation to the accuracy or completeness of the information presented in this document, which is drawn from public information not verified by Lonsec. Conclusions, ratings and advice are reasonably held at the time of completion but subject to change without notice. Lonsec assumes no obligation to update this document following publication. Except for any liability which cannot be excluded, Lonsec, its directors, officers, employees and agents disclaim all liability for any error, inaccuracy, misstatement or omission, or any loss suffered through relying on the information.

Copyright © 2018 Lonsec Research Pty Ltd, ABN 11 151 658 561 AFSL 421 445. All rights reserved. Read our Privacy Policy here.

One of the issues Lonsec has discussed within our investment committee process is the potential rise in market volatility and what it means for portfolios. Our view is that volatility is on the rise and that the likelihood of downside risk has increased.

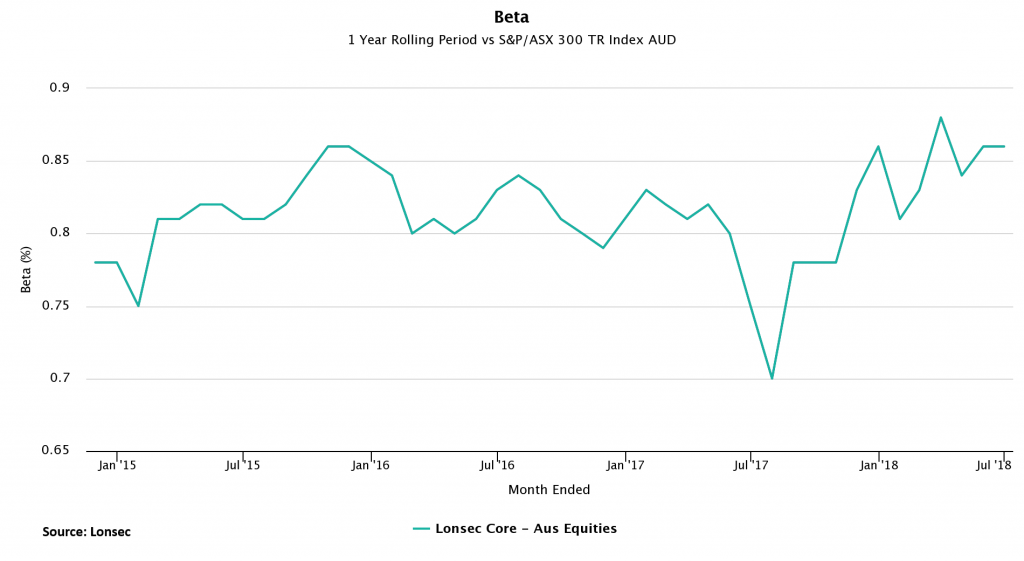
There are various ways of incorporating such views within the context of a portfolio. One of the ways Lonsec seeks to incorporate these views within our diversified portfolios is to manage the ‘systemic market risk’ (beta) within our portfolios via an allocation to investment strategies that have the flexibility within their portfolios to manage their beta exposure. A portfolio with a beta of less than 1 should perform better in a down-market and lag in an up-market.

Consistent with our view, we have been increasing our allocation to investment strategies that have the ability to vary their beta exposure. For example, in the Australian equities component of our portfolios we have added funds that can manage risk within their portfolio by allocating to cash. This is reflected in our overall beta exposure within the Australian equities component of our portfolios, which has been below 1. The chart below shows the rolling 1 year beta of the Australian equities component of our portfolios relative to the S&P/ASX 300 index.

Chart - Implementing a dynamic approach to portfolio construction

Important information: Any express or implied rating or advice is limited to general advice, it doesn’t consider any personal needs, goals or objectives.  Before making any decision about financial products, consider whether it is personally appropriate for you in light of your personal circumstances. Obtain and consider the Product Disclosure Statement for each financial product and seek professional personal advice before making any decisions regarding a financial product.