Archive for year: 2018

Shareholders burnt by Telstra’s dividend cut and spiralling share price should be wary of high yield shares with attractive dividends but shaky fundamentals. Telstra sparked an exodus of investors after announcing a cut in its dividend from 15.5c per share to 11c, with the challenges facing Australia’s major telco suddenly made palpable to mum and dad investors.

The lesson of Telstra is that investors should not invest purely for income or tax advantages (i.e. franking credits) at the expense of sound fundamentals. Despite being stuck in a downward trend since mid-2015, investors tolerated the stock’s poor performance so long as it maintained its attractive fully franked dividend.

The dividend cliff (TLS dividend $ per share)

*Expected

Source: Lonsec, Bloomberg, Telstra

The problem is that by the time a company is forced to cut its dividend, fundamentals have already deteriorated. In other words, investors waiting for the dividend cut as a signal to bail were already too late. While Telstra has confirmed a semi-annual dividend of 11c, FY19 guidance is vague, stating it will pay a dividend in the range of 70 to 90% of underlying earnings.

Telstra share price and P/E ratio

Source: Lonsec, Bloomberg

Since the end of its final privatisation, Telstra was the darling of mum and dad investors, who saw Telstra as a ‘national champion’ that could provide sustainable income over a long period of time. Telstra’s fundamentals came under threat in the form of competition from the NBN and other players like TPG, diminishing fixed-line revenue, and a crippling bureaucracy.

Telstra’s new strategy, named Telstra2022, splits out the telco’s infrastructure into a separate business and aims at reducing costs and improving customer service. Whether investors consider re-entering Telstra should depend on whether this strategy can improve the telco’s long-term prospects, rather than the success of short-term measures to boost profit and distributions.

Release ends

IMPORTANT NOTICE: This document is published by Lonsec Research Pty Ltd ABN 11 151 658 561, AFSL 421 445 (Lonsec).

Please read the following before making any investment decision about any financial product mentioned in this document.

Warnings: Lonsec reserves the right to withdraw this document at any time and assumes no obligation to update this document after the date of publication. Past performance is not a reliable indicator of future performance. Any express or implied recommendation, rating, or advice presented in this document is a “class service” (as defined in the Financial Advisers Act 2008 (NZ)) or limited to “general advice” (as defined in the Corporations Act (C’th)) and based solely on consideration of data or the investment merits of the financial product(s) alone, without taking into account the investment objectives, financial situation and particular needs (“financial circumstances”) of any particular person.

Warnings and Disclosure in relation to particular products: If our general advice relates to the acquisition or possible acquisition or disposal or possible disposal of particular classes of assets or financial product(s), before making any decision the reader should obtain and consider more information, including the Investment Statement or Product Disclosure Statement and, where relevant, refer to Lonsec’s full research report for each financial product, including the disclosure notice. The reader must also consider whether it is personally appropriate in light of his or her financial circumstances or should seek further advice on its appropriateness. It is not a “personalised service” (as defined in the Financial Advisers Act 2008 (NZ)) and does not constitute a recommendation to purchase, hold, redeem or sell any financial product(s), and the reader should seek independent financial advice before investing in any financial product. Lonsec may receive a fee from Fund Manager or Product Issuer (s) for reviewing and rating individual financial product(s), using comprehensive and objective criteria. Lonsec may also receive fees from the Fund Manager or Financial Product Issuer (s) for subscribing to investment research content and services provided by Lonsec.

Disclaimer: This document is for the exclusive use of the person to whom it is provided by Lonsec and must not be used or relied upon by any other person. No representation, warranty or undertaking is given or made in relation to the accuracy or completeness of the information presented in this document, which is drawn from public information not verified by Lonsec. Conclusions, ratings and advice are reasonably held at the time of completion but subject to change without notice. Lonsec assumes no obligation to update this document following publication. Except for any liability which cannot be excluded, Lonsec, its directors, officers, employees and agents disclaim all liability for any error, inaccuracy, misstatement or omission, or any loss suffered through relying on the information.

Copyright © 2018 Lonsec Research Pty Ltd, ABN 11 151 658 561 AFSL 421 445. All rights reserved. Read our Privacy Policy here.

India has been a high performing component of the emerging market and Asian indices over the past five years, driven by compelling demographics supporting mass scale consumerism, an improving business policy framework, and an underdeveloped infrastructure sector demanding ramped up investment.

Global developed market equities have generally outperformed emerging markets over the April 2008 to April 2018 period, but the more recent one year and three-year returns have favoured Asian, Chinese and Indian equities. Chinese investors have enjoyed a strong year, driven by economic stability and reduced concerns about debt imbalance. Indian equities have had an interesting journey. The chart and table below show the performance returns from various country and regional indices over the last 10 years.

Global indices performance (2008-2018)

Source: MSCI, Lonsec

Indian equities sold off heavily in the GFC then rallied alongside most risk assets through 2009 before enduring a two-year downward trajectory on concerns about economic stability and ‘Fragile Five’ labelling. That is, in a period where global investment sentiment was weak, India was viewed as being overly dependent on foreign capital to finance its economic growth. With capital flows retreating from India, the currency softened and equities weakened. All changed in early 2014 with the election of Modi’s BJP and the pro-business agenda proving a watershed moment in India’s history and kick-starting a four-year rally.

Performance of global equity indices for periods ending 30 April 2018 (% p.a.)

6 months 1 year 3 years 5 years 10 years
MSCI India NR Index AUD 2.48 11.55 9.68 14.95 4.59
MSCI China NR Index AUD 7.02 34.02 6.51 18.38 6.80
MSCI AC Asia Ex Japan NR Index AUD 6.43 22.86 8.53 15.08 7.12
MSCI Emerging Markets NR Index AUD 6.45 20.58 7.56 11.63 4.46
MSCI World Ex Australia NR Index AUD 5.08 12.40 9.24 16.78 7.92
S&P/ASX 200 Index AUD 3.37 5.46 7.53 7.53 5.29

Source: MSCI, Lonsec

India’s deep market

According to the Securities and Exchange Board of India (SEBI) there are 14 stock exchanges approved by SEBI for operation in India. The two major exchanges are the Bombay Stock Exchange (BSE) and National Stock Exchange (NSE) with all listed companies in India listed on either the BSE or NSE or both. The NSE was formed by the Government in 1994 and operates the Nifty 50 index (the market cap of the leading 50 companies across various sectors). The BSE is Asia’s oldest stock exchange and was established in 1875.

The market for listed companies in India is deep with over 5,000 companies listed on the BSE and around 2,000 on the NSE. This makes India the largest equity market globally. The MSCI India index in AUD is the standard reference benchmark for Indian equities performance. It holds 79 stocks as at April 2018 and covers approximately 85% of the Indian equity universe. It is skewed towards the largest companies in India (80%) but holds a modest mid cap exposure (20%). The top 10 stocks dominate the benchmark and comprise nearly 50% of the Index and is populated by familiar names such as HDFC, Reliance Industries, Infosys and Tata Consultancy (TCS).

In terms of sectors, the Index is dominated by Financials (24%), Information Technology (16%), Energy (13%), and Consumer Discretionary (12%). The below chart compares the sector composition today with five years ago and shows similar composition with a modest rise in consumer discretionary, health care and material stocks at the expense of a lower financials weight.

MSCI India sector composition 2013 and 2018 (sector average weight)

Source: MSCI, Lonsec

The chart below compares the total return of each sector over the same period. Alongside consumer staples, healthcare stocks were a major driver of performance in 2013. Fast forward to today and healthcare was a drag on performance over the past year with concerns about the global competition forces impacting on India’s leading pharmaceutical stocks like Sun Pharmaceuticals and Dr Reddy’s Laboratories. IT stocks were the biggest contributor to benchmark performance in 2018 with names like TCS and Infosys benefiting from strong global demand for their services.

MSCI India sector performance 2013 and 2018 (sector total return)

Source: MSCI, Lonsec

The below chart compares the sector contribution to total market return by sector over the same periods and shows that information technology companies contributed nearly 40% of the return in 2018 while financials drove the benchmark in 2013 attributable to close to 50% of the benchmark return.

MSCI India sector performance 2013 and 2018 (% contribution to total market return)

Source: MSCI, Lonsec

The Indian equity market has displayed a remarkable degree of dynamism, and Lonsec believes there are long-term opportunities available for investors looking for emerging market exposure. Investors have an array of choice between active and passive investment when considering investing in India. This post forms part of a broader article on access to Indian market exposure and strategies. To read the full article, log on to iRate or contact our client services team.

IMPORTANT NOTICE: This document is published by Lonsec Research Pty Ltd ABN 11 151 658 561, AFSL 421 445 (Lonsec).

Please read the following before making any investment decision about any financial product mentioned in this document.

Warnings: Lonsec reserves the right to withdraw this document at any time and assumes no obligation to update this document after the date of publication. Past performance is not a reliable indicator of future performance. Any express or implied recommendation, rating, or advice presented in this document is a “class service” (as defined in the Financial Advisers Act 2008 (NZ)) or limited to “general advice” (as defined in the Corporations Act (C’th)) and based solely on consideration of data or the investment merits of the financial product(s) alone, without taking into account the investment objectives, financial situation and particular needs (“financial circumstances”) of any particular person.

Warnings and Disclosure in relation to particular products: If our general advice relates to the acquisition or possible acquisition or disposal or possible disposal of particular classes of assets or financial product(s), before making any decision the reader should obtain and consider more information, including the Investment Statement or Product Disclosure Statement and, where relevant, refer to Lonsec’s full research report for each financial product, including the disclosure notice. The reader must also consider whether it is personally appropriate in light of his or her financial circumstances or should seek further advice on its appropriateness. It is not a “personalised service” (as defined in the Financial Advisers Act 2008 (NZ)) and does not constitute a recommendation to purchase, hold, redeem or sell any financial product(s), and the reader should seek independent financial advice before investing in any financial product. Lonsec may receive a fee from Fund Manager or Product Issuer (s) for reviewing and rating individual financial product(s), using comprehensive and objective criteria. Lonsec may also receive fees from the Fund Manager or Financial Product Issuer (s) for subscribing to investment research content and services provided by Lonsec.

Disclaimer: This document is for the exclusive use of the person to whom it is provided by Lonsec and must not be used or relied upon by any other person. No representation, warranty or undertaking is given or made in relation to the accuracy or completeness of the information presented in this document, which is drawn from public information not verified by Lonsec. Conclusions, ratings and advice are reasonably held at the time of completion but subject to change without notice. Lonsec assumes no obligation to update this document following publication. Except for any liability which cannot be excluded, Lonsec, its directors, officers, employees and agents disclaim all liability for any error, inaccuracy, misstatement or omission, or any loss suffered through relying on the information.

Copyright © 2018 Lonsec Research Pty Ltd, ABN 11 151 658 561 AFSL 421 445. All rights reserved. Read our Privacy Policy here.

Australia’s small cap shares have continued their extraordinary run of outperformance, returning 4.1% over the past three months to May, and an incredible 25.4% over the past year. Meanwhile, in a tale of two markets, Australia’s largest shares have proved the laggards, with structural headwinds, regulatory risks, and declining public trust dragging the top of the market down.

Small cap shares have continued to present significant opportunities through 2018, with themes such as technological disruption, Chinese demand, and the commodity rally all driving valuations higher. The beneficiaries have been previously ‘beaten-up’ mining services stalwarts such as Monadelphous (MND) and NRW Holdings (NWH), as well as consumer staple market darlings like organic infant formula producer Bellamy’s (BAL).

Small versus large cap performance over five years to 31 May 2018

Source: Lonsec, Bloomberg

The S&P/ASX 20, which encompasses Australia’s top 20 biggest stocks by market cap, is underperforming the broader market, returning 6.9% over the past year, compared to 9.6% for the ASX 200. In particular, recent poor performance from the banks, as well as problem stocks like Telstra (TLS), Brambles (BXB), and AMP (AMP) have all been a drag. The sheer size of these stocks has had a big impact on the market, with the five worst performing stocks within the top 20 wiping $51.6 billion from the S&P/ASX 200 Index over the past year.

Australia’s biggest losers (% return over year to 31 May 2018)

Source: Lonsec, Bloomberg

In terms of Australia’s major banks, Lonsec currently views valuation support at ‘fair value’, while earnings are likely to exhibit low growth at best, due to weaker consumer sentiment and the increased regulatory risk in the wake of the Royal Commission into Financial Services. However, despite the recent pain, it is possible the worst may be over for now, and investors will be looking for long-term value opportunities among the big four.

Release ends

IMPORTANT NOTICE: This document is published by Lonsec Research Pty Ltd ABN 11 151 658 561, AFSL 421 445 (Lonsec).

Please read the following before making any investment decision about any financial product mentioned in this document.

Warnings: Lonsec reserves the right to withdraw this document at any time and assumes no obligation to update this document after the date of publication. Past performance is not a reliable indicator of future performance. Any express or implied recommendation, rating, or advice presented in this document is a “class service” (as defined in the Financial Advisers Act 2008 (NZ)) or limited to “general advice” (as defined in the Corporations Act (C’th)) and based solely on consideration of data or the investment merits of the financial product(s) alone, without taking into account the investment objectives, financial situation and particular needs (“financial circumstances”) of any particular person.

Warnings and Disclosure in relation to particular products: If our general advice relates to the acquisition or possible acquisition or disposal or possible disposal of particular classes of assets or financial product(s), before making any decision the reader should obtain and consider more information, including the Investment Statement or Product Disclosure Statement and, where relevant, refer to Lonsec’s full research report for each financial product, including the disclosure notice. The reader must also consider whether it is personally appropriate in light of his or her financial circumstances or should seek further advice on its appropriateness. It is not a “personalised service” (as defined in the Financial Advisers Act 2008 (NZ)) and does not constitute a recommendation to purchase, hold, redeem or sell any financial product(s), and the reader should seek independent financial advice before investing in any financial product. Lonsec may receive a fee from Fund Manager or Product Issuer (s) for reviewing and rating individual financial product(s), using comprehensive and objective criteria. Lonsec may also receive fees from the Fund Manager or Financial Product Issuer (s) for subscribing to investment research content and services provided by Lonsec.

Disclaimer: This document is for the exclusive use of the person to whom it is provided by Lonsec and must not be used or relied upon by any other person. No representation, warranty or undertaking is given or made in relation to the accuracy or completeness of the information presented in this document, which is drawn from public information not verified by Lonsec. Conclusions, ratings and advice are reasonably held at the time of completion but subject to change without notice. Lonsec assumes no obligation to update this document following publication. Except for any liability which cannot be excluded, Lonsec, its directors, officers, employees and agents disclaim all liability for any error, inaccuracy, misstatement or omission, or any loss suffered through relying on the information.

Copyright © 2018 Lonsec Research Pty Ltd, ABN 11 151 658 561 AFSL 421 445. All rights reserved. Read our Privacy Policy here.

Australian fund managers with a value focused investment strategy are struggling to keep up with the index as the market continues its shift in favour of growth stocks.

While value shares have outperformed growth over the past ten years, growth shares have been in front for the past five, despite a value comeback in 2016 and the early part of 2017. Recent performance shows that growth has extended its lead even further, while the average return for value managers is in negative territory so far in 2018 (see chart below).

Calendar year returns for Australian growth and value equity fund managers (% p.a.)

Source: Lonsec

Includes value and growth style Australian equity fund managers rated by Lonsec Research

Value investors look for well-run businesses with solid company fundamentals that may be undervalued due to industry headwinds or temporary negative events. In contrast, growth investors look for businesses with high growth potential or earnings momentum, which can include smaller, scalable businesses or established market leaders.

The behaviour of value and growth shares over different periods, and the tendency for one or the other to outperform, underlines the importance of diversification, not just across markets and sectors, but across investment styles as well. For example, despite the five-year trend, value has outperformed growth significantly over a twenty-year period.

Value versus growth shares (growth of $10,000 to May 2018)

Source: Lonsec, Bloomberg

Despite the relatively lacklustre performance of Australian shares in 2018, growth companies have remained in favour and are currently the main drivers of market returns, among them consumer staples shares like A2 Milk Co (A2M) and Treasury Wine Estates (TWE), as well as some big names like CSL (CSL), Australia’s leading biotechnology business.

Growth shares have dominated through the end of 2017 and the first half of 2018

Source: Lonsec, Bloomberg

Meanwhile, value shares (represented by the MSCI Australia Value Index) have been weighed down by recent poor performance from financials and telecommunication shares, including the major banks which have come under pressure from the Royal Commission into Financial Services. The banks may become attractive propositions from a value perspective, but the question is how long it will take before they regain favour from the broader market.

Release ends

IMPORTANT NOTICE: This document is published by Lonsec Research Pty Ltd ABN 11 151 658 561, AFSL 421 445 (Lonsec).

Please read the following before making any investment decision about any financial product mentioned in this document.

Warnings: Lonsec reserves the right to withdraw this document at any time and assumes no obligation to update this document after the date of publication. Past performance is not a reliable indicator of future performance. Any express or implied recommendation, rating, or advice presented in this document is a “class service” (as defined in the Financial Advisers Act 2008 (NZ)) or limited to “general advice” (as defined in the Corporations Act (C’th)) and based solely on consideration of data or the investment merits of the financial product(s) alone, without taking into account the investment objectives, financial situation and particular needs (“financial circumstances”) of any particular person.

Warnings and Disclosure in relation to particular products: If our general advice relates to the acquisition or possible acquisition or disposal or possible disposal of particular classes of assets or financial product(s), before making any decision the reader should obtain and consider more information, including the Investment Statement or Product Disclosure Statement and, where relevant, refer to Lonsec’s full research report for each financial product, including the disclosure notice. The reader must also consider whether it is personally appropriate in light of his or her financial circumstances or should seek further advice on its appropriateness. It is not a “personalised service” (as defined in the Financial Advisers Act 2008 (NZ)) and does not constitute a recommendation to purchase, hold, redeem or sell any financial product(s), and the reader should seek independent financial advice before investing in any financial product. Lonsec may receive a fee from Fund Manager or Product Issuer (s) for reviewing and rating individual financial product(s), using comprehensive and objective criteria. Lonsec may also receive fees from the Fund Manager or Financial Product Issuer (s) for subscribing to investment research content and services provided by Lonsec.

Disclaimer: This document is for the exclusive use of the person to whom it is provided by Lonsec and must not be used or relied upon by any other person. No representation, warranty or undertaking is given or made in relation to the accuracy or completeness of the information presented in this document, which is drawn from public information not verified by Lonsec. Conclusions, ratings and advice are reasonably held at the time of completion but subject to change without notice. Lonsec assumes no obligation to update this document following publication. Except for any liability which cannot be excluded, Lonsec, its directors, officers, employees and agents disclaim all liability for any error, inaccuracy, misstatement or omission, or any loss suffered through relying on the information.

Copyright © 2018 Lonsec Research Pty Ltd, ABN 11 151 658 561 AFSL 421 445. All rights reserved. Read our Privacy Policy here.

In the world of haute couture, a famous designer once quipped – “In a world full of trends, I want to remain a classic”.

At Investors Mutual we would rephrase it as: “In a world full of trends, we want to remain a true-to-label value investor”.

The past 18 months has been a challenging and at times a frustrating environment for value investors. At IML we pride ourselves on our strict adherence to the IML investment mantra which has defined our approach to investing for the past 20 years – through all market cycles. That is to buy and own companies with a competitive advantage, with recurring earnings, run by capable management, that can grow, at a reasonable price.

This can be neatly described as an investment style of Value with a strong focus on Quality. However, over the past 18 months this proven approach has significantly lagged the styles of Growth and Momentum based investing.

A quick recap of the different styles

Value investors 

Seek companies whose share prices are trading below their intrinsic value as determined by bottom-up, fundamental analysis. This may include buying companies that are trading below their tangible book value, their net asset value, that have a long history of earnings and dividends and that trade at reasonable valuations.

Growth investors 

Seek companies that exhibit above average earnings growth and often are happy to buy when the share price looks expensive or trading well ahead of reasonable fundamentals. Growth investing is an act of faith, often buying earnings which have not yet materialised or where a company is expected to continue grow at a quick pace well into the future. Traditionally these companies trade on very high PE ratios as their earnings are expected to continue to accelerate for many years into the future.

Momentum strategies

Disregards much of the fundamental analysis that Value and Growth investors utilise. Momentum investors seek to capitalise on a continuation of short term existing trends. To put it simply this style – often used by quant investors and hedge funds – buys because the share price is trending higher or sells because it is trending lower. This style includes investing in whatever current market fads or concepts are capturing investors’ imagination. This style is self-fulfilling for a time as the more people believe the hype, the more the share price incites others to jump in.

So where are we today and why has it been a challenging 18 months for a Value investor?

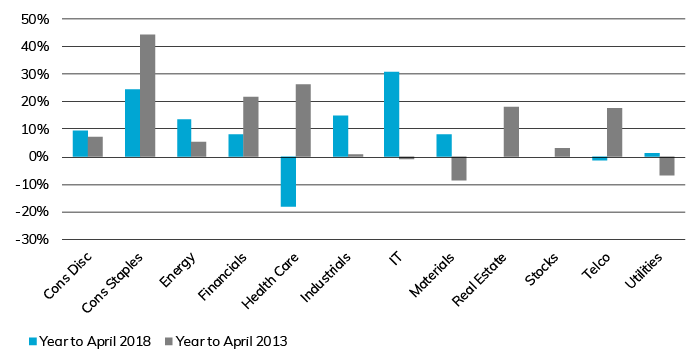
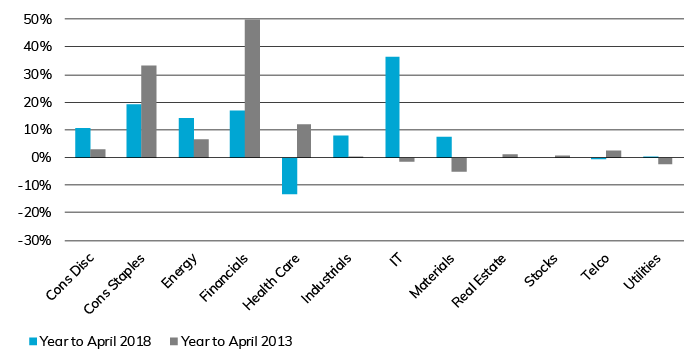
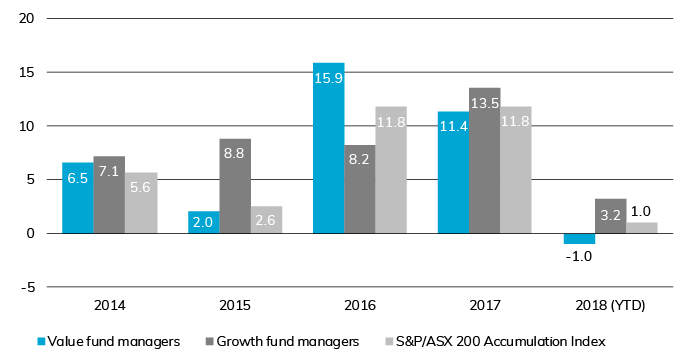
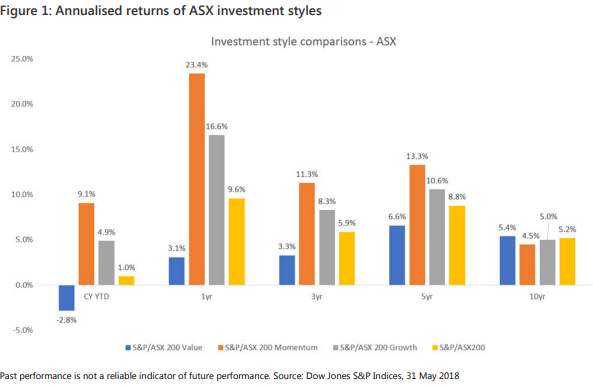
As can be seen from figure 1: Momentum and Growth have outperformed Value and the ASX300 by a significant margin over the last 12 months. The scale of the out performance of the last 12-18 months has been so significant that it is now impacting the 3- to 5-year comparisons.

Figure 1: Annualised returns of ASX investment styles

There are a number of dynamics at play in the current market

We are now nine years into the current market phase which has been driven by a record breaking US market and by continued record low interest rates in many parts of the world – including Australia. Since Donald Trump was elected 18 months ago the US market has risen strongly and until recently volatility was at all-time lows. This renewed and unflinching sense of confidence in the sharemarket has made it difficult for Value investors such as IML to keep pace with the sharemarket, while the environment has favoured both Growth and Momentum strategies.

The majority of companies we visit continue to indicate that conditions remain very competitive in many industries and it remains a challenging environment to grow profits. As an experienced Value manager, it makes little sense in this environment to take on additional risk and pay excessive multiples for stocks which are attractive because they are growing faster than the average company.

However, over this same period many Growth and Momentum managers have shown a willingness to pay high multiples for companies such as; Treasury Wines, Bluescope Steel, Qantas, A2 Milk, NextDC, Cochlear, Macquarie Bank, Resmed and Aristocrat. While many of these are decent companies we challenge the thesis of buying these companies on such high valuations simply because of their short-term earnings outlook. It seems to us that some of the buying is being fuelled by hopes that current macro conditions will last forever.

As an example, a major theme has been the stellar performance of companies rising on exposure to the ‘daigou’ market into China, share prices continue to be based on the expectation that they can sell ever larger amounts of their products into China without any hitches.

We continue to ask ourselves when looking at many of these companies: is too much faith being baked into the future earnings projections of these companies? It seems to us that many companies are priced to perfection and any small slip or earnings downgrade will lead to a very rapid derating in many of these companies.

As demand for these Growth companies continue, we are now seeing Momentum strategies joining in and bidding these stocks up to vastly excessive valuations. The past 12 months has resulted in a very narrow universe of growth and momentum type stocks driving the market higher, whilst good quality industrial companies with modest yet sustainable earnings have lagged.

As Value managers, it is not our style to participate in this exuberance, we have a clear valuation framework around every company in our universe and one which we have always stuck to successfully since our inception.

Resources v Industrials – another growth v value conundrum

This brings us to the topic of the significant outperformance of Resources over Industrials since February 2016, which is also a major factor contributing to IML’s portfolios recent underperformance. Resource stocks by virtue of their nature fit the designation of chasing growth. IML always takes a cautious view on Resources given their high volatility and unpredictable earnings. Resource companies’ earnings and dividends remain beholden to the movement in underlying commodity prices, which remains totally unpredictable – as clearly seen in the last few years in the wild swings we have seen in the prices of commodities such as oil and iron ore.

In January 2016 commodity prices reached decade lows (yet still above longer-term averages), beset by global oversupply, tepid economic growth and significant concern for China’s financial markets. However, the Chinese Government responded with significant amounts of stimulus which helped many commodity prices to rapidly recover and in turn to a significant rally for Resource companies.

IML has always preferred to invest clients’ monies in a diversified portfolio of good quality Industrial companies. This method of investing in quality Industrial companies allows the prudent investor such as IML to model out the earnings streams of these companies into the future with some degree of certainty. Such a diversified portfolio of good quality Industrial companies will also provide investors with a predictable income stream in the form of dividends over time.

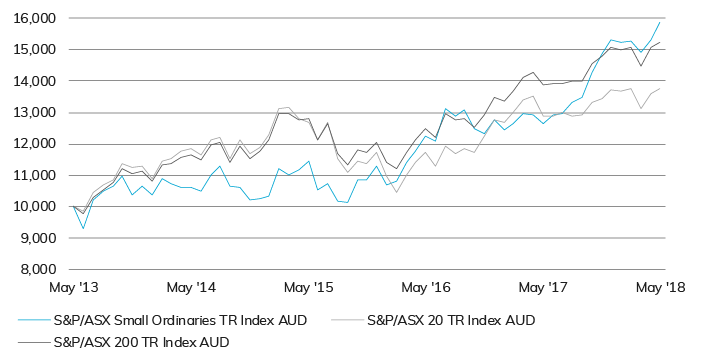
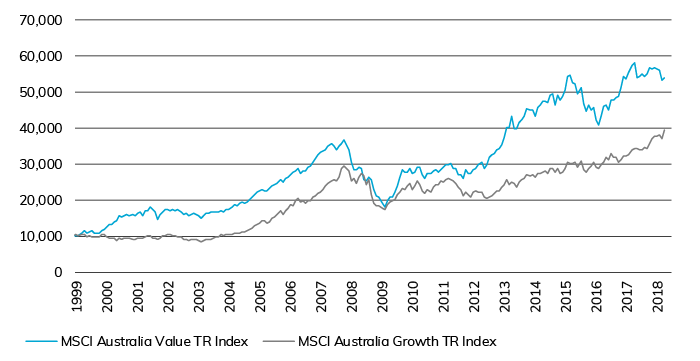
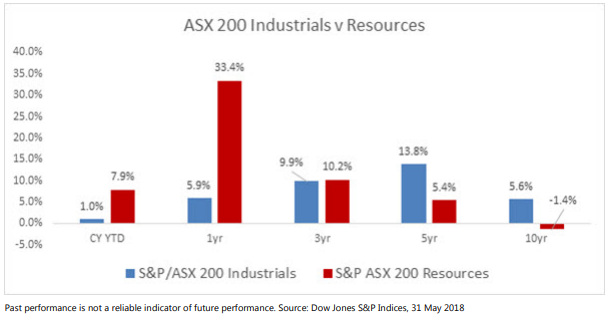
While at times a difficult market for value investors, we remain confident in our long-term approach and point to figure 2 below highlighting the long-term performance of the Industrials and Resources sectors. It is worth highlighting that the Resources sector returns are negative on a total return basis over 10 years.

Figure 2: ASX Industrials v Resources

What are we buying and why?

We have been buying the following companies on current share price weakness, companies which we believe have very resilient earnings, and strong management teams, yet whose share prices are all being impacted by factors which, in our view, are temporary in nature. We believe these investments will serve IMLs portfolios and their investors well in the longer term.

Amcor – a resilient global packaging company which is currently under pressure due to higher input prices and uncertainty around their emerging markets businesses. Amcor generates strong cash flows and has been relatively inactive on M&A for a while now as target businesses have been excessively priced. If reasonable acquisitions don’t eventuate, the focus will return to capital management which has been a key facet of Amcor’s strategy for capital deployment in the past.

Brambles – a global pallet pooling business, currently trading on 16.5x PE, with benefits still to come from productivity increases in its US pallet business. Brambles’ share price is currently trading lower because of fears that increases in lumber and transport costs will impact margins.

Pact Group – a rigid plastic packaging company which has diversified their business into contract manufacturing and materials handling. Concerns around organic growth from recent results have weighed on the share price, however we think Pact has a very strong management team, and is a durable business which can grow earnings over time via continued cost-outs and bolt-on acquisitions.

Caltex – a leading fuel distributor in Australia with a hard-to-replicate infrastructure network across the country. The share price has been weak of late due to slower near-term earnings growth as refining margins have declined and the company transitions from a franchise model to company operated.

Transurban – a toll road operator with a quality portfolio of roads spanning Sydney, Melbourne, Brisbane and the US, currently offering investors a 5.1% dividend yield with strong growth. Transurban’s share price is currently weighed down by uncertainty surrounding the WestConnex sale process.

Conclusion

The last 18 months has been a difficult market to perform in for value investors such as IML. Companies caught up in the latest theme, fad or concept are being rewarded despite, at times, questionable fundamentals and often a distinct lack of sustainable earnings.

We continue to remain disciplined in continuing to focus on the fundamentals of all the companies we invest in and we seek to not over pay for companies that are often over promising and on companies where the outcome
is often far from certain. With many companies’ valuations stretched, we continue to believe that portfolios underpinned by value and quality stocks remain the best place to be.

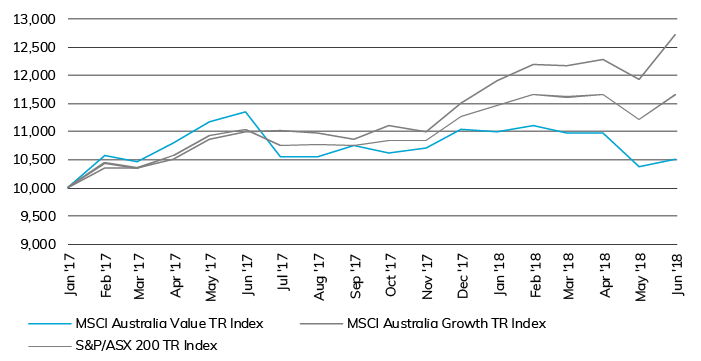
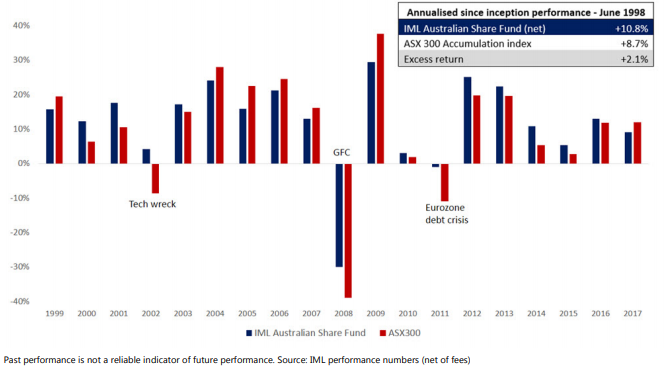
Referencing figure 3 below, IML’s proven and successful investment approach has guided investors through volatile and challenging times, notably the tech wreck of 2001-02, the GFC in 2008 and the Eurozone debt crisis of 2011. We remain prudently positioned for any possible correction.

While the information contained in this article has been prepared with all reasonable care, Investors Mutual Limited (AFSL 229988) accepts no responsibility or liability for any errors, omissions or misstatements however caused. This information is not personal advice. This advice is general in nature and has been prepared without taking account of your objectives, financial situation or needs. The fact that shares in a particular company may have been mentioned
should not be interpreted as a recommendation to buy, sell or hold that stock. Investors Mutual Limited does not guarantee the performance of any Fund, repayment of capital or any particular rate of return. Performance returns are
calculated using the exit price, net of management fees and assuming the reinvestment of distributions. No allowance is made for tax. Past performance is not indicative of future performance. Returns can be volatile, reflecting rises and falls in the value of the underlying investments. Investors should seek independent advice as to the suitability of the Fund to their investment needs.

Investors Mutual Limited is the issuer of the Investors Mutual Australian Share Fund. Applications can only be made by reference to the current Product Disclosure Statement or through IDPS products that include these Funds. The Product Disclosure Statement can be obtained by contacting Investors Mutual or at http://www.iml.com.au/how-to-invest/pds-and-forms. Potential investors should consider the Product Disclosure Statement before deciding whether to
invest, or continue to invest in the Fund.

Lonsec Investment Solutions was established to help financial advisers start implementing separately managed account (SMA) solutions. Learn how Lonsec leverages its market-leading research to deliver quality SMA model portfolios.


The federal government has taken a step toward providing better retirement outcomes for Australians with the appointment of an industry panel to advise on the development of Comprehensive Income Products for Retirement (CIPRs).

Its brief is to help frame the government’s plans to require superannuation trustees to design and offer appropriate income products for their members in retirement.

The panel’s expertise suggests that the eventual framework will reflect a deep understanding of the legal and technical aspects of retirement as well as the social and financial-planning needs of retirees, and perhaps also their behavioural biases.

Regarding the design of income products, it will be interesting to see whether the framework will point super funds in the direction of annuity-like products or drawdown solutions or a combination of the two―or a more expansive and flexible range of choices.

More interesting still will be to see how effectively the framework synthesises these various elements because, as experience in other markets shows, retirees’ financial behaviour can have a direct impact on the success or otherwise of attempts to develop new retirement income products.

The UK is a case in point.

UK Retirees Sit on Cash

Up until 2015 the purchase of an annuity was effectively the only choice open to UK investors when they retired, but low interest rates and other limitations had made annuities unpopular. From that year, the government allowed retirees to choose between annuities and drawdown products.

Predictably, sales of annuities in the UK have plummeted, forcing a restructuring of the retirement income market. Progress to date has been slow, however, and of limited benefit to retirees.

For example, the drawdown alternatives to annuities are mainly high-cost, being accessed through financial advisers and invested in the markets. Perhaps not surprisingly, regulation of such post-retirement products has increased, making them potentially more expensive and harder to access.

At the same time, new product development has been slow. Inflows into those products which have been launched have been small, providing little incentive for competition.

It’s in relation to this last point that the financial behaviour of retirees appears to be most relevant.

Since the pension freedoms came into effect, many retirees have taken large volumes of cash out of their savings early, despite the higher tax charges this incurs.

They have put that cash mainly into (in order of magnitude) bank accounts earning little to no interest and, anecdotally, into cars, conservatories and cruises.

But that’s not all: large amounts of money have been left invested in plan default solutions. Consequently, the amount of money remaining invested beyond retirement, which is neither being drawn down nor added to but kept for a rainy day, has grown massively.

Little wonder, then, that inflows to new retirement income products in the UK have been small.

What lessons, if any, should the panel―and, indeed, the rest of the Australian retirement industry―draw from this?

Three Angles on Retirement Income

There are three, in our view. One is to integrate into the government’s framework some understanding of retirees’ behaviour with respect to savings and investment, its potential impact on demand for retirement products, and how retirement products might be designed with retirees’ behaviour in mind.

Another lesson is that some thought might usefully be given to the way retirees step from work to retirement. It’s at this point that retirees’ financial behaviour becomes an issue as they make, or fail to make, important decisions for their future.

Their decisions could conceivably improve if they had more time to make them. They could, for example, continue to enjoy some capital growth as well as income for many years before investing at a more advanced age in an income-only product.

The third lesson, which is linked to the second, is to view CIPRs as part of a broader retirement solution which includes equity products that can provide growth while managing downside risk, and fixed-income products that can provide reliable income with better-than-average stability.

As the UK experience shows, the key to creating a successful retirement-income solution might lie in understanding, and allowing for, a range of factors beyond that of simple product design.

The views expressed herein do not constitute research, investment advice or trade recommendations and do not necessarily represent the views of all AB portfolio-management teams.

In recognition of the growing challenges facing retirees, Lonsec has published a paper on the role annuities can play in retirement portfolios. The paper explores some of the common issues facing retirees such as sequencing risk, longevity risk and market risk.

The main benefits and risks of annuities are considered as well as how annuities can mitigate these risks. The paper examines how annuities can work with the age pension and other investment products to help retirees meet essential spending objectives as well as provide for discretionary spending.

Lonsec believes that annuities are an attractive proposition for retirees looking to secure part of their retirement income stream, including in conjunction with the age pension, to boost the amount of guaranteed income during retirement. Additionally, Lonsec notes that there is a mass market of retirees for whom annuities may be appropriate, typically those with retirement savings of between $250,000 to $1,500,000.

Lonsec does not have a preferred means to best make an allocation to annuities within a diversified investment portfolio but notes there are two commonly held schools of thought. The first is to allocate from the defensive assets within a portfolio and the second is to ‘carve-out’ a separate allocation for the annuity and retain the existing asset class weightings over a smaller asset base.

We are in the business of educating our clients on the importance of retirement planning. But research has shown that a one-size-fits-all approach to communication isn’t the most effective tactic. And while it’s impossible to customise messages person by person, it turns out that it’s quite easy to customise them by one big factor: gender. It’s widely accepted that there are differing preferences in communication styles and learning techniques between most men and most women. The question is: How can you adjust your message in a way that’s enlightening, not alienating for your female participants?

The risks of not being prepared

Before I answer that question, I want to reinforce why this topic is so important. Women have longer average lifespans than men, and retire earlier, with much less Superannuation than men, yet tend to underestimate how much they need to save for retirement.

Avoiding labels

At this point, you may be thinking that I’m going to suggest a series of women-branded workshops or educational flyers stamped in pink.

But I’m not.

When Invesco Consulting began the process of creating a workshop for women, we tested numerous options for titles with specific references to women, and one of the first things we heard from women is that they do not want to be singled out by their gender. In fact, any title that included a gender reference — such as “What Women Know About Money” or “The Female Financial Advantage” — consistently scored in the bottom 20% of engagement.

Why? Because women often view these approaches as carrying a subtle suggestion of inferiority, as if the “women’s version” was created for those who don’t qualify for the regular workshop. We found that a better approach is to create educational workshops and materials with the preferences of women in mind, but which doesn’t highlight them as “special” or “different.” In other words, simply work to meet the needs of your women participants — without labeling them.

Three key principles

This is the approach Invesco Consulting took when creating our investor education workshop “Your Prosperity Picture” (notice the lack of women-specific labels in the title). We found that there are three key principles that resonate with many women investors, and we incorporated these in our program:

Principle 1: Provide experience before explanation

Principle 2: Align life goals with financial goals

Principle 3: Be positive

Principle 1: Provide experience before explanation.

According to the Public Administration & Policy – APAC Journal, 3 women tend to be “Relational Learners” while men are usually more “Independent Learners.” We found that beginning a workshop with an interactive activity (instead of just launching into a presentation) can be a great way to tap into that learning preference for many women. But what kind of activity? In a column I wrote — “What will retirement look like?” — I discussed the power of visualisation exercises. Science has shown that if you visualise a particular goal that requires financial resources, such as traveling or pursing a hobby, it helps condition the brain to look for information and resources that might help in achieving that goal. Walking investors through a visualisation exercise that focuses on their goals can be a great way to begin a financial workshop.

Principle 2: Align life goals with financial goals.

One study has shown that women who feel their financial advisors have successfully helped them align their investment goals with their life goals are 41% more likely to be satisfied. In “Your Prosperity Picture” workshops, we do this by walking investors through the process of creating a visual financial plan that illustrates their short-term and long-term goals, and organises them by the amount of financial resources that will be necessary to make those goals happen.

Once investors are talking and thinking about their vision for their retirement, the next logical step is to connect that vision with your retirement plan benefits. You’ve set the stage to talk about practical strategies geared toward making their goals happen.

Principle 3: Be positive.

I started this column with some sobering statistics about women’s retirement age and retirement superannuation balance. I did that to set the stage for you, the Financial Advisor, but I would not include these in an investor workshop. Our research has clearly shown that negative spin doesn’t sit well with most women investors, and trying to scare them into action can backfire. In fact, the principle of being positive is so powerful that it transcends gender. It’s proven to be one of the most important and consistent language trends that Invesco Consulting has seen since we began doing our language research in 2009.

What does this mean for Financial Advisors? Rather than focusing on the possibility of negative outcomes and how to avoid them, focus on achieving what’s possible. Position your retirement plan as a way to help investors reach their goals, rather than taking a gloom-and-doom approach.

Bottom line

In general, women and men have different learning styles and communication preferences, but women don’t want to be singled out. A workshop designed for these needs won’t include “women” in the title, but will follow three key principles: providing experience before explanation, aligning life goals with financial goals, and maintaining a positive message.


Important information
This document has been prepared by Invesco Australia Ltd (Invesco) ABN 48 001 693 232, Australian Financial Services Licence number 239916, who can be contacted on freecall 1800 813 500, by email to info@au.invesco.com, or by writing to GPO Box 231, Melbourne, Victoria, 3001. You can also visit our website at www.invesco.com.au

This document contains general information only and does not take into account your individual objectives, taxation position, financial situation or needs. You should assess whether the information is appropriate for you
and consider obtaining independent taxation, legal, financial or other professional advice before making an investment decision. A Product Disclosure Statement (PDS) for any Invesco fund referred to in this document is available from Invesco. You should read the PDS and consider whether a fund is appropriate for you before making a decision to invest.

Invesco is authorised under its licence to provide financial product advice, deal in financial products and operate registered managed investment schemes. If you invest in an Invesco Fund, Invesco may receive fees in relation
to that investment. Details are in the PDS. Invesco’s employees and directors do not receive commissions but are remunerated on a salary basis. Neither Invesco nor any related corporation has any relationship with other product issuers that could influence us in providing the information contained in this document.

Investments in the Invesco funds are subject to investment risks including possible delays in repayment and loss of income and principal invested. Neither Invesco nor any other member of the Invesco Ltd Group guarantee the return of capital, distribution of income, or the performance of any of the Funds. Any investments in the Funds do not represent deposits in, or other liabilities of, any other member of the Invesco Ltd Group.

Invesco has taken all due care in the preparation of this document. To the maximum extent permitted by law, Invesco, its related bodies corporate, directors or employees are not liable and take no responsibility for the accuracy or completeness of this document and disclaim all liability for any loss or damage of any kind (whether foreseeable or not) that may arise from any person acting on any statements contained in this document. This document has been prepared only for those persons to whom Invesco has provided it. It should not be relied upon by anyone else.

©Copyright of this document is owned by Invesco. You may only reproduce, circulate and use this document (or any part of it) with the consent of Invesco.

Our goal is simple: we want to understand everything we can about super and how we can help end investors get the most value out of their investment.

Important information: Any express or implied rating or advice is limited to general advice, it doesn’t consider any personal needs, goals or objectives.  Before making any decision about financial products, consider whether it is personally appropriate for you in light of your personal circumstances. Obtain and consider the Product Disclosure Statement for each financial product and seek professional personal advice before making any decisions regarding a financial product.