
One of the lasting achievements of sports like golf and horse racing is the way the handicapping system can make it possible for athletes to engage in a close and enjoyable competition despite obvious differences in ability, experience or personal characteristics. In Thoroughbred horse racing, the older steeds would otherwise win most races, hence the ‘weight-for-age’ system, whereby each horse carries a small additional saddle weight based on statistical analysis of the historical differences in ability by age. The system has been working well for more than a century – so why can’t we do the same for measuring super investment returns?
In January this year, the Productivity Commission handed down its final report to the Federal government on its investigation into the superannuation system. One of the terms of reference for the inquiry was the following:
‘The Productivity Commission should develop criteria to assess whether and the extent to which the superannuation system is efficient and competitive and delivers the best outcomes for members and retirees, including optimising risk-adjusted after fee returns.’
It is of course widely accepted in the superannuation industry that there is a trade-off between risk and return. Moreover, there is a general consensus that performance comparisons should be done on the basis of products with a similar risk profile.
The most common risk metric tracks the amount of change in return over time (technically, it is the ‘standard deviation’ of the net investment return measured over a specified period, also known as ‘volatility’). It should be noted that this is a measure of ‘market’ risk only – arguably a young investor saving for retirement should be more concerned about the risk of losing her capital (‘capital risk’) due to poor quality asset selection, but there are currently few metrics for this. A ‘Standard Risk measure’ must be displayed on MySuper Dashboards in accordance with the Corporations Act, and the SRM is essentially a Market Risk metric, expressed as the expected number of negative returns over a 20-year period, based on modelling of the fund’s investment strategy.
A long-standing proxy for Market risk has been the ‘Growth Ratio’ or the percentage of funds allocated to ‘Growth’ type assets, such as shares, property and, more recently, infrastructure. There has also been much discussion about the methods used by funds to report the percentage of growth assets, particularly in relation to unlisted asset classes like property, infrastructure and hedge funds.
How good is the handicapping system used within our industry? Despite some limitations, there seems to be a reasonable level of consistency across the different metrics, and returns are consistent with the expected risk / return trade-off. The following graph is based on median rolling returns and volatility (risk) over the three-year period to 30 June 2019:
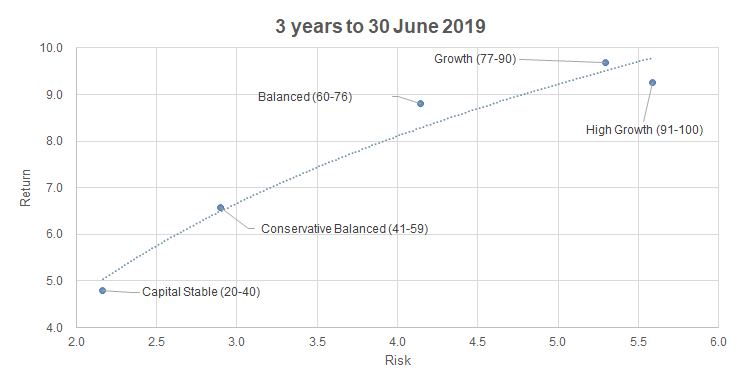
With the exception of ‘High growth’, the relationship between median risk and return is in line with expectations. Even so, there is still a potentially wide dispersion of risk / return combinations within each classification. Is there a way to apply a handicapping system to enable a fair comparison across and within the risk profile categories?
The Productivity Commission was tasked with optimising ‘risk-adjusted’ returns. The ‘Sharpe Ratio’ is one such metric – it attempts to adjust for the trade-off between risk and return (technically, it is a measure of excess portfolio return over the risk-free rate relative to its standard deviation). It does this by giving a lower weight to excess return earned from taking additional risk.
We ran a test race with just five horses, based on the SuperRatings Option Type classifications, and here are the results:
| Horse |
Place |
Risk-adjusted Return* |
Actual return* |
Market risk* |
| Balanced (60-76) |
1 |
1.60 |
8.80 |
4.14 |
| High Growth (91-100) |
2 |
1.30 |
9.25 |
5.59 |
| Conservative Balanced (41-59) |
3 |
1.19 |
6.58 |
2.90 |
| Growth (77-90) |
4 |
1.13 |
9.68 |
5.30 |
| Capital Stable (20-40) |
5 |
1.05 |
4.81 |
2.16 |
Risk-adjusted Return: Sharpe ratio
Actual Return: 3-year rolling net return % per annum
Market Risk: 3-year rolling Standard Deviation % per annum
On this basis, ‘Balanced’ was the horse to be on. ‘High Growth’ can run faster, but the risk trade-off is too high (on this metric) to justify the extra speed.
What is ‘Conservative Balanced’ doing in third place? It’s the second slowest horse in the race, but it gives its jockey a smooth enough ride to offset the performance difference. This seemingly anomalous result reflects the current investment environment, with very low risk-free rates of return. This option was able to achieve a higher excess over the risk-free rate per unit risk than any of the other options bar Balanced and High Growth.
Is Risk-adjusted Return (RAR) then a sensible metric for comparing different investment strategies? One major weakness is that RAR takes no account of an individual member’s risk characteristics and assumes that the risk / return trade-off is the same for all members. Clearly this is not the case – younger members are less likely to be impacted by short-term fluctuations in market asset values, whereas members approaching retirement can be affected by sharp declines in market value immediately prior to retirement (‘sequencing risk’). In the context of the table above, a member approaching retirement might value the stability offered by ‘Conservative Balanced’ enough to accept the lower return, whereas a younger member would (should!) be unhappy about the underperformance, given that market risk is not really an issue.
This suggests that a ‘weight-for-age’ handicapping system would make more sense for MySuper performance comparisons. In fact, many fund trustees have already put this into practice via a ‘Lifecycle’ strategy, whereby each member’s risk exposure varies with age, becoming more conservative as retirement is approached. However, it is difficult to see much standardisation occurring in this area, given that there is not even consensus within the industry regarding the value of the Lifecycle approach, let alone the appropriate risk exposure for each age.
Despite these limitations, there is one group of members where there is broad general agreement across the industry. Our analysis was based on MySuper default options – by definition, the investment strategy that will apply to superannuation fund members who do not make an active investment choice – generally those members who are less ‘engaged’, and typically the younger members for whom retirement is in the distant future, and accumulated super is relatively small. As already indicated, market risk should be less of a concern for this group (although managing expectations after a share market crash can still be a challenge for fund communication strategies).
This graph shows 3-year rolling returns versus risk (standard deviation over 3 years) for all SuperRatings Balanced (60-76) options. The highlighted options are the Top 10 by Risk-adjusted return (Sharpe Ratio). These are the options that performed the best for a given level of risk over the 3-year period to 30 June 2019.
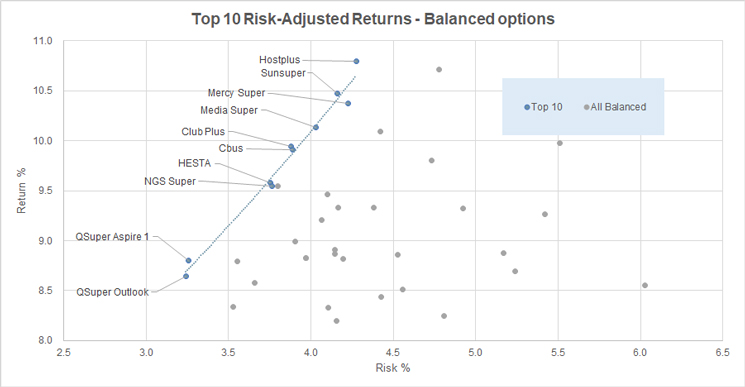
Risk-Adjusted Returns therefore have some value in highlighting the best performers for a chosen level of risk, but even within the constraint of just Balanced options, there is a wide range of risk experience.
The SIS Act and Regulations require that trustees must formulate an investment strategy taking into account at least ‘the membership profile (for example, members’ age and expectations, occupational profile …)’. The investment strategy decision is likely to be a bigger determinant of performance outcomes than the fund’s ability to manage assets. Thus we have the current situation where the trustee of one fund can decide that the appropriate default level of risk for a 50-year-old is a Balanced option, while the trustee of another fund can quite legitimately decide that a Capital Stable option has the appropriate level of risk. There is potential here for uninformed commentators to label a fund as a ‘dud’ or underperformer simply on the basis of ‘first past the post’ outcomes, when the underlying reality is that the trustee is managing efficiently to its stated investment strategy.
Einstein is reputed to have said ‘Everything should be made as simple as possible, but no simpler’. In the world of superannuation investment performance measurement, there may be no black and white answers, and we will have to wait and see before we place any bets on future performance measurement systems.

