The listed income universe has not been immune to the recent market volatility that has engulfed global financial markets since the outbreak of the COVID-19 pandemic. Listed income securities covered by Lonsec have fallen 19% since early February 2020, giving investors very few places to hide. As the current market has made all too clear, hybrids are no guarantee of safety during a heavy market sell-off.
The price effect has been most severe for longer duration securities: those with more than five years to call have fallen around 25%, compared to 14% for those with less than two years to call.
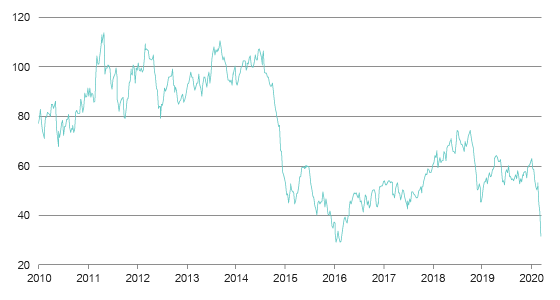
Average price fall in Lonsec’s listed income universe
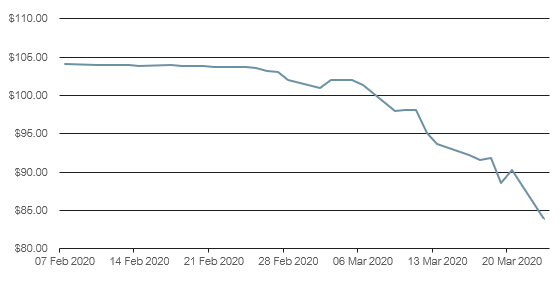
Source: Lonsec, Refinitiv
There have been three main drivers of this sharp fall in prices: the global rise in spreads, a lack of liquidity, and elevated risk of balance sheet stress for issuers.
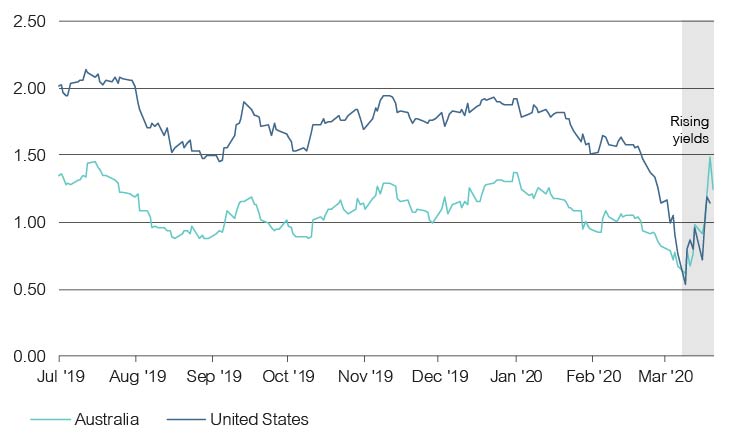
The credit spreads of Listed Income securities have jumped since the pandemic was declared. As an example, looking at major bank AT1 securities with approximately five years to maturity, the average credit spread has widened from 275 bps to 783 bps.
This widening of credit spreads has not been confined to the Australian Listed Income market. The option-adjusted spreads of US Investment Grade and High Yield spreads, for instance, have jumped 334 bps and 652 bps respectively. The lift in credit spreads more broadly highlights the risk-off nature of the current market, with cash seen as the asset of choice and investors also concerned about rising default rates.
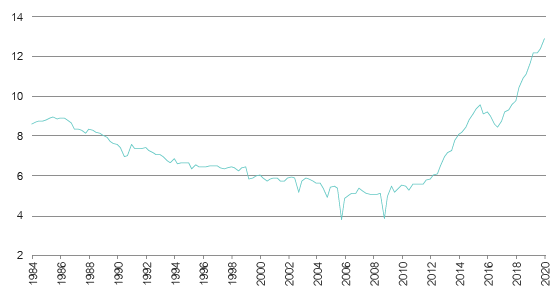
Hybrid trading margin versus Bank Bill Swap Rate
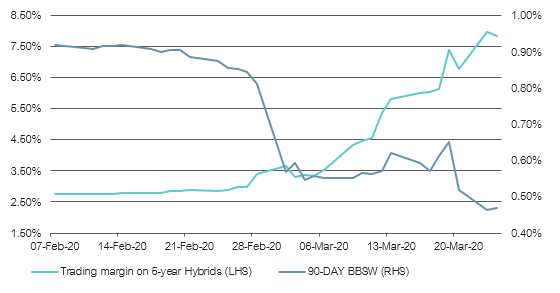
Source: Lonsec, Refinitiv
Further, the lack of liquidity in the secondary market has also exacerbated recent moves, with issue sizes for Listed Income securities ranging from as low as $268 million for AMP Capital Notes (AMPPA) to $3 billion for Commonwealth Bank (CBAPD).
While this may not appear small in comparison to the market capitalisation of some constituents in the ASX 200, the average trading volume is considerably less. For example, the historical weekly average trading volume for CBAPD is $10.3 million, and there are a number of smaller issues with associated poorer liquidity. This has increased to $17.3 million over the low level of turnover compared to the issue size of $3 billion, highlighting the impact of low liquidity on the market price movements of these securities over the short term. This is not unexpected, with investors in the current market seeking a much larger illiquidity premium to buy smaller hybrid issues.
The volatility inherent in the Listed Income universe at the moment is a reminder to investors of the equity-like characteristics of these instruments. When the market sells off, default risk and liquidity risk become more prevalent. It’s another cautionary tale during this period of market stress.
Banks face higher risk, but the probability of forced conversions remains low
Concerns about rising impairments for the big four banks has resulted in sharp share price declines in the sector, with share prices of the big four banks declining by around 36-48% since the start of the pandemic.
Given the perpetual nature of the AT1 securities and potential conversion triggers embedded in the structure of these issues, it is important to revisit the scenarios in which these Basel III compliant AT1 securities could convert into equity.
There are 3 possible scenarios in which conversion could occur:
- A common equity trigger event: Common Equity Tier 1 (CET1) capital is comprised mainly of directly issued qualifying ordinary shares, retained earnings, and accumulated other comprehensive income, which is adjusted based on regulatory requirements. A breach and conversion of listed income securities into common equity occurs when the risk-weighted assets of the issuer are equal to or less than 5.125% of CET1 capital.
- A non-viability event: This occurs when APRA declares the bank non-viable or considers that the bank would become non-viable without a public sector injection of capital.
- Mandatory conversion: If the securities are not redeemed at the first call date, they are left on the market for two additional years
It’s important to note that in the event of a conversion, holders will receive approximately $100 worth of ordinary shares per security, unless the issuer’s underlying shares price falls below a certain pre-determined level at which point a capital loss is likely to be incurred upon conversion. The price level is usually set at 20% of the issue date VWAP for each security.
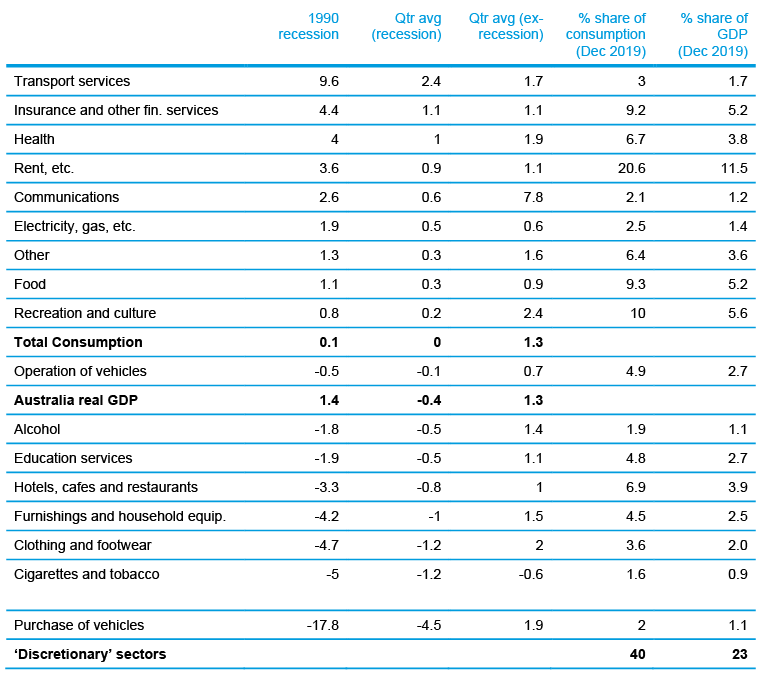
The below table outlines the current CET1 capital levels of the major banks and the capital buffer above the conversion condition. Thanks to APRA’s “unquestionably strong” CET1 requirement of 10.5%, Australian banks are well capitalised and would need to experience a significant rise in bad debts before a conversion trigger is enforced. As at 31 December 2019, the major banks had reported capital buffers in the range of $22-30 billion in excess of the minimum capital requirements.
| Regulatory Capital | ANZ | CBA | NAB | WBC |
| Common Equity Tier 1 (bn) | 46.4 | 52.4 | 44 | 47.8 |
| CET1 ratio | 10.9% | 11.7% | 10.6% | 10.8% |
| Common Equity Trigger buffer (bn) | 24.6 | 29.4 | 22.7 | 25.1 |
Source: Company data. As at 31 December 2019
The volatility inherent in the listed income universe at the moment is a reminder to investors of the equity-like characteristics of these instruments. While the current volatility in security prices would be unsettling to investors, Lonsec believes that the risk of forced conversions into equity remains a very low probability event for the AT1 securities issued by the major banks. Lonsec continues to recommend a ‘hold-to-maturity’ approach for these securities. However, we also urge investors not to allocate to hybrid securities as part of their defensive bucket in their asset allocations.