Trump’s bombastic and provocative approach to the trade war has culminated in a tumultuous two years for capital markets. Sudden increases in tariffs have been followed by back downs, bravado has given way to overtures, and severe selloffs have been succeeded by relief rallies. However, it has been this ongoing uncertainty which Trump’s political success hinges on as his negotiating style has leveraged the following maxim: escalate and then negotiate.
While the negotiation of a ‘phase one’ deal represents a considerable win for Trump, the unavoidable reality is that the trade war has been costly, and the economic toll continues to mount. It’s unclear whether the proposals outlined in the phase one agreement will cover this cost, particularly given the difficulty involved in calculating the indirect effects of US tariffs and China’s retaliatory measures, which have contributed to waning business investment and consumption.
The remaining tariffs and commitments to purchase additional agricultural products should appease the China hawks, but the currency pledges are similar to those already agreed to under the G20 pact. Further, the commitments pertaining to intellectual property theft and forced technology transfers appear similar to China’s obligations under their foreign investment regime implemented last year.
As always, the devil is in the detail. Trump will be under mounting pressure to deliver more meaningful results in the subsequent phase two negotiations, due to take place after the presidential election in November 2020. For the last two years, global markets have delicately traversed thorny trade issues, and with markets now topping record highs, any negative news is likely to significantly depress global share indices.
Looking at recent drawdowns, which can be used as a barometer for the aggression demonstrated by each side, it’s clear that the pullback in early 2018 represents the initial flare-up between the two powers as the tariff regimes commence and the Twittersphere works itself into a frenzy.
While mild acts of hostility pervaded 2018, it wasn’t until the fourth quarter when both countries imposed a plethora of tariffs in concert with the US Fed’s attempts to normalise monetary policy and deploy quantitative tightening. This incited a severe wave of panic selling in conjunction with the aptly-named ‘bond-cano’. The final noteworthy drawdown is evident in mid-2019, when the ceasefire abruptly ended once again in response to China purportedly reneging on past trade commitments, launching global indices into freefall.
S&P 500 TR Index drawdowns, January 2018 to December 2019
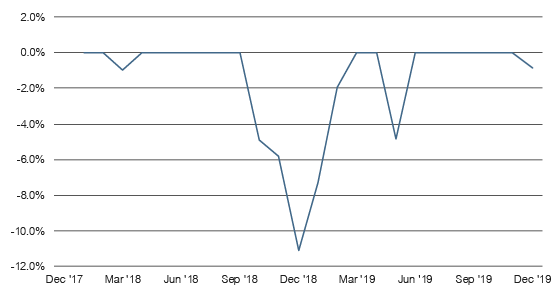
Source: Financial Express, iRate
Trump has frequently cited the S&P 500 as a proxy for the success of his presidency, and notwithstanding the turbulence experienced in 2018, this has proved to be one of his defining accolades. Since the end of 2016, the market’s cumulative return has edged close to 60%, providing a boon to passive investment strategies.
“If the Dems (Crooked Hillary) got elected, your stocks would be down 50%” – @RealDonaldTrump
The cynics will argue that Trump opportunistically deployed tariffs to stymie economic growth and force the ‘Powell-Put’ in early 2019 in order to reignite a languishing stock market. Consequently, this about face from Powell to a more accommodative monetary policy stance precipitated a significant reversal for risk assets, powered global stock indices to new highs, and set Trump’s twitter feed ablaze.
S&P 500 TR Index cumulative returns, January 2017 to December 2019
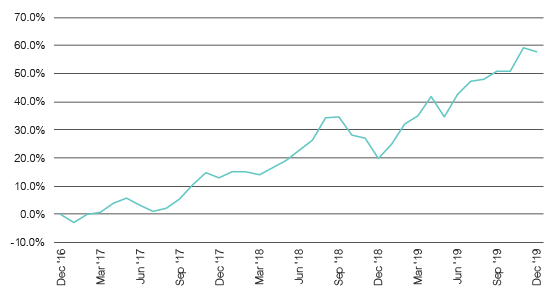
Source: Financial Express, iRate
“My only question is, who is our bigger enemy, Jay Powel or Chairman Xi?” – @RealDonaldTrump
Trump’s detractors assert that his tariff regime was part of a cunning ploy to pressure the US Federal Reserve to aggressively ease monetary policy to counter flagging economic growth. Unfortunately for the bystanders, the trade war spurred a synchronised global slowdown and left the global economy on the precipice of a recession. Auspiciously for Trump, the Fed eventually embarked on an easing cycle, which aside from producing the ‘Trump bump’ in the stock market, sparked an insatiable thirst for fixed income securities.
US 10-yr Treasury Yield Rolling Returns (%) – Jan 2018 to Present
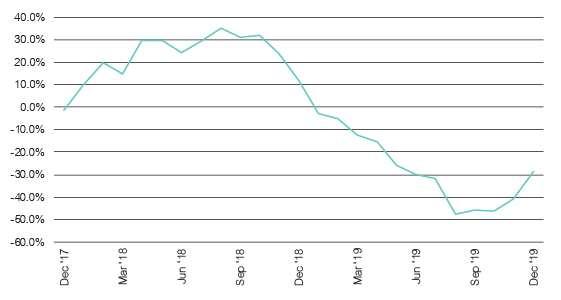
Source: Financial Express, iRate
“The Fake News Media barely mention the fact that the stock market just hit another new record” – @RealDonaldTrump
Trade is still the market’s biggest unknown
The genesis of the sino-yankee trade dispute lies with America’s historical trade deficit with China, the alleged theft of intellectual property, and manipulation of the Chinese Yuan. Despite how polarised American politics is, across the political divide there is widespread support for tariffs to reduce the domestic trade deficit and protect domestic industries. China’s admission into the World Trade Organisation (WTO) and ascent to a global trading powerhouse is seen to come at the cost of American manufacturing jobs and resulted in the hollowing out of the middle-class in the rustbelt of America, which is where much of Trump’s support comes from.
Moreover, the US ban on technology produced by the Chinese technology behemoth, Huawei, played into the theme of suppressing Chinese ingenuity. Importantly, a concerted effort has been made to insulate the American consumer from the brunt of the tariff regime as best as possible through primarily targeting industrial goods rather than consumer items. However, conflicting evidence suggests that US businesses and consumers have equally borne the financial brunt of the tariff regime through inflated end-prices.
“China has been ripping this country off for 25 years” – @RealDonaldTrump
China’s retaliatory measures have been predictable and were designed to inflict as much carnage as possible on the US agricultural, chemical and automobile sectors at the heart of Trump’s support base. These targeted measures intentionally weaken the economic interests of Trump’s forgotten class of export-dependent workers, whose grievances he leveraged in the 2016 election following decades of automation and globalisation.
The political objective is to compromise Trump’s re-election prospects in 2020 and force his arm into offering more amicable concessions. Reinforcing this effort is the fact that US exports to China are largely undifferentiated commodities that can be substituted elsewhere. However, Trump’s adversarial negotiating style led Chinese President Xi into a war of attrition, leaving both sides unrelenting in their demands up until the recent phase one agreement.
Unfortunately, this is not the end of the trade issue. While the US has achieved a substantial narrowing of the trade deficit from US$419 billion in 2018 to US $320 billion in 2019, the efficacy of weaponising tariffs to enforce compliance from trading partners is murky. The uncertainty pervading the economy has largely dissipated for now, thereby strengthening Trump’s mantra on growth and prosperity for the ‘deplorables’, while the Democrats are distracted by likely meaningless impeachment proceedings.
The trade war remains a live issue even if Trump prefers to leave further negotiations until after the election. After that, a phase two negotiation will test the US administration and the markets unlike anything we saw in 2019, which spells further volatility for markets. Is Trump playing a dangerous game or does he have 2020 vision?
“Trade wars are good, and easy to win” – @RealDonaldTrump