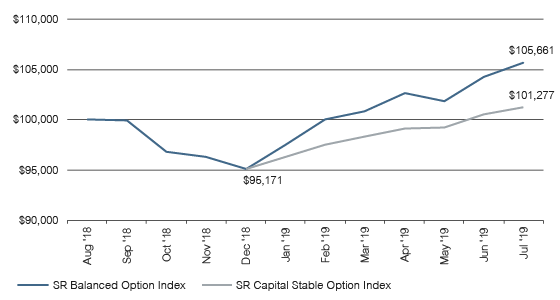
Super funds have had a convincing finish to what was a bumpy 2019 financial year, with an improvement in sentiment and a rallying share market in June helping funds over the line with solid returns.
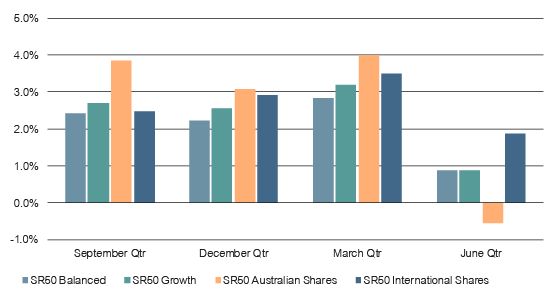
A promising 2.0% gain in the September 2018 quarter seemed to vanish before members’ eyes as funds suffered a 4.7% loss in the December quarter. Funds fought back strongly in the final six months, helped by a solid performance in June, bringing the FY19 result to 6.9%.
According to SuperRatings’ data, the median balanced option returned 2.3% in June, driven predominately by a rebound in Australian and international share markets. By comparison, the top 10 funds achieved an average return of 8.5% for the year. The return for the median growth option, with two thirds of the portfolio allocated to local and international shares, was 7.4% over the year, while the median capital stable option returned 5.3%.
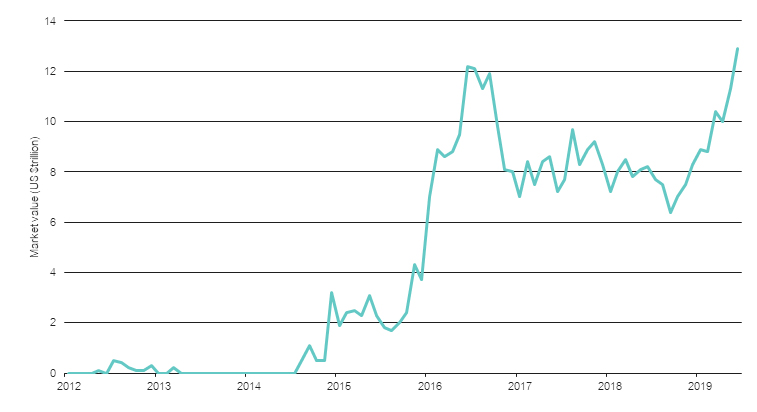
While funds have ridden the wave of market fluctuations since the Global Financial Crisis, the FY19 financial year has nevertheless proved a fitting bookend to super performance over the past decade, during which the superannuation system has amassed an additional $1.3 trillion for members.
Median balanced option financial year returns since introduction
of compulsory SG
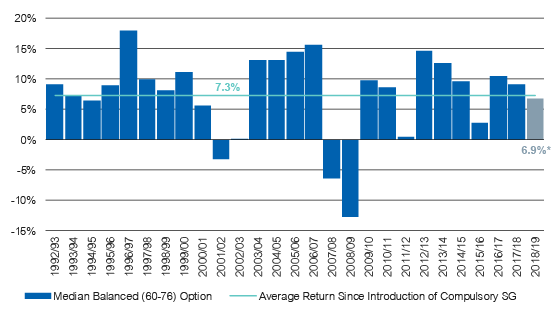
* Interim return
Source: SuperRatings
Australia’s leading super funds in 2018-19
UniSuper was the highest returning balanced option over the 12 months to 30 June 2019, delivering a 9.9% gain to members. This was followed by QSuper and Media Super, which returned 9.7% and 8.8% respectively. Both UniSuper and QSuper are among the top returning funds over 10 years, narrowly trailing AustralianSuper, which remains on top of the long-term leader board with a return of 9.8% p.a.
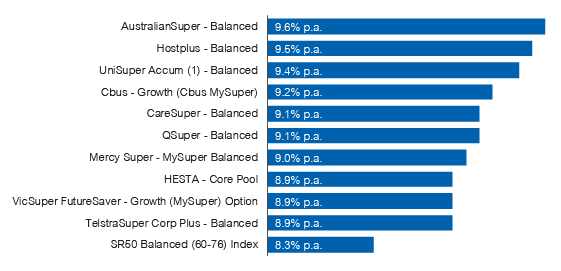
Top 10 returning super funds over 1 year
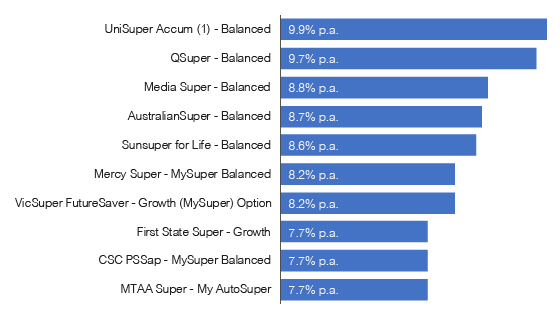
Source: SuperRatings
Top 10 returning super funds over 10 years
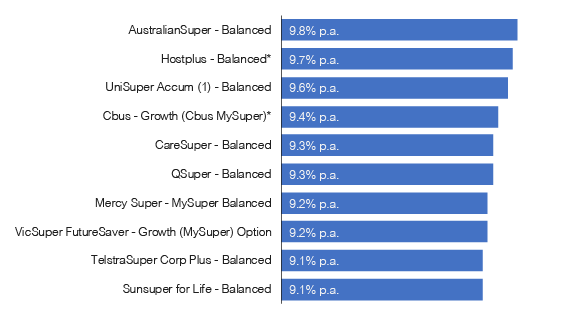
Source: SuperRatings
“UniSuper was a standout performer for the 2019 financial year, and they have also delivered consistently strong outcomes for their members over the past 10 years,” said SuperRatings Executive Director Kirby Rappell. “While year-to-year performance can fluctuate, the ability of the fund to provide solid returns over the long term, while protecting their members’ savings against the ups and downs of the market has been key to their success.”
While superannuation continues to deliver for members, SuperRatings warned that the system could become a victim of its own success, as higher account balances mean members will feel more of the bumps as markets move.
“The 4.7% drop we saw in the December quarter was felt more acutely for someone with a $100,000 balance than one with only $10,000,” said Mr Rappell. “Members should enjoy the strength of returns we’ve seen over the past decade, but as more and more workers enter and exit the system, it’s important that we keep talking about how funds manage market pullbacks and other risks for their members. The uncertainty that many consumers and investors feel at the moment reminds us that super is a long-term game, and members must have an understanding of both risk and return, and the effect they have on their retirement savings.”
High returns are not a free lunch – consumers should understand risk
Most consumers can’t define risk, but they know it when they experience it. For superannuation members, risk can mean the likelihood of running out of money in retirement, or not having enough cash to pay for holidays, car repairs, or an inheritance for their kids.
For a young worker with a relatively low super balance, being exposed to riskier assets is less of a problem – in fact, it can help them accumulate wealth over their working life. However, for members approaching retirement (aged 50 and over), an unexpected pullback in the market can mean the difference between living comfortably and having to cut back in order to get by.
While measuring risk can be tricky, it’s essential to understanding the value that members are getting from their fund. The conversation around risk will become increasingly important as a greater number of people begin transitioning to retirement and drawing down on their super.
Risk can be measured as the degree to which returns fluctuate over time. Members want high returns, but they also want consistent returns. Unfortunately, higher returns often mean taking on more risk, which means returns will be less consistent. The table below shows the top 10 funds ranked according to their risk-adjusted return, which measures how much members are being rewarded for taking on risk.
Top 10 funds ranked by risk and return (over 7 years)
| Fund |
Risk/return ranking1 |
Return % p.a. |
| QSuper – Balanced |
1 |
9.5% |
| CareSuper – Balanced |
2 |
10.4% |
| Hostplus – Balanced* |
3 |
11.1% |
| Cbus – Growth (Cbus MySuper)* |
4 |
10.7% |
| BUSSQ Premium Choice – Balanced Growth |
5 |
9.8% |
| Sunsuper for Life – Balanced |
6 |
10.5% |
| Catholic Super – Balanced (MySuper) |
7 |
9.7% |
| CSC PSSap – MySuper Balanced |
8 |
9.4% |
| HESTA – Core Pool |
9 |
9.9% |
| Media Super – Balanced |
10 |
9.9% |
1 Risk/return ranking determined by Sharpe ratio
* Interim return
Source: SuperRatings
QSuper’s return of 9.5% p.a. over the past seven years is slightly below the average of 10.1% across the top 10 ranking funds, but it has the best return to risk ratio of its peers, meaning it delivered the best return given the level of risk involved. Funds such as CareSuper and Hostplus were able to deliver higher returns, but for a slightly higher level of risk.
High returns are not a free lunch – consumers should understand risk
Following the introduction of MySuper, which provides a low-cost, ‘set-and-forget’ alternative for members, we have seen lifecycle strategies become increasingly popular. Members starting their working life in a lifecycle product are given a higher allocation to riskier growth assets like shares, which is gradually shifted over to safer assets as they age.
This allows members to benefit from higher risk and return earlier on in their working life, and having more certainty as they get closer to retirement. Approximately one third of MySuper products have some sort of age-based strategy, and tend to be offered by retail master trusts.
The chart below shows how a lifecycle product’s asset allocation changes as members age. For those starting out in the workforce, the allocation to growth assets like equities is high (around 90% for the median fund) and is reduced over time to around 50% by the time the member reaches the age of 60.
Lifecycle vs Single Default GAA
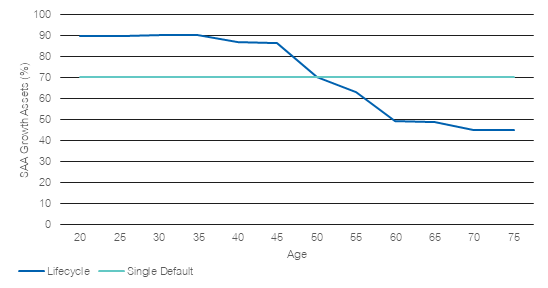
Source: SuperRatings
When assessing the performance of lifecycle products, SuperRatings found there are some retail funds that have improved their position. smartMonday MySuper – Aon MySuper High Growth (11.8% p.a.), ANZ Smart Choice Super – MySuper (10.2% p.a.) and Mercer SmartPath – MySuper (9.9% p.a.) have delivered strong returns over the three years to 30 June 2019 for younger members (in the 1995-1999 cohort), in excess of the not-for-profit median across both single default and lifecycle MySuper products.