India has been a high performing component of the emerging market and Asian indices over the past five years, driven by compelling demographics supporting mass scale consumerism, an improving business policy framework, and an underdeveloped infrastructure sector demanding ramped up investment.
Global developed market equities have generally outperformed emerging markets over the April 2008 to April 2018 period, but the more recent one year and three-year returns have favoured Asian, Chinese and Indian equities. Chinese investors have enjoyed a strong year, driven by economic stability and reduced concerns about debt imbalance. Indian equities have had an interesting journey. The chart and table below show the performance returns from various country and regional indices over the last 10 years.
Global indices performance (2008-2018)
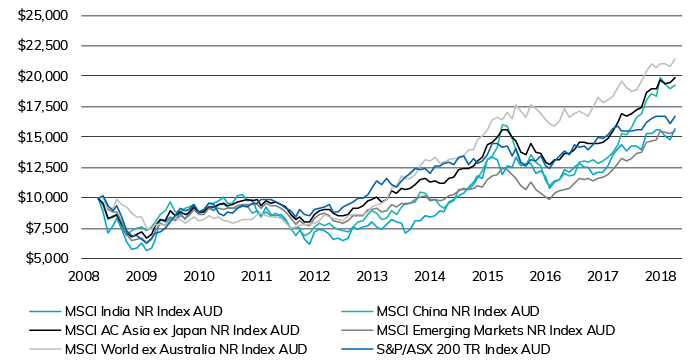
Source: MSCI, Lonsec
Indian equities sold off heavily in the GFC then rallied alongside most risk assets through 2009 before enduring a two-year downward trajectory on concerns about economic stability and ‘Fragile Five’ labelling. That is, in a period where global investment sentiment was weak, India was viewed as being overly dependent on foreign capital to finance its economic growth. With capital flows retreating from India, the currency softened and equities weakened. All changed in early 2014 with the election of Modi’s BJP and the pro-business agenda proving a watershed moment in India’s history and kick-starting a four-year rally.
Performance of global equity indices for periods ending 30 April 2018 (% p.a.)
| 6 months | 1 year | 3 years | 5 years | 10 years | |
|---|---|---|---|---|---|
| MSCI India NR Index AUD | 2.48 | 11.55 | 9.68 | 14.95 | 4.59 |
| MSCI China NR Index AUD | 7.02 | 34.02 | 6.51 | 18.38 | 6.80 |
| MSCI AC Asia Ex Japan NR Index AUD | 6.43 | 22.86 | 8.53 | 15.08 | 7.12 |
| MSCI Emerging Markets NR Index AUD | 6.45 | 20.58 | 7.56 | 11.63 | 4.46 |
| MSCI World Ex Australia NR Index AUD | 5.08 | 12.40 | 9.24 | 16.78 | 7.92 |
| S&P/ASX 200 Index AUD | 3.37 | 5.46 | 7.53 | 7.53 | 5.29 |
Source: MSCI, Lonsec
India’s deep market
According to the Securities and Exchange Board of India (SEBI) there are 14 stock exchanges approved by SEBI for operation in India. The two major exchanges are the Bombay Stock Exchange (BSE) and National Stock Exchange (NSE) with all listed companies in India listed on either the BSE or NSE or both. The NSE was formed by the Government in 1994 and operates the Nifty 50 index (the market cap of the leading 50 companies across various sectors). The BSE is Asia’s oldest stock exchange and was established in 1875.
The market for listed companies in India is deep with over 5,000 companies listed on the BSE and around 2,000 on the NSE. This makes India the largest equity market globally. The MSCI India index in AUD is the standard reference benchmark for Indian equities performance. It holds 79 stocks as at April 2018 and covers approximately 85% of the Indian equity universe. It is skewed towards the largest companies in India (80%) but holds a modest mid cap exposure (20%). The top 10 stocks dominate the benchmark and comprise nearly 50% of the Index and is populated by familiar names such as HDFC, Reliance Industries, Infosys and Tata Consultancy (TCS).
In terms of sectors, the Index is dominated by Financials (24%), Information Technology (16%), Energy (13%), and Consumer Discretionary (12%). The below chart compares the sector composition today with five years ago and shows similar composition with a modest rise in consumer discretionary, health care and material stocks at the expense of a lower financials weight.
MSCI India sector composition 2013 and 2018 (sector average weight)
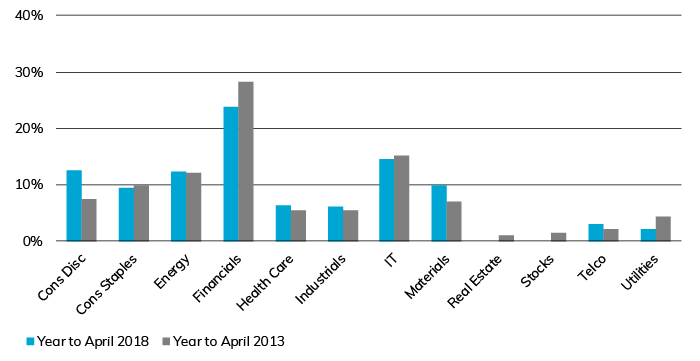
Source: MSCI, Lonsec
The chart below compares the total return of each sector over the same period. Alongside consumer staples, healthcare stocks were a major driver of performance in 2013. Fast forward to today and healthcare was a drag on performance over the past year with concerns about the global competition forces impacting on India’s leading pharmaceutical stocks like Sun Pharmaceuticals and Dr Reddy’s Laboratories. IT stocks were the biggest contributor to benchmark performance in 2018 with names like TCS and Infosys benefiting from strong global demand for their services.
MSCI India sector performance 2013 and 2018 (sector total return)
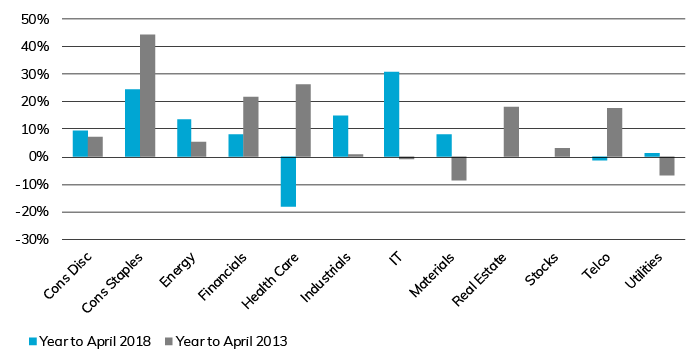
Source: MSCI, Lonsec
The below chart compares the sector contribution to total market return by sector over the same periods and shows that information technology companies contributed nearly 40% of the return in 2018 while financials drove the benchmark in 2013 attributable to close to 50% of the benchmark return.
MSCI India sector performance 2013 and 2018 (% contribution to total market return)
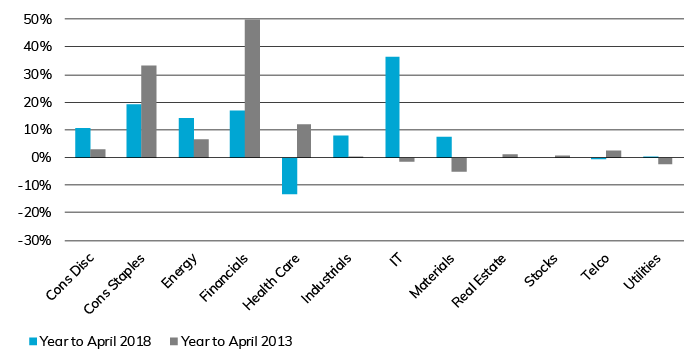
Source: MSCI, Lonsec
The Indian equity market has displayed a remarkable degree of dynamism, and Lonsec believes there are long-term opportunities available for investors looking for emerging market exposure. Investors have an array of choice between active and passive investment when considering investing in India. This post forms part of a broader article on access to Indian market exposure and strategies. To read the full article, log on to iRate or contact our client services team.
IMPORTANT NOTICE: This document is published by Lonsec Research Pty Ltd ABN 11 151 658 561, AFSL 421 445 (Lonsec).
Please read the following before making any investment decision about any financial product mentioned in this document.
Warnings: Lonsec reserves the right to withdraw this document at any time and assumes no obligation to update this document after the date of publication. Past performance is not a reliable indicator of future performance. Any express or implied recommendation, rating, or advice presented in this document is a “class service” (as defined in the Financial Advisers Act 2008 (NZ)) or limited to “general advice” (as defined in the Corporations Act (C’th)) and based solely on consideration of data or the investment merits of the financial product(s) alone, without taking into account the investment objectives, financial situation and particular needs (“financial circumstances”) of any particular person.
Warnings and Disclosure in relation to particular products: If our general advice relates to the acquisition or possible acquisition or disposal or possible disposal of particular classes of assets or financial product(s), before making any decision the reader should obtain and consider more information, including the Investment Statement or Product Disclosure Statement and, where relevant, refer to Lonsec’s full research report for each financial product, including the disclosure notice. The reader must also consider whether it is personally appropriate in light of his or her financial circumstances or should seek further advice on its appropriateness. It is not a “personalised service” (as defined in the Financial Advisers Act 2008 (NZ)) and does not constitute a recommendation to purchase, hold, redeem or sell any financial product(s), and the reader should seek independent financial advice before investing in any financial product. Lonsec may receive a fee from Fund Manager or Product Issuer (s) for reviewing and rating individual financial product(s), using comprehensive and objective criteria. Lonsec may also receive fees from the Fund Manager or Financial Product Issuer (s) for subscribing to investment research content and services provided by Lonsec.
Disclaimer: This document is for the exclusive use of the person to whom it is provided by Lonsec and must not be used or relied upon by any other person. No representation, warranty or undertaking is given or made in relation to the accuracy or completeness of the information presented in this document, which is drawn from public information not verified by Lonsec. Conclusions, ratings and advice are reasonably held at the time of completion but subject to change without notice. Lonsec assumes no obligation to update this document following publication. Except for any liability which cannot be excluded, Lonsec, its directors, officers, employees and agents disclaim all liability for any error, inaccuracy, misstatement or omission, or any loss suffered through relying on the information.
Copyright © 2018 Lonsec Research Pty Ltd, ABN 11 151 658 561 AFSL 421 445. All rights reserved. Read our Privacy Policy here.