
Many sharemarkets around the world have been pushed to records highs over the past 5 years, helped by a range of tailwinds. In this article, Anton and Hugh look at a range of factors that have helped lift global sharemarkets in the last 5 to 10 years, and what the outlook may be for the next 5 years.
March 2019 will mark 10 years since the sharemarket recovery started, following the lows of the Global Financial Crisis (GFC). From March 2009 to the end of August 2018 the US S&P500 has returned a cumulative +393%, the MSCI World Index +282% and the ASX300 Accumulation Index +201%. It is also interesting to note that these returns, specifically over the last 5 years, were generated against a backdrop of record low levels of volatility.
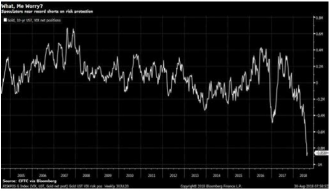
With many global sharemarkets now hitting record highs on a daily basis, it appears that many investors remain complacent and optimistic that the next 5 years can continue along the same lines as the last 5 years. This complacency is best demonstrated in chart 1 below which shows that there is currently a record number of speculative positions in the futures markets of the VIX and the traditional safe havens of Gold and US 10-year Treasuries. The recent
trajectory of this chart clearly demonstrates that current complacency amongst investors is at multi year highs despite the very strong rerating of stockmarkets over the last few years.
While it is nearly impossible to pick tops or bottoms in sharemarkets, with many global sharemarkets now at record highs, we believe it is prudent for investors to now ask the question: will the economic and liquidity conditions of the last
5 years continue for the next 5 years? In this paper we discuss 5 key areas which we believe are worth considering given the continued buoyancy and apparent complacency of many sections of the sharemarket.
1. The end of quantitative easing (QE) as Central Banks reign in the money supply
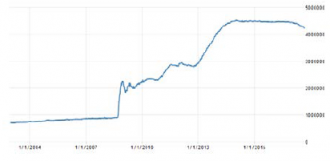
As financial markets teetered on the brink of collapse in 2008 and 2009, the US Federal Reserve responded with one of the largest and most unconventional forms of monetary policy. The Federal Reserve not only cut its key interest rate (the Fed Funds Rate) to virtually zero percent but the Fed also announced the buying of trillions of dollars in US denominated debt to flush the system with liquidity. By doing so the Fed significantly increased the supply of money to help stimulate economic activity. Quantitative easing quintupled the size of the Fed’s balance sheet to $4.4 trillion dollars and helped drive the 10-year bond yield from above 5% to 1.5%. Following the Fed’s lead, other major Central Banks around the world – such as the ECB, Bank of England and Bank of Japan – also followed suit with their own forms of unconventional monetary policy. The numbers across the globe are quite staggering: in total over US$12 trillion of new money supply was injected using quantitative easing which at one stage resulted in US$10 trillion of negative yielding global bonds, 654 interest rate cuts globally in aggregate since September 2008 and a period with the lowest interest rates on record around the globe. The chart below highlights the ballooning size of the US Fed’s balance sheet – with the normalisation process now in its nascent days as the unwind begins.
Chart 2: United States – All Federal Reserve Banks: Total Assets under increasing pressure – not small economies by any measure.
There is no doubt that QE and the record low interest rates of the last decade have assisted greatly in stabilising financial markets and saving the world from financial calamity – but they have also had the effect of significantly stimulating asset prices around the world, given the money that has been pumped into the system. This has helped to drive global equity markets to record highs. For companies, particularly in the US, share buybacks became increasingly attractive during this period, with the cost of debt moving significantly below the cost of equity, further supporting stock market returns.
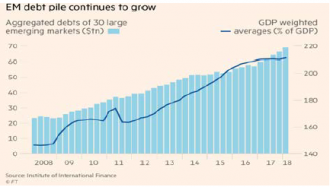
This untested approach to monetary policy is now leading us to the current juncture – Quantitative Tightening (QT). The Fed, ECB and Bank of England have all expressed their desire to normalise monetary policy. The Fed has already ceased its quantitative easing programme and has increased US interest rates 7 times from 0.25 % to 2.0% in the last 18 months. The Bank of England has started increasing UK interest rates (albeit slowly) and the ECB is signalling an end to its quantitative easing programme some time in 2019. The Emerging Markets conundrum According to the Institute of International Finance, US$40 trillion was added to the debts of emerging market economies over the past decade. This debt has helped fund the growth in many of these economies. For many emerging countries, much of their debt is denominated in the US Dollar. As the US normalises its interest rates, the US dollar has pushed higher, leaving many emerging economies vulnerable to increasing US dollar debt obligations. Indeed, this year we have seen Turkey, Argentina, Brazil, South Africa, Mexico and Russia all come under increasing pressure – not small economies by any measure.
Chart 3: The emerging markets debt pile
We acknowledge that while Central Banks are mindful of disrupting the system after 10 years of growth, there is no doubt that the normalisation of interest rates and the reversal of quantitative easing is a significant change to what has occurred over the last 5-10 years. While the exact impact of these changes is difficult to forecast, we are surprised that it has not yet led to greater uncertainty in financial markets, as this change of policy may lead to some of the current imbalances in the global financial system being exposed.
2. The US economic expansion and low unemployment – is there further upside?
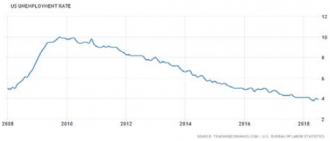
At a time when global economic growth, particularly in the US, continues apace, the passing of President Trump’s tax cuts comes at a time when the US economy appears in no need of further stimulus. From a high of over 10% in 2009, US
unemployment has reduced significantly so that it now sits at an 18 year low of 3.9%, as highlighted in chart 4. Remarkably, this record low unemployment has so far been achieved with little impact on inflation.
Chart 4: US unemployment levels close to two-decade lows
With the US consumer sector being such a large sector, equity markets have benefited greatly from the US led economic expansion and its declining trend of unemployment.
Continued robust growth and an extension of the business cycle may continue in the short to medium term. However, with the elevated base from which US growth must now be achieved it is hard to foresee the same rate of expansion
continuing over the next 5 years.
3. Australian housing – peak prices with a definite softening moving forward
The Australian housing sector has been a significant beneficiary of the current cycle as the combination of record low interest rates, readily available credit and strong population growth all played a hand in fuelling house prices to record levels. This significant price appreciation and commensurate increase in owner equity has had a large ‘wealth effect’ on Australian consumers and allowed many of them to continue to spend at a time of subdued wages growth.
The result of all this is that Australian household debt to GDP ratios are now amongst the highest in the developed world as evidenced in Chart 5. The strength of the housing market has helped directly support many areas of the economy such as construction and home improvement activity, while its positive impact on consumer sentiment has also indirectly helped sectors such as retail sales.
Chart 5: Australian household debt to GDP – significant elevation over the last 4 years
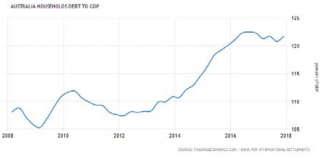
It seems fairly clear, for a variety of reasons such as record debt levels and the banks beginning to tighten their credit standards that in the next 5 years we will not see anything like the 40-50% cumulative house price appreciation of the past 5 years.
As global interest rates creep higher, the wholesale funding costs for Australia’s banks is rising which will need to be offset with higher mortgage rates. We have already seen the start of this with Westpac and Suncorp’s recent rate rises. With many Australian households already heavily indebted, higher interest rates will strain mortgage repayments and eat into disposable income, which may lead to lower property prices and higher defaults. The Banks’ lending books are also beginning to reflect the shift from promotional interest-only loans to principal and interest, which will lead to higher monthly mortgage repayments for many consumers.
The main point is to emphasise that many of the benefits to many sectors of the Australian economy that have resulted from the strength in Australian housing are unlikely to be repeated over
the next 5 years.
4. Chinese growth and fiscal stimulus – how long can it continue?
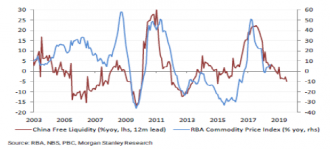
The Australian economy has benefited immensely from the industrialisation and urbanisation of modern day China with the strength of the Chinese economy over the last 5-10 years, and is one of the major reasons why Australia managed to avoid a recession through the GFC, in contrast to many other parts of the world.The Resource sector and our economy’s dependency on the Chinese economy was best displayed when in late 2015 and early 2016 commodity prices dropped sharply on concerns of oversupply and diminishing demand from China.
The Australian Resources sector fell approximately 35% in three months with many of Australia’s more leveraged companies in the sector facing the risk of bankruptcy. Thankfully for Australia, China embarked on a major round of both monetary and fiscal stimulus, and this helped commodity prices and Resource companies’ share prices recover from those sharp losses.
Chart 6: Commodity prices have become increasingly dependent on China stimulus
The Chinese economy remains difficult to forecast moving forward as their Government regularly intervenes to try and keep the economy growing steadily. However, as chart 7 below highlights, fixed asset investment (FAI) in China – a major driver of past growth – is falling at a considerable pace as the country matures and transitions into a more consumption driven economy. China appears vulnerable on many fronts – its debt pile stands at 300% of GDP, up from 171% at the end of 2008. While the trade war with the US will likely be resolved at some stage, the recent 20% drop in the Chinese domestic stock market and the plunge in the Yuan highlights the potential vulnerability of the Chinese economy and its reliance on global trade.
Chart 7: China Fixed Asset Investment continues to decline as their economy matures
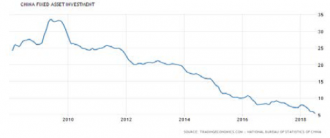
China has accounted for a large portion of global economic growth over the past 5-10 years. As the Chinese economy matures and transitions into a consumption led economy, it is likely that the large tailwinds from China that helped the Australian economy grow may become less visible in the years ahead.
5. PE multiple expansion – can we go much higher?
With many global equity markets having risen sharply in the last few years, PE multiples are sitting well above their long-term averages. Whilst low interest rates can justify higher PE multiples, the rapid PE expansion over the last 5 years makes us cautious moving forward.
Chart 8: The growing divergence between the ASX 200’s PE multiples and EPS levels
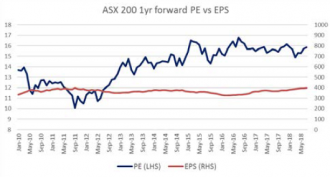
Easy monetary policy and lower interest rates, economic expansion and China stimulus have been central to the performance of global equity markets. Elevated PE multiples reflect a confidence that current conditions can be extrapolated into the future, despite most companies’ earnings growth remaining relatively muted.
Concluding remarks:
While this is by no means a comprehensive list of the conditions that have helped lift global sharemarkets in the last 5 to 10 years, in our view it is indicative of the key issues which have helped lift investor confidence to very buoyant levels and the fair degree of complacency that has now set in. It appears to us that many the tailwinds of the past 5 years that have helped push many stockmarkets to record highs are now fading and in our view, it is a time to be very cautious when investing in the stockmarket.
IML remains disciplined and prudently positioned in our portfolios for any correction in equity markets. We continue to use any weakness to buy into good quality industrials trading at attractive valuations that we believe are well positioned in what seems to be an uncertain 3-5 years and whose earnings we believe will prove resilient through the cycle.
In our view, there are currently many signs of complacency in sharemarkets given the tailwinds that have buoyed the global economy over the past 5 to 10 years. As these tailwinds fade, it is more important than ever to invest prudently. We continue to believe that a research driven fundamental, bottom up approach to stock picking with a strong bias to quality and value remains best suited to the current environment, especially as we transition into what appears to be a fairly uncertain 5 years ahead.
Disclaimer
While the information contained in this article has been prepared with all reasonable care, Investors Mutual Limited (AFSL 229988) accepts no responsibility or liability for any errors, omissions or misstatements however caused. This information is not personal advice. This advice is general in nature and has been prepared without taking account of your objectives, financial situation or needs. The fact that shares in a particular company may have been mentioned should not be interpreted as a recommendation to buy, sell or hold that stock.