Watch the webinar recording.

Synopsis

Super funds are on track to stage a remarkable comeback in the second half of 2020. But there are still a host of challenges facing funds, including early access, market volatility, insurance claims, and ongoing regulatory uncertainty.

Join Kirby Rappell, Executive Director of SuperRatings, as we examine how funds are positioned to manage these challenges through 2020 and beyond.

Key takeaways:

• Get insight into trends across fees, insurance, asset allocation, and member servicing, based on the most in-depth bench-marking data available.
• Assess the major market themes affecting super fund portfolios through the 2020 pandemic and how trustees are responding.
• Learn how consolidation is impacting the super industry and what funds need to do to keep their offering competitive.
• Understand the key tests of tomorrow for super funds and how advisers can assess and compare super fund offerings to meet their best interest duty.


Any advice that SuperRatings provides is of a general nature and does not take into account an individual’s financial situation, objectives or needs. Because the information that SuperRatings receives about superannuation and pension financial products is from a number of sources, it is not guaranteed to be completely accurate. Because of this, individuals should, before acting on the information, consider its appropriateness having regard to their own financial objectives, situation and needs and if appropriate, obtain personal financial advice on the matter from a financial adviser. Before making a decision regarding any financial product, individuals should obtain and consider a copy of the relevant Product Disclosure Statement from the financial product issue.

The shockwaves caused by the COVID-19 pandemic are still being felt across the economy with extreme readings observed across various economic indicators over the June and September quarters. These include a spike in the unemployment rate to 7.5%, a 7.0% decline in GDP, and a 12% decline in household spending over the June quarter. In this article we look at some of these historic fluctuations and discuss the likely path to recovery.

Households

Household income rose 2.2% over the June quarter despite a 10% fall in hours worked, driven by the increase in social assistance schemes and additional COVID-19 support payments including Jobkeeper. Household spending also declined 12% over the June quarter, reflecting significant changes in spending patterns of consumers due to COVID-19 restrictions around the country. Consumer spending patterns are expected to remain volatile for the remainder of the year, particularly across the services and goods categories.

Household spending

Businesses

The COVID-19 pandemic has also had a significant impact on businesses with many industries recording declines in gross value added over the June quarter. Hospitality and tourism related industries have recorded the largest declines on record, with payroll data indicating a 15–20% decline in jobs in these sectors over the June quarter.

The mixed fortunes of various industries become more obvious when we look at retail sales data, which have also seen historic swings post March 2020. After an initial spike in March, retail sales fell 17.7% in April before showing a record monthly rise of 16.9% in May. The numbers have turned negative again in August, falling 4.0% over the month, driven by the Victorian lockdowns. Nonetheless, despite the extreme volatility experienced since March, overall retail sales are around 6% above the pre-COVID levels in February 2020. At the industry level, Food and Household goods retailing have grown strongly since March, while sales within the Cafes, Restaurants, Clothing and Footwear segments have recorded double digit declines over the period and continue to remain relatively weak into the December quarter.

Retail sales – seasonally adjusted % change

Online retail and e-commerce have also been a main beneficiary of recent events, with many online businesses seeing a huge influx of orders during the lockdowns. Following a large spike in online sales in March and April, the seasonally adjusted online sales figures rose 81.1% in August 2020 compared to August 2019, highlighting the shift to online shopping at the outset of the COVID-19 pandemic in Australia. While these elevated levels of sales activity are unlikely to continue post the lockdowns, COVID-19 has to some extent expedited the structural shift to online retail, a trend we expect will continue for some time given the relatively low penetration of online sales (around 10%) within retail sales in Australia.

Total online sales

International travel

No industry has been more impacted by the pandemic than tourism and international travel. Overseas arrivals have virtually ground to a halt since March 2020, a far cry from the 9.5 million annual visitors to Australia in the preceding year. This has in turn had a material impact on the local tourism industry, with the federal government indicating the industry is likely to lose $55 billion this year alone. This has forced a swath of companies into survival mode resulting in significant job losses across the sector.

To date, not all companies have been able to navigate the challenging environment. The likes of Virgin Australia and STA travel fell into administration in 2020, while companies like Qantas, Sydney Airport, Flight Centre, and Webjet have been forced to raise emergency funds via discounted equity raisings to survive.

Short term visitor arrivals

Unlike some of the other industries that are expected to experience a rather speedy recovery over the next 12 months, the recovery in international travel remains uncertain. The commentary we are seeing from the likes of Qantas and Sydney Airport indicate that international travel is unlikely to return to pre-COVID levels until 2024, implying a long and slow recovery for industry participants.

Outlook

The economic indicators discussed in this article provide a small snapshot of the severe impact of the COVID-19 pandemic on the local economy, with many indicators recording extreme fluctuations over the June and September quarters. This highlights the critical nature of the monetary and fiscal policy changes implemented by the RBA and the Federal Government to support the economy post March 2020.

Looking ahead, the path to recovery remains uncertain with some industries faring better than others. As such, we are likely to see further coordinated policy responses from the RBA and state and federal governments, most likely in the shape of further targeted stimulus and accommodative monetary policy options.


This information is provided by Lonsec Investment Solutions as a corporate authorised representative of Lonsec Research Pty Ltd who hold an AFSL number 421445. This is general advice, which doesn’t consider your personal circumstances. Consider these and always read the product disclosure statement or seek professional advice prior to making any decision about a financial product. You can access a copy of our financial services guide at lonsec.com.au

This video is provided by Lonsec Investment Solutions Pty Ltd ACN 608 837 583, a Corporate Authorised Representative (CAR 1236821) (LIS) of Lonsec Research Pty Ltd ABN 11 151 658 561 AFSL 421 445 (Lonsec Research). LIS creates the model portfolios it distributes using the investment research provided by Lonsec Research but LIS has not had any involvement in the investment research process for Lonsec Research. LIS and Lonsec Research are owned by Lonsec Holdings Pty Ltd ACN 151 235 406.

Past performance is not a reliable indicator of future performance. This is general advice, which doesn’t consider your personal circumstances. Consider these and always read the product disclosure statement or seek professional advice prior to making any decision about a financial product. While care has been taken to prepare the content of this video, LIS makes no representation or warranty to the accuracy or completeness of the information presented, which is drawn from public information not verified by LIS. The information contained in this video is current as at the date of publication.

Copyright © 2020 Lonsec Investment Solutions Pty Ltd ACN 608 837 583

If the May 2019 Budget was all about back to black, this year’s Budget is all about rescuing and repairing the economy.  

Last year’s Budget forecast a small surplus of 0.4% of GDP in 2019-20, the first surplus since the GFC. In fact, a small surplus of 0.4% of GDP was indeed achieved in 2018-19, but budget deficits as large as -4.7% was forecast for 2019-20, and -10.2% for 2020-21. This compares to the -3.7% deficit at the height of the GFC, making it the deepest since World War II. 

Budget net operating balance (% GDP) 


Source: Treasury, Lonsec
 

How did we get here? 

We’ve had a tumultuous year since last year’s Budget, with bush fires, drought, and a global pandemic. Those negative shocks sank our economy into the first recession since 1991, with GDP contracting 7% in the June quarter. 

With reduced economic activity, tax receipts have reduced. Income taxes collected have fallen on the back of lower employment and hours worked. Company tax receipts have also fallen as many businesses remain shut or operate below capacity. GST revenue declined too, with fewer sales of goods and services. Tax receipts fell across the boardwith the one notable exception being—perhaps appropriately—taxes on the sale of spirits. 

Commonwealth revenue and expenses (% GDP) 


Source: Treasury
 

On the spending side, the government has put in place significant stimulatory measures to support the economy and employment. These include: 

  • $120 billion over 2019-20 and 2020-21, primarily for the JobKeeper payment. 
  • $46 billion mainly in the Coronavirus Supplement, economic support payments to households, and increased JobSeeker payment. 
  • $40 billion to provide further support for apprentices, trainees, hospitals, aviation, and the infrastructure sector. 


S
ource: Budget papers 

Overall, compared to the government’s Economic and Fiscal Update in July 2020, where a small surplus of $12 billion was forecast for 2020-21 (0.6% of GDP), this Budget shows an estimated deficit of $198 billion (-10.2% of GDP). Contributing the most to the deterioration is around $127 billion in additional spending, followed by $42 billion less in expected revenue due to reduced economic activity. 

How are we going to pay for all this?  

The short answer is, with debt. And a lot of it. Commonwealth Government net debt is forecast to rise to 36% of GDP in 2020-21, and even further to 43.8% in 2023-24. This compares to 19% in 2018-19. 

This may sound high, but by international standards Australia’s net government debt level is relatively manageable. Prior to the COVID-19 pandemic, the average net debt level among developed economies was 43% of GDP. The US and UK both had net debt of around 77% of GDP, while Japan had the highest at 155% of GDP. Ratings agency S&P has confirmed Australia’s AAA rating with negative outlook, with Fitch and Moody’s reserving judgement for now.  

With interest rates at historic lows, financing the debt should be a secondary consideration, with the primary focus being to get the economy back on track 

What are the key Budget measures? 

  • $26.7 billion temporary investment tax incentives: Businesses with aggregated annual turnover of under $5 billion can deduct the full cost of eligible capital assets acquired from 6 October 2020 and first used or installed by 30 June 2022. 
  • $17.8 billion of income tax cut: Bringing forward the second stage of the Personal Income Tax Plan by two years to 1 July 2020 as well as a one-off additional benefit from the low and middle income tax offset in 2020-21. 
  • $15.6 billion in additional spending on the JobKeeper Payment: Eligibility has been expanded largely In light of the prolonged restrictions in Victoria. 
  • $10.7 billion in infrastructure spending: Including $6.7 billion in grants to the states, $3 billion for roads and community infrastructure, and $1 billion for water infrastructure. 
  • $4 billion for a JobMaker Hiring CreditTo give businesses incentives to take on additional employees aged between 16 and 35. 
  • Additional measures: Including $1.2 billion to support 100,000 new apprentices and trainees with a 50% wage subsidy and undoing $2 billion cuts to R&D incentives. 

When will we get out of the recession? 

The Treasury forecasts economic activity to pick up from late 2020 and into early 2021. The recovery is expected to be driven by a further easing of restrictions and improvements in business and consumer confidence. Economic activity will be further supported by Government stimulatory measures, both fiscal and monetaryThe RBA has also hinted at further easing, with another rate cut or announcement of further QE widely expected at its November meeting 

The IMF in its June 2020 World Economic Outlook forecast Australian GDP to decline by -4.5% in 2020 before rising by 4% in 2021. While this is our first recession since 1991, Australia’s experience with containing the virus outbreak means the economic is faring relatively well by international standards. For example, the IMF forecast US GDP to contract by -8% in 2020, -10.2% in the UK, and -12.8% in Italy and Spain. 

Yesterday’s Budget forecasts GDP to fall by -3.75%better than the IMF forecastbefore growing by 4.25% in 2021. It also forecasts unemployment to peak at 8% in the December quarter of 2020, before falling to 6.5% by June 2022 as economic activity recovers. Both the GDP and unemployment forecasts are more optimistic than many leading economists believe. 

While the COVID-19 pandemic should be a severe but temporary shock, the path to recovery remains a gradual and uncertain process. This Budget has taken important steps to support the economic recovery, but the speed and magnitude will depend on many other factors, including international health and economic outcomes, as well as domestic business and consumer confidence. 

Broad measures such as income tax cuts and investment allowance will support overall business and consumer confidence, but more targeted measures might be welcomed by more severely affected sectors such as education and tourism. The government also failed to take the opportunity to enact structural reforms such as reforming the tax system or improving overall labour productivity, which would benefit economic growth in the long term. 

Issued by Lonsec Research Pty Ltd ABN 11 151 658 561 AFSL 421 445 (Lonsec). Warning: Past performance is not a reliable indicator of future performance. Any advice is General Advice without considering the objectives, financial situation and needs of any person. Before making a decision read the PDS and consider your financial circumstances or seek personal advice. Disclaimer: Lonsec gives no warranty of accuracy or completeness of information in this document, which is compiled from information from public and third-party sources. Opinions are reasonably held by Lonsec at compilation. Lonsec assumes no obligation to update this document after publication. Except for liability which can’t be excluded, Lonsec, its directors, officers, employees and agents disclaim all liability for any error, inaccuracy, misstatement or omission, or any loss suffered through relying on the document or any information. ©2020 Lonsec. All rights reserved. This report may also contain third party material that is subject to copyright. To the extent that copyright subsists in a third party it remains with the original owner and permission may be required to reuse the material. Any unauthorised reproduction of this information is prohibited. 

In recent weeks we’ve seen increased market volatility. The Nasdaq, which represents the leading technology stocks in the US market, has seen a pull back following an incredible rally, and markets seem to be in a range-trading pattern. We all know the saying that when the US market sneezes, the rest of the world catches a cold, and there is some truth in that.

The much-anticipated upcoming US presidential election is certainly contributing to market volatility. Historically, in the months leading up to US elections, markets have exhibited an increased level of volatility, and it is no different this time. Markets are not political, but they are sensitive to uncertainly, so as we get closer to the election in November, we are likely to see the market gyrate. As to how markets will react to a Republican or Democratic win, history is not conclusive on this, however what has been observed is that in the lead up to an election, avoiding recessions and a positive stock market tend to assist re-election.

On the policy front, attention has shifted from monetary policy to fiscal policy and markets are looking to see to what extent fiscal support will continue to prop up economies across the world. In Australia, as we await the wind back of policies such as the JobKeeper payment scheme, markets will be watching carefully to see if we succumb to the so-called ‘fiscal cliff’ and to what degree some sectors have been supported by government money. The retail sector in particular will be interesting to observe given the incredible rebound and resilience the sector has shown since March, with companies such as Harvey Norman and Nick Scali posting strong sales.

Amidst this backdrop we have not shifted our Lonsec asset allocation views. While we have seen some valuation support appear within Australian equities, much of the value is being driven by down beaten-down parts of the market, such as the banks, and we still think the sector will face challenges in a world dominated by low interest rates, so at this stage we have opted to retain our ‘Neutral’ exposure to Australian equities. If we see a material pull back in markets over the next few weeks or months, we will reconsider our position across Australian and global equities.

Importantly, we have adjusted our portfolios to assist in managing downside risk by taking specific sector and investment strategy tilts within the portfolios, and at the same time having exposure to growth parts of the market should markets appreciate. Alternative allocations such as our gold exposure have performed in line with expectations, holding up better than equity markets on down market days.

In the meantime, buckle up because the ride may be bumpy over the coming months!

IMPORTANT NOTICE: This document is published by Lonsec Investment Solutions Pty Ltd ACN 608 837 583, a Corporate Authorised Representative (CAR 1236821) (LIS) of Lonsec Research Pty Ltd ABN 11 151 658 561 AFSL 421 445 (Lonsec Research).  LIS creates the model portfolios it distributes using the investment research provided by Lonsec Research but LIS has not had any involvement in the investment research process for Lonsec Research. LIS and Lonsec Research are owned by Lonsec Holdings Pty Ltd ACN 151 235 406. Please read the following before making any investment decision about any financial product mentioned in this document.

DISCLOSURE AT THE DATE OF PUBLICATION: Lonsec Research receives a fee from the relevant fund manager or product issuer(s) for researching financial products (using objective criteria) which may be referred to in this document. Lonsec Research may also receive a fee from the fund manager or product issuer(s) for subscribing to research content and other Lonsec Research services.  LIS receives a fee for providing the model portfolios to financial services organisations and professionals. LIS’ and Lonsec Research’s fees are not linked to the financial product rating(s) outcome or the inclusion of the financial product(s) in model portfolios. LIS and Lonsec Research and their representatives and/or their associates may hold any financial product(s) referred to in this document, but details of these holdings are not known to the Lonsec Research analyst(s).

WARNINGS: Past performance is not a reliable indicator of future performance. Any express or implied rating or advice presented in this document is limited to general advice and based solely on consideration of the investment merits of the financial product(s) alone, without taking into account the investment objectives, financial situation and particular needs (“financial circumstances”) of any particular person. Before making an investment decision based on the rating or advice, the reader must consider whether it is personally appropriate in light of his or her financial circumstances or should seek independent financial advice on its appropriateness.  If the financial advice relates to the acquisition or possible acquisition of a particular financial product, the reader should obtain and consider the Investment Statement or the Product Disclosure Statement for each financial product before making any decision about whether to acquire the financial product.

DISCLAIMER: No representation, warranty or undertaking is given or made in relation to the accuracy or completeness of the information presented in this document, which is drawn from public information not verified by LIS. The information contained in this document is current as at the date of publication. Financial conclusions, ratings and advice are reasonably held at the time of publication but subject to change without notice. LIS assumes no obligation to update this document following publication. Except for any liability which cannot be excluded, LIS and Lonsec Research, their directors, officers, employees and agents disclaim all liability for any error or inaccuracy in, misstatement or omission from, this document or any loss or damage suffered by the reader or any other person as a consequence of relying upon it.

Copyright © 2020 Lonsec Investment Solutions Pty Ltd ACN 608 837 583 (LIS). This document may also contain third party supplied material that is subject to copyright.  The same restrictions that apply to LIS copyrighted material, apply to such third-party content.

Traditionally a defensive asset class with yield, backed by leases delivering reliable income streams; global listed property appears to be better positioned than most asset classes for a post COVID-19 world.

As at 31 May 2020, G-REITs appear to be attractively priced relative to other asset classes, trading at a -13% discount to Net Asset Values (-4% in May 2019) and at a discount to Global Equities. However, valuations of sub-sectors and regions vary and most Managers are positioning their portfolios according to their assessment of relative value of stocks within their sector and region. While earnings growth expectations for CY2020 have slipped from +4.8% to -3.7%, they are expected to recover in CY2021 as COVID-19 restrictions ease and the situation normalises. G-REITs still offer dividend yields of 3.3% to 5.8% p.a. which are attractive and offer an
above-average premium relative to bonds (+3% to +5%) across all markets.

There has been a close correlation between bond rates and the global property securities sector in recent years, with upticks in the outlook for interest rates coinciding with pull-backs in the value of property securities. Despite the deterioration in operating conditions due to the COVID-19 pandemic, the commitment of central banks to maintaining interest rates ‘lower for much longer’ through expansionary monetary policy and yield curve control is expected to provide support to the asset class. For rental focussed REITs the outlook is underpinned by existing tenants on long leases with in-built rental growth. REITs with large funds management exposure may hold up well (based on ongoing fees), but those with high development exposure are more susceptible in weaker market conditions.

Unlike during the Global Financial Crisis (GFC) of 2008, G-REIT balance sheets are in better shape although many REITs have raised equity capital in order to ensure they can withstand potential reductions in valuations impacting on debt covenants. Gearing is manageable (LVR ~30%), interest rates are low (2-3%), and REITs have a more conservative payout ratio on their corporate earnings component.

The COVID-19 pandemic has in many ways exacerbated and accelerated secular trends and bifurcation between sector ‘winners and losers’. Sectors expected to benefit from the ‘new normal’ include Data Centres, Storage and Manufactured Housing, which have grown materially over the last 10 years, and are expected to continue to outperform based on the rise of the ‘digital economy’ and demographic changes. Another potential beneficiary is the Industrial/Logistics sector, which outperformed during the COVID-19 downturn, and is expected to continue to grow off the back of e-commerce tailwinds. However, access to these sectors comes at a premium.

Residential rental (apartments, multi & single family housing, student housing) is also favoured given the consistency of income and demographic trends, however higher unemployment poses a risk.

On the flip-side, traditional ‘bricks and mortar’ Retail property, the tenants of which were already under pressure pre-pandemic, are expected to face increased weakness particularly from ‘middle’ placed assets (between fortress malls and food-based neighbourhood centres). While earnings will recover once restrictions are lifted, long-term structural issues mean asset values may come under pressure as rents adjust downwards. Hotels/Lodging are expected to recover more slowly and will be heavily reliant on vaccines which remain some time away.

While the ‘working from home’ phenomenon poses a risk to Office demand, astute landlords may look to offer tenants a more flexible model to encourage continuity at the next lease expiry. Expectations are for a rise in vacancy levels and lower net effective rents, although whether this is a cyclical or structural change is still up for debate.

Issued by Lonsec Research Pty Ltd ABN 11 151 658 561 AFSL 421 445 (Lonsec). Warning: Past performance is not a reliable indicator of future performance. Any advice is General Advice without considering the objectives, financial situation and needs of any person. Before making a decision read the PDS and consider your financial circumstances or seek personal advice. Disclaimer: Lonsec gives no warranty of accuracy or completeness of information in this document, which is compiled from information from public and third-party sources. Opinions are reasonably held by Lonsec at compilation. Lonsec assumes no obligation to update this document after publication. Except for liability which can’t be excluded, Lonsec, its directors, officers, employees and agents disclaim all liability for any error, inaccuracy, misstatement or omission, or any loss suffered through relying on the document or any information. ©2020 Lonsec. All rights reserved. This report may also contain third party material that is subject to copyright. To the extent that copyright subsists in a third party it remains with the original owner and permission may be required to reuse the material. Any unauthorised reproduction of this information is prohibited. 

Global equity markets in 2020 had a promising start to the year as the S&P 500 Index reached a new record peak of 3,380 on 20 February 2020, backed by better macroeconomic data and the prospect of reduced geopolitical headwinds (particularly on the US-China trade front).

However, the progressive realisation across financial markets that COVID-19 represented an existential threat to society necessitating the shutdown of whole swathes of the economy triggered a sharp sell down in mid to late March, sending the S&P 500 index falling by 34% to a low of 2,237 on 23 March 2020. The US equities market tripped circuit breakers four times in two weeks (March 9, 12, 16 and 18). The circuit breakers pause trading for 15 minutes in the event of a sudden 7% fall.

Key indices were hit hard as the coronavirus spread globally

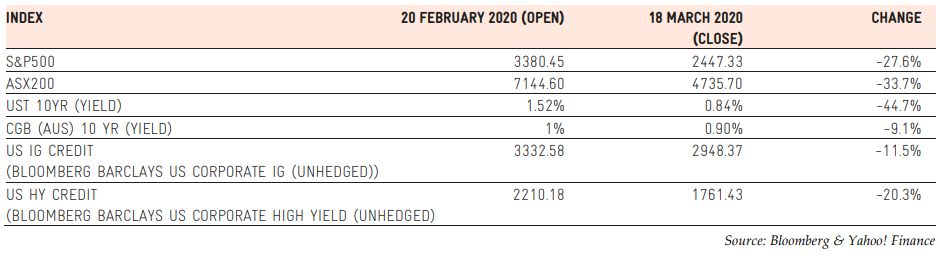
Assets with any risk were sold off. Equities expectedly suffered steep drawdowns with the US and Australia, for instance, entering bear markets. This also marked the close of the longest bull market in US history which lasted some 11 years. Credit also suffered heavy losses with high yield nursing a drop of some 20%. US Treasuries retained their safe harbour status with yields collapsing by nearly 30%. The same cannot be said about Australia’s government bonds which experienced rising yields and casting a cloud over fixed income portfolios.

The sell-off was exacerbated by an oil price collapse after Saudi Arabia launched a price war. Oil prices experienced their worst quarter in history with prices dropping by close to 26% in the US on March 9 after Saudi Arabia dissolved a pact with Russia to curtail production. The prospect of reduced global demand due to COVID-19 forced the oil prices to enter in negative territory in April 2020 for the first time ever, as producers ran out of space to store the oversupply.

This rekindled fears for the solvency of the US shale industry from 2015/2016 when the world was last awash with oil. There was concern in markets then that there would be mass failures which would particularly rattle high yield bond markets. The worst concerns weren’t then realised but have re-emerged with COVID-19 and Saudi actions.

Investors are venturing out of safehaven assets

The deep recession in Q1 2020, fuelled by public health, economic, and energy crises, caused investors to start piling into expensive defensive and growth sectors like healthcare, information technology and consumer staples. In contrast, cyclical sectors such as banks, airlines, energy and travel stocks were hit hard.

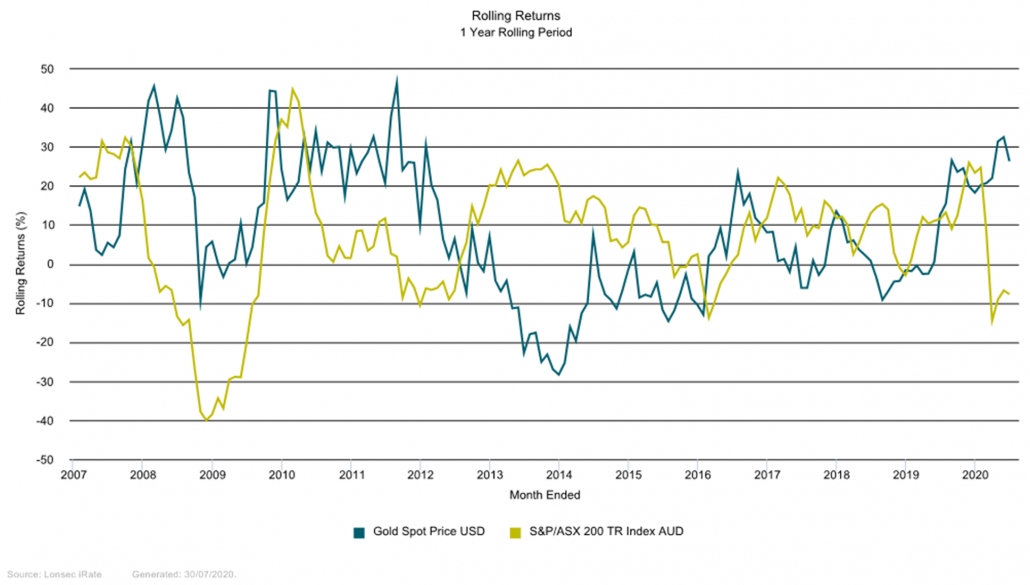
As the economies went into hibernation to stop the spread of the coronavirus, major central banks slashed rates and restarted asset purchases, while G20 governments promised $5 trillion stimulus packages to moderate the economic impact of the pandemic. Such aggressive measures by policymakers globally boosted the safehaven assets such as government bonds and Gold. US Treasuries had their best quarter in Q2 2020 since the GFC and Gold price reached an all-time high of close to $2000/ounce in August 2020.

In Q2 2020, investors’ risk appetite gradually returned with the easing of COVID-19 lockdown restrictions and excessive monetary and fiscal stimulus measures announced across the world. This led to the recovery of equity markets with S&P 500 officially entering a bull market on August 18, reaching an all-time high of 3,500. While the S&P 500 index has returned to pre-pandemic levels, there is a sharp contrast in the gains of various sectors, with only 38% of stocks (primarily healthcare and information technology) in the index reporting gains over that period.

Which strategies worked?

Lonsec monitored a number of strategies within the global equities sector during the depths of the crisis that were deemed higher risk due to their market exposure, central bank or government policy intervention, market volatility, and illiquidity or possible high volumes of redemption requests.

While the market has now settled, we saw funds operating within hedged variation strategies, Emerging Markets, Quantitative, Natural Resources, and Fundamental Value, posting deep declines in the first quarter of 2020. Unsurprisingly, COVID-19 induced discrepancies in the wider sectors favoured growth managers over value (and the benchmark).

Value-style funds have endured a long period of underperformance relative to growth-biased peers in a long bull market favouring large technology firms. Lonsec notes that the Value managers under its coverage are not necessarily buying ‘junk’ stocks and that a volatile downturn such as this can be used as an opportunity to buy well-capitalised businesses at cheaper prices. While this sub-sector returned 3.7% for the June quarter, ranking at the lower end of the global equity spectrum, this remains a positive sign for those dogmatic value-oriented managers.

Lonsec notes that the funds management industry had been refocusing on systematic strategies which offer the promise of consistent and repeatable alpha but with scalability and cost advantages demanded by investors. Sadly, the average product in the Quantitative cohort experienced similar weakness to Fundamental Value due to a heavy dose of ‘value’ in addition to momentum in their quantitative models’ building blocks.

Quantitative strategies in general have struggled to price assets in current markets, as their processes are designed to function in ‘normal’ market conditions, when the market is operating according to fundamentals and long-term observations. The uncertainty, volatility, and leverage are causing pain generally across the sector. Performance for the average systematic product over Q1 2020 was -15.3%, compared to -3.0% per annum over the 12 months to 30 June 2020. Pleasingly, the average Managed-Volatility strategy outperformed its vanilla Quantitative peers, collectively returning -8.6% over the March quarter.

Typically emerging markets-oriented strategies tend to get caught up in a flight to quality, although Lonsec notes the Asia sub-sector (-7.6%) held up better than developed markets during Q1 2020 due in part to the relatively fast and well-organised response to COVID-19 within the region, presumably as a result of lessons learned in the past. The same cannot be said of regional India strategies (-20.8%), which suffered heavy losses given the country’s less successful containment efforts.

Other factors at play include the greater cyclical exposure generally within emerging market regions due to the greater exposure to commodities and energy from countries within the Latin America and Middle East regions, as well as Russia. As mentioned, dispersion has also considerably widened among stocks as the market punished companies exposed to discretionary spending (i.e. travel) and in highly cyclical sectors (i.e. energy), while rewarding those stocks that were unaffected or ended up benefiting from the new environment, most notably technology firms. Such dispersion is, however, an attractive environment for active managers to add considerable alpha.

Issued by Lonsec Research Pty Ltd ABN 11 151 658 561 AFSL 421 445 (Lonsec). Warning: Past performance is not a reliable indicator of future performance. Any advice is General Advice without considering the objectives, financial situation and needs of any person. Before making a decision read the PDS and consider your financial circumstances or seek personal advice. Disclaimer: Lonsec gives no warranty of accuracy or completeness of information in this document, which is compiled from information from public and third-party sources. Opinions are reasonably held by Lonsec at compilation. Lonsec assumes no obligation to update this document after publication. Except for liability which can’t be excluded, Lonsec, its directors, officers, employees and agents disclaim all liability for any error, inaccuracy, misstatement or omission, or any loss suffered through relying on the document or any information. ©2020 Lonsec. All rights reserved. This report may also contain third party material that is subject to copyright. To the extent that copyright subsists in a third party it remains with the original owner and permission may be required to reuse the material. Any unauthorised reproduction of this information is prohibited. 

It has been an interesting month in markets. The S&P 500 Index reached 12 month highs with markets brushing off March’s COVID-19 panic. There have been many discussions about how narrow the rally has been in that a handful of stocks have driven the sharp rebound. In fact, just over 35% of stocks in the index have had a positive gain over the year. Leading stocks in the technology sector have been the winners, with Alphabet Inc (Google), Amazon.com Inc and Apple Inc rebounding strongly from March. Essentially, growth and quality stocks have been rewarded and the impact of COVID-19 on such companies has been minimal relative to other sectors. In some instances, the pandemic has accelerated growth for online retail businesses such as Amazon. On the other hand, there have been notable losers. Airlines, retail property and infrastructure assets such a toll roads and airports have been losers on the back of COVID-19. This divergence has been reflected in the recent Australian reporting season with companies such as JB Hi-Fi reporting record annual profits, while Qantas continues to cut more jobs as it prepares for a $10 billion revenue hit.

A key challenge for investors at the moment is whether to continue to back the ‘winners’ and pay more for growth, or to look for value amidst some of the ‘losers’ and try to identify a bargain. From a portfolio perspective we have taken the view that the current market conditions are favourable to quality/growth companies particularly given the low interest rate environment. However we also continue to have some exposure to the value part of the market, as we believe that some of the bad news has lowered the price of some of these sectors and that over the medium to long term there is an opportunity for these stocks to rebound.

While the current market dynamics are different to what we experienced during the tech bubble what is very similar is some of the narrative. I recall prior the collapse of the tech sector we were in a ‘new paradigm’ where value investing was dead and growth companies prospered. History generally doesn’t repeat but it can rhyme. Ensuring that your portfolios are not anchored to one part of the market and they remain diversified, particularly in an environment where uncertainly persists, remains important.

IMPORTANT NOTICE: This document is published by Lonsec Investment Solutions Pty Ltd ACN 608 837 583, a Corporate Authorised Representative (CAR 1236821) (LIS) of Lonsec Research Pty Ltd ABN 11 151 658 561 AFSL 421 445 (Lonsec Research).  LIS creates the model portfolios it distributes using the investment research provided by Lonsec Research but LIS has not had any involvement in the investment research process for Lonsec Research. LIS and Lonsec Research are owned by Lonsec Holdings Pty Ltd ACN 151 235 406. Please read the following before making any investment decision about any financial product mentioned in this document.

DISCLOSURE AT THE DATE OF PUBLICATION: Lonsec Research receives a fee from the relevant fund manager or product issuer(s) for researching financial products (using objective criteria) which may be referred to in this document. Lonsec Research may also receive a fee from the fund manager or product issuer(s) for subscribing to research content and other Lonsec Research services.  LIS receives a fee for providing the model portfolios to financial services organisations and professionals. LIS’ and Lonsec Research’s fees are not linked to the financial product rating(s) outcome or the inclusion of the financial product(s) in model portfolios. LIS and Lonsec Research and their representatives and/or their associates may hold any financial product(s) referred to in this document, but details of these holdings are not known to the Lonsec Research analyst(s).

WARNINGS: Past performance is not a reliable indicator of future performance. Any express or implied rating or advice presented in this document is limited to general advice and based solely on consideration of the investment merits of the financial product(s) alone, without taking into account the investment objectives, financial situation and particular needs (“financial circumstances”) of any particular person. Before making an investment decision based on the rating or advice, the reader must consider whether it is personally appropriate in light of his or her financial circumstances or should seek independent financial advice on its appropriateness.  If the financial advice relates to the acquisition or possible acquisition of a particular financial product, the reader should obtain and consider the Investment Statement or the Product Disclosure Statement for each financial product before making any decision about whether to acquire the financial product.

DISCLAIMER: No representation, warranty or undertaking is given or made in relation to the accuracy or completeness of the information presented in this document, which is drawn from public information not verified by LIS. The information contained in this document is current as at the date of publication. Financial conclusions, ratings and advice are reasonably held at the time of publication but subject to change without notice. LIS assumes no obligation to update this document following publication. Except for any liability which cannot be excluded, LIS and Lonsec Research, their directors, officers, employees and agents disclaim all liability for any error or inaccuracy in, misstatement or omission from, this document or any loss or damage suffered by the reader or any other person as a consequence of relying upon it.

Copyright © 2020 Lonsec Investment Solutions Pty Ltd ACN 608 837 583 (LIS). This document may also contain third party supplied material that is subject to copyright.  The same restrictions that apply to LIS copyrighted material, apply to such third-party content.

As the ETF market expands, Australian investors are able to take advantage of new investment product innovations, implement a range of different strategies, and gain exposure to different markets and sectors. The depth of the ETF market has opened up opportunities to investors, but it also presents risks for the unwary.

Due diligence is essential when picking an ETF for your portfolio. Even if you’re looking for passive index exposure, not all ETFs are created equal. Experience and track record count, as does the robustness of the investment process and the risk management framework.

Some ‘smart beta’ approaches may be considered under a process which leverages the expertise of analysts covering active managed funds if there is a level of discretion or judgement. Also, the efficacy of the index being tracked should form a key consideration of your research efforts, especially in an environment of ever-increasing index proliferation and complexity. Below are the three key questions you should be thinking about when you’re on the hunt for the right ETF.

  1. What am I getting exposure to?

This is the first question you should ask. Sometimes you need to dig a bit deeper to discover more about an investment product’s risk and return characteristics, including the sectors, factors, or regions the product is targeting. Sometimes, a product may have unexpected risk and return outcomes during different market regimes, including periods of intense volatility or uncertainty.

Is the index concentrated in particular sectors, companies, or countries? Even if you are investing in an index, you need to be aware of your exposure. The US S&P 500 Index is market cap weighted, with significant weights to mega cap tech stocks like Apple and Amazon. In Australia, the financial services and materials sectors predominate the S&P/ASX 200 Index.

Do the holdings make sense in terms of the fund’s objectives? Investors need to look beyond the fund’s name or the index it tracks and examine the underlying holdings to understand the fund’s risk and return profile, and judge whether it adheres to its stated objective. Finally, look at how long the index has been around. Even as new indexes are constructed, the index provider’s tenure in the marketplace can indicate a measure of stability.

  1. Who is managing my money?

Finding out more about the provider and the investment team that sits behind the product is essential. How experienced is the ETF provider? Has been around through different market cycles and seen the best and worst of what the market can throw at you? Having experienced people in the senior investment team is important, but it can also lead to key person risk if the fund’s strategy is too reliant on the expertise of a small number of people, or if processes are not widely understood throughout the fund.

What are the fund’s and the manager’s total assets under management? Product break even points vary, but a useful rule of thumb is $50 million. Managers can sustain lower balances if it is part of a broader suite of products, but you should make sure there is a sufficiently deep pool of funds to ensure efficiency and scale. Greater assets under management can also enhance a fund’s liquidity.

How does the company manage risk? Ideally, there should be a disciplined investment process, broad market expertise, and sophisticated risk systems in place.

Does the company provide trading support and ongoing education? Trading support and actionable investment strategies can add value for investors, especially when it comes to incorporating the product within a broader portfolio. Good managers will be transparent about the type of investors the product is suitable for and how it to maximise the product’s value in a portfolio context.

  1. How am I getting exposure?

You need to know what you are exposed to, but just as importantly, you need to know how you are getting that exposure. Firstly, what is the index weighting methodology (market-capitalisation, price-weighted, fundamentally weighted, rules-based, or equal-weighted)? The weighting methodology has a major impact on performance and the risk/return characteristics among seemingly similar indices.

Does the ETF hold derivatives or synthetics? Derivatives can be an effective way to manage risks, but they can also add an additional element of complexity. Understanding how risk overlays work, how they behave under different market conditions, and the risk and return trade-offs they make, are all necessary for a complete due diligence.

How often is the index rebalanced? Frequent rebalancing will ensure closer index tracking, but increases turnover, trading costs, and potentially realised taxes. How many companies or bonds are in the index and what are the diversification guidelines? If the fund only partially replicates the index, it may invest in fewer securities, especially at the less liquid end of the market. Rather than holding every stock, it may hold a representative sample, but you should understand how this sample is determined.

Finally, what are the fund’s total fees? The fund’s management fee as well as the bid/offer spread needs to be considered as part of the total cost of transacting. High trading volumes can mean greater liquidity and usually also mean tighter spreads. Brokerage and tax should also be factored into your individual holding return.

Keep monitoring your portfolio

Once you have chosen the investment products that are the right fit for your portfolio, that isn’t the end of the story. You should monitor your investments and ensure that the products you picked continue to do what you expected of them. Sometimes investment teams change, liquidity events pop up, or the market enters a period of volatility. Keeping tabs on your portfolio means more than just checking your account balance. It requires ongoing due diligence to ensure that the people you entrust your money to are sticking to their mandate and delivering on their product’s promise.

Issued by Lonsec Research Pty Ltd ABN 11 151 658 561 AFSL 421 445 (Lonsec). Warning: Past performance is not a reliable indicator of future performance. Any advice is General Advice without considering the objectives, financial situation and needs of any person. Before making a decision read the PDS and consider your financial circumstances or seek personal advice. Disclaimer: Lonsec gives no warranty of accuracy or completeness of information in this document, which is compiled from information from public and third-party sources. Opinions are reasonably held by Lonsec at compilation. Lonsec assumes no obligation to update this document after publication. Except for liability which can’t be excluded, Lonsec, its directors, officers, employees and agents disclaim all liability for any error, inaccuracy, misstatement or omission, or any loss suffered through relying on the document or any information. ©2020 Lonsec. All rights reserved. This report may also contain third party material that is subject to copyright. To the extent that copyright subsists in a third party it remains with the original owner and permission may be required to reuse the material. Any unauthorised reproduction of this information is prohibited. 

Gold has been in the headlines over the last couple of weeks, as the price of gold has recently surpassed the much anticipated $2,000 per ounce mark. The gold spot price is up approximately 26% in USD for the year as at 30 June 2020 compared to the Australian equities market (S&P/ASX 200), which is down just over 7% for the same period. So, why has gold appreciated? Gold has historically been viewed as a safe haven asset in times of uncertainty, it is viewed as a store of value offering protection against inflation and has also offered diversification benefits from traditional asset classes such as equities.

Over the past 12 months we have seen uncertainty dominate markets. In 2019 geopolitical tensions particularly between the US and China on trade contributed significantly to market volatility and overall nervousness in market. Roll forward to 2020 and we have been hit by a global health pandemic, geopolitical tensions have increased between the US and China and to add to this we have witnessed increased civil unrest in the US and we have a highly politicised US presidential election coming up. The elevation of macro-economic and geopolitical risks has increased ‘flight to quality’ episodes at the same time monetary policy is becoming less potent and low to negative rates reduce the opportunity cost of holding gold. Furthermore, the debasement of the USD has increased the preference of gold as a ‘safe haven’ asset relative to the USD.

From a portfolio perspective Lonsec views gold as an alternative asset. The low correlation to traditional assets enhances portfolio diversification, particularly in times of uncertainly. Given the increased uncertainly in the macro economic and geopolitical environment Lonsec added gold to the Lonsec Multi-Asset Portfolio on 17 March via the GOLD (ticker code) ETF which provides exposure to physical gold. We have subsequently also incorporated GOLD in our Listed Diversified Portfolios in both instances sitting within an alternatives allocation. The exposure has performed as expected, helping smooth portfolio returns in periods of market stress. Outside of providing diversification gold can also assist in hedging inflation risk. While we do not foresee inflation as a near term risk inflation pressures may emerge down the track particularly if we see global supply chains reconfigure and manufacturing industries come back onshore which would see a likely jump in inflation.

It is however important not to view gold as some kind of investment panacea. In non-stressed market environments gold will likely lag risk assets. Returns in USD have been around the 3 to 4% mark in stable market environments. Furthermore, gold can be volatile and 20% drawdowns are not uncommon therefore portfolio position sizing is important.

Whilst the gold price hitting the $2,000 milestone is significant, what’s more important is that if we are heading into a period of increased bouts of volatility, having exposure to assets that can perform in such environments should assist in dampening the adverse impacts on portfolios.

IMPORTANT NOTICE: This document is published by Lonsec Investment Solutions Pty Ltd ACN 608 837 583, a Corporate Authorised Representative (CAR 1236821) (LIS) of Lonsec Research Pty Ltd ABN 11 151 658 561 AFSL 421 445 (Lonsec Research).  LIS creates the model portfolios it distributes using the investment research provided by Lonsec Research but LIS has not had any involvement in the investment research process for Lonsec Research. LIS and Lonsec Research are owned by Lonsec Holdings Pty Ltd ACN 151 235 406. Please read the following before making any investment decision about any financial product mentioned in this document.

DISCLOSURE AT THE DATE OF PUBLICATION: Lonsec Research receives a fee from the relevant fund manager or product issuer(s) for researching financial products (using objective criteria) which may be referred to in this document. Lonsec Research may also receive a fee from the fund manager or product issuer(s) for subscribing to research content and other Lonsec Research services.  LIS receives a fee for providing the model portfolios to financial services organisations and professionals. LIS’ and Lonsec Research’s fees are not linked to the financial product rating(s) outcome or the inclusion of the financial product(s) in model portfolios. LIS and Lonsec Research and their representatives and/or their associates may hold any financial product(s) referred to in this document, but details of these holdings are not known to the Lonsec Research analyst(s).

WARNINGS: Past performance is not a reliable indicator of future performance. Any express or implied rating or advice presented in this document is limited to general advice and based solely on consideration of the investment merits of the financial product(s) alone, without taking into account the investment objectives, financial situation and particular needs (“financial circumstances”) of any particular person. Before making an investment decision based on the rating or advice, the reader must consider whether it is personally appropriate in light of his or her financial circumstances or should seek independent financial advice on its appropriateness.  If the financial advice relates to the acquisition or possible acquisition of a particular financial product, the reader should obtain and consider the Investment Statement or the Product Disclosure Statement for each financial product before making any decision about whether to acquire the financial product.

DISCLAIMER: No representation, warranty or undertaking is given or made in relation to the accuracy or completeness of the information presented in this document, which is drawn from public information not verified by LIS. The information contained in this document is current as at the date of publication. Financial conclusions, ratings and advice are reasonably held at the time of publication but subject to change without notice. LIS assumes no obligation to update this document following publication. Except for any liability which cannot be excluded, LIS and Lonsec Research, their directors, officers, employees and agents disclaim all liability for any error or inaccuracy in, misstatement or omission from, this document or any loss or damage suffered by the reader or any other person as a consequence of relying upon it.

Copyright © 2020 Lonsec Investment Solutions Pty Ltd ACN 608 837 583 (LIS). This document may also contain third party supplied material that is subject to copyright.  The same restrictions that apply to LIS copyrighted material, apply to such third-party content.

Super funds have started the new financial year with some positive momentum but face a period of stark uncertainty as Australian cases of Covid-19 rise and Victoria enters harsher lockdown conditions.

While we have seen stabilisation in markets, they remain vulnerable to further shocks, while super fund performance is contingent on how communities and economies cope with further waves of infections.

According to estimates from leading superannuation research house SuperRatings, the median balanced option returned 0.9% in July as markets continued to rebuild following March’s falls. Overall, super funds have made it through in good shape but are preparing for more market ups and downs through the rest of the 2020 calendar year.

“The outlook is still unclear but based on recent performance super funds have shown they can weather the Covid-19 storm,” said SuperRatings Executive Director Kirby Rappell.

“Looking at SuperRatings’ balanced option index, the sector is 4.0% below where it was at the start of 2020. This is less than ideal for members, but thanks to the recovery we saw over the June quarter we have already made up a lot of ground. Hopefully this momentum can continue, and members can swiftly regain their super wealth.”

According to SuperRatings’ estimates, the median balanced option is down 1.2% over the 12 months to July. The median growth option is estimated to have fallen -1.7% while the median capital stable option is steady at 0.5%.

Accumulation returns to end of July 2020

  CYTD 1 yr 3 yrs (p.a.) 5 yrs (p.a.) 7 yrs (p.a.) 10 yrs (p.a)
SR50 Growth (77-90) Index -5.1% -1.7% 5.8% 5.9% 7.7% 7.8%
SR50 Balanced (60-76) Index -4.0% -1.2% 5.5% 5.3% 6.9% 7.4%
SR50 Capital Stable (20-40) Index -0.9% 0.5% 3.7% 3.8% 4.6% 5.1%

Source: SuperRatings estimates

Pension returns have performed more or less in line with accumulation returns over the past year. The median balanced pension option is estimated to have fallen 1.2% over the 12 months to July, compared to a drop of 1.9% from the median growth option and a modest rise of 0.5% from the median capital stable option.

Pension returns to end of July 2020

  CYTD 1 yr 3 yrs (p.a.) 5 yrs (p.a.) 7 yrs (p.a.) 10 yrs (p.a)
SRP50 Growth (77-90) Index -5.6% -1.9% 6.5% 6.7% 8.5% 8.7%
SRP50 Balanced (60-76) Index -4.1% -1.2% 6.0% 6.0% 7.5% 8.1%
SRP50 Capital Stable (20-40) Index -1.0% 0.5% 4.3% 4.3% 5.1% 5.8%

Source: SuperRatings estimates 

July’s results represent the fourth month in a row of positive returns for super, following the 9.2% drop members experienced in March. While the results are promising, there is still a way to go before members recoup their losses, and the Covid-19 situation in Australia remains precarious as other states brace for potential spikes in infections.

“We can certainly take heart from recent performance, but we should not underestimate the challenge that we still face,” said Mr Rappell.

“Markets are incredibly difficult to navigate at the moment. Globally, we are seeing a disconnect between the rise in share valuations and the weakness in economic data. Meanwhile, the low yield environment will only be exacerbated by governments issuing more debt to shore up budgets and continue providing support to those affected by the virus.”

Growth in $100,000 invested over 15 years to 30 July 2020

Source: SuperRatings estimates

Taking a long-term view, super returns have done an incredible job at accumulating wealth for retirees over a period that includes two major financial and economic crises. According to SuperRatings’ data, since July 2005, a starting balance of $100,000 would now be worth $235,877 for members in a balanced option. For a growth option this would be slightly higher at $236,235. A member with full exposure to Australian shares would have seen their balance growth to $254,188. In contrast, returns on cash would have seen the balance grow to only $157,939.

Important information: Any express or implied rating or advice is limited to general advice, it doesn’t consider any personal needs, goals or objectives.  Before making any decision about financial products, consider whether it is personally appropriate for you in light of your personal circumstances. Obtain and consider the Product Disclosure Statement for each financial product and seek professional personal advice before making any decisions regarding a financial product.