Introduction

Listed Investment Vehicles such as Listed Investment Companies and Trusts were under much scrutiny prior to the eruption of the current crisis to engulf markets. Casting our minds back only two months, the issue dominating this corner of the investment world revolved around stamping fees. While Treasury has been tasked to formulate a response, it arguably has more pressing matters such as devising strategies to keep the Australian economy from imploding from the COVID-19 shutdown and direction may be some time coming.

The vehicles themselves have endured a torrid time during the market turmoil with planned capital raisings cancelled and the usual performance issues that inevitably crop up. The correction has, however, exposed other fundamental issues with LIVs ranging from underlying portfolio valuations to how these products themselves should be used in a client context.

From frying pan to the fire

Financial markets tend to resolve issues by themselves—for good or for bad. Stamping fees are otherwise known as commissions associated with a capital raising for a LIV. With the ASX having cratered 36% in short order (Feb. 20 to March 23), and investors nursing losses it seems likely that interest in new product would be severely curtailed for the medium term at least.

This is probably even more so for the yield orientated strategies which had been crowding the ASX boards of late. The thirst for yield, and the hitherto relative calmness in markets, had emboldened investors to reach out across the fixed income risk curve into highly sophisticated territory like private debt. While uncertainty surrounding stamping fees may have given issuers of new products cold feet, the ensuing COVID-19 induced market correction has more than likely forced a re-evaluation of timelines—from 2021 if at all.

These assets had been the preserve of institutional investors given the underlying risks and the need to have a genuine long-term view in order to prosper. The LIV closed-end structures are well suited to these types of assets protecting value from any investor panic and forced redemptions. However, while the assets themselves are sheltered (setting aside any potential issues relating to their prospective quality and resilience) the LIV trades daily on the market and concerns/reduced conviction will be impounded. There is always the ever-present issue of misuse although not dissimilar to illiquid or volatile micro and small cap equities.

Lonsec researches 25 LIVs across Australian Equities, Global Equities, Fixed Income, Alternatives and Infrastructure (see Appendix 1 for the full list). All vehicles experienced steep drawdowns in traded value in excess of 10% during the window of February 20 to March 23 as seen in the following chart.

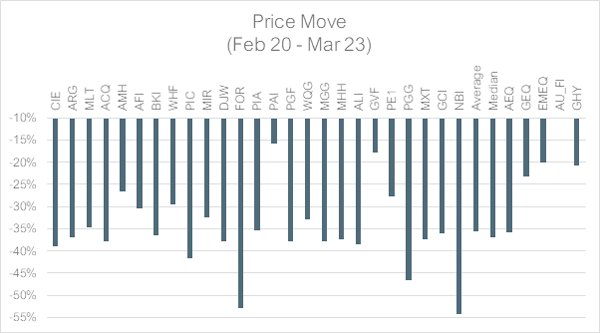
Source: Lonsec Research, Iress & Bloomberg | Stock Codes = See Appendix 1 | AEQ = S&P/ASX 200 TR Index AUD; GEQ = MSCI World ex Australia NR Index AUD; EMEQ = MSCI Emerging Markets NR Index AUD; AFI = Bloomberg AusBond Composite 0+ Year Index AUD; GHY = Bloomberg Barclays US Corporate High Yield (Unhedged)

Observations:

  • Most LIV prices have fallen in line with the broader Australian share market rather than proxies which more closely match the underlying assets within their portfolios. For instance, the Magellan Global Trust (MGG) price fell 38% while the benchmark global equities index only fell 23%—this represents a significant 15 percentage point difference. A common criticism of listed infrastructure and property is that these assets will tend to trade more like stocks (Australian stocks at that) and this chart suggests that this criticism may be extended to non-AEQ LIVs. This can have serious consequences for client portfolio management and rebalancing decisions.
  • Nine of the 25 LIVs fell less than the Australian market’s 36% of which six were Australian Equities focused vehicles.
  • Platinum Asia Investments Limited (PAI) stands out with only a -16% fall. This would seem counterintuitive given its heavy China focus (net 42.9% as at 29 Feb. 2020 to China and related) and a healthy dollop of Korean exposure (net 9.4% as at 29 Feb. 2020). However, China’s stocks have so far proven resilient to the economic fallout with the CSI300 down only 12% for the same period (following an earlier period of volatility in January/February 2020).
  • The only other LIV to have experienced such a cushioned fall (-18%) was Global Value Fund Limited (GVF). GVF uses a sophisticated strategy investing across a range of assets (including LIVs) as well as derivatives.
  • The most eyebrow raising moves have been seen with the Fixed Income LIVs although this would seem reasonable after digging a bit deeper. Fixed Income more generally has a safe haven status during period of stress albeit with well understood limitations. Sovereign bonds tend to be the safest (hence their general risk-free asset status) followed by highly rated corporate bonds. All the Fixed Income products under coverage (including PGG) invest across a range of riskier debt with mixed liquidity and quality in order to generate their high yields.
  • NB Global Corporate Income Trust (NBI) has the unenviable title of the worst price performer (-54%) of all listed products researched by Lonsec. Partners Group Global Income Fund (PGG) takes third spot (-47%) behind Forager Australian Shares Fund (-53%). NBI invests in global high yield bonds (GHY) which have been at the centre of concerns during this current crisis. GHY is also be considered as relatively more liquid than some of the other higher risk Fixed Income strategies in this space (e.g. private debt). NBI was also forced to cancel a c. A$340mn capital raising as a result of the market volatility. PE1 (withdrew ahead of close) and MXT (c. A$344mn) also cancelled capital raisings. Australian players MXT (-37%) and GCI (-36%) cannot escape the ignominy either.
  • The investors need to be mindful of however is that unlike equities, bonds/loans (in Fixed Income products) have a finite period and strategies should receive a return of their capital barring any significant wave of defaults (then the recovery rate becomes another factor, generally higher than equities). Moreover, while traded prices may fluctuate as investors react to news affecting the underlying investments, the closed-end nature of these vehicles supports the integrity of the investment vehicle as these LIVs are immune from redemption pressure. Then again, they may simply trade at deep discounts to NTA for an extended period.

Stale NTAs Blight Sector

Listed markets are great for price transparency and particularly well suited to forming views on industrial companies. Maybe less so when it comes to LIVs judging by the propensity of these vehicles to trade away from their NTA—sometimes significantly.

LIVs may have actively quoted prices but the frequency with which the value of their underlying investments is published can vary widely from daily, weekly, monthly or potentially longer. Clearly increased costs could be a limiting factor to increasing the frequency of audited values but producing daily estimates is not expected to be a material cost especially as this information should already be readily available within portfolio management systems.

Sadly, most Australian Equities LIVs report their NTA on a monthly basis and this stands in stark contrast to their Global Equities peers updating the market weekly. ARG has responded to the recent market turmoil by publishing weekly estimates. CIE, AMH, AFI, MIR and DJW have provided intra-month March updates. FOR and PIC meanwhile have been providing daily estimates for a long time and this should conceivably be the default model for all equities based LIVs.

Equity-based strategies are quite straightforward and typically uncomplicated with readily available asset prices. NTA updates on a monthly basis should no longer be accepted as general practice and these vehicles should improve their communications to investors. That vehicles with arguably less price transparent debt assets can confidently provide daily NTA estimates should give most of their peers cause for reflection on their own practices.

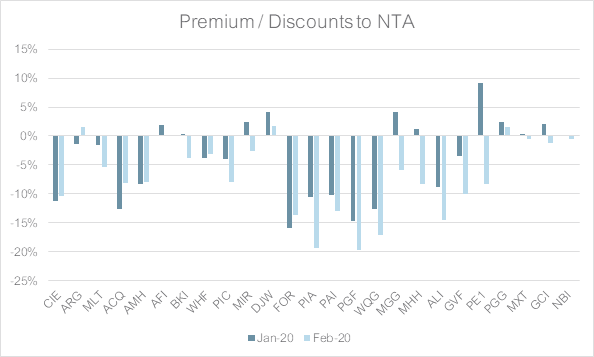
Source: Lonsec Research, Iress & Bloomberg | NTA = Pre-Tax NTA; Period = End of Month

The above chart highlights the premiums / discounts as at the end of January and February 2020. Clearly these values are very dated given the widespread price action post the 20th of February but nonetheless provide a useful discussion point. For instance, given the distress which has befallen credit markets globally and the significant price corrections experienced by the vehicles themselves, the very narrow discounts are expected to have noticeably widened. Using NBI as an example, this was trading at a 16% discount based on the March 26 NTA and March 27 closing price.

NBI observation also provides another lesson. Complicated strategies, or those with which the market has less familiarity or comfort, may nevertheless trade away materially from the underlying portfolio value. This is irrespective of the frequency with which NTA updates are provided. Moreover, not all assets can be valued more frequently either (e.g. direct property). Traded prices reflect future expectations and factors which impinge on an investor’s ability to derive these can weigh on market performance. In times of crisis, investors tend to flock not only to safety but simplicity too.

Conclusion

The treatment of stamping fees had been consuming the industry for many months before the Treasurer announced a review into the issue in January. This was before the world changed with COVID-19 and exposing some other deep-seated issues within the industry. For instance, why should a portfolio of liquid daily traded securities only provide NTA updates on a monthly basis? By comparison managed funds can strike prices daily on similar pools of assets. Moreover, debt focused LIVs are already confidently providing daily NTA estimates. Stale NTAs are expected to have a material impact on investor psychology and into the trading performance of these vehicles.

The other more pernicious issue relates to portfolio construction. A client portfolio built of non-equities based LIVs is likely to miss out on immediate and normally expected correlation benefits as many Lonsec researched ASX-listed LIVs traded in-line with the ASX and not with their underlying assets. Perhaps this issue should get at least equal attention than whether stamping fees should persist.

Our Head of Listed Equities, Peter Green, takes a look at the impact of COVID-19 on equity markets, and highlights some of the companies that have benefited from the COVID-19 outbreak, as well as the ones that have been most adversely affected.

Copyright © 2020 Lonsec Research Pty Ltd ABN 11 151 658 561 AFSL 421 445 (Lonsec). Lonsec receives fees from fund managers and financial product issuers for rating financial products using objective criteria and for services including research subscriptions. Lonsec’s fee and analyst remuneration are not linked to the rating outcome. Lonsec, its representatives and their associates may hold the financial product(s) rated. Warning: Past performance is not a reliable indicator of future performance. Any advice is General Advice based on the investment merits of the financial product(s) alone, without considering the objectives, financial situation and needs of any person. It is not a recommendation to purchase, redeem or sell the relevant financial product(s). Before making a decision read the PDS and consider your financial circumstances or seek personal advice. Disclaimer: Except for ratings, Lonsec gives no warranty of accuracy or completeness of information in this document, which is compiled from information from public and third-party sources. Opinions and ratings are reasonably held by Lonsec at compilation. Lonsec assumes no obligation to update this document after publication. Except for liability which can’t be excluded, Lonsec, its directors, officers, employees and agents disclaim all liability for any error, inaccuracy, misstatement or omission, or any loss suffered through relying on the document or any information. All rights reserved. This report may also contain third party material that is subject to copyright. To the extent that copyright subsists in a third party it remains with the original owner and permission may be required to reuse the material. Any unauthorised reproduction of this information is prohibited.

The listed income universe has not been immune to the recent market volatility that has engulfed global financial markets since the outbreak of the COVID-19 pandemic. Listed income securities covered by Lonsec have fallen 19% since early February 2020, giving investors very few places to hide. As the current market has made all too clear, hybrids are no guarantee of safety during a heavy market sell-off.

The price effect has been most severe for longer duration securities: those with more than five years to call have fallen around 25%, compared to 14% for those with less than two years to call.

Average price fall in Lonsec’s listed income universe

Source: Lonsec, Refinitiv

There have been three main drivers of this sharp fall in prices: the global rise in spreads, a lack of liquidity, and elevated risk of balance sheet stress for issuers.

The credit spreads of Listed Income securities have jumped since the pandemic was declared. As an example, looking at major bank AT1 securities with approximately five years to maturity, the average credit spread has widened from 275 bps to 783 bps.

This widening of credit spreads has not been confined to the Australian Listed Income market. The option-adjusted spreads of US Investment Grade and High Yield spreads, for instance, have jumped 334 bps and 652 bps respectively. The lift in credit spreads more broadly highlights the risk-off nature of the current market, with cash seen as the asset of choice and investors also concerned about rising default rates.

Hybrid trading margin versus Bank Bill Swap Rate

Source: Lonsec, Refinitiv

Further, the lack of liquidity in the secondary market has also exacerbated recent moves, with issue sizes for Listed Income securities ranging from as low as $268 million for AMP Capital Notes (AMPPA) to $3 billion for Commonwealth Bank (CBAPD).

While this may not appear small in comparison to the market capitalisation of some constituents in the ASX 200, the average trading volume is considerably less. For example, the historical weekly average trading volume for CBAPD is $10.3 million, and there are a number of smaller issues with associated poorer liquidity. This has increased to $17.3 million over the low level of turnover compared to the issue size of $3 billion, highlighting the impact of low liquidity on the market price movements of these securities over the short term. This is not unexpected, with investors in the current market seeking a much larger illiquidity premium to buy smaller hybrid issues.

The volatility inherent in the Listed Income universe at the moment is a reminder to investors of the equity-like characteristics of these instruments. When the market sells off, default risk and liquidity risk become more prevalent. It’s another cautionary tale during this period of market stress.

Banks face higher risk, but the probability of forced conversions remains low

Concerns about rising impairments for the big four banks has resulted in sharp share price declines in the sector, with share prices of the big four banks declining by around 36-48% since the start of the pandemic.

Given the perpetual nature of the AT1 securities and potential conversion triggers embedded in the structure of these issues, it is important to revisit the scenarios in which these Basel III compliant AT1 securities could convert into equity.

There are 3 possible scenarios in which conversion could occur:

  1. A common equity trigger event: Common Equity Tier 1 (CET1) capital is comprised mainly of directly issued qualifying ordinary shares, retained earnings, and accumulated other comprehensive income, which is adjusted based on regulatory requirements. A breach and conversion of listed income securities into common equity occurs when the risk-weighted assets of the issuer are equal to or less than 5.125% of CET1 capital.
  2. A non-viability event: This occurs when APRA declares the bank non-viable or considers that the bank would become non-viable without a public sector injection of capital.
  3. Mandatory conversion: If the securities are not redeemed at the first call date, they are left on the market for two additional years

It’s important to note that in the event of a conversion, holders will receive approximately $100 worth of ordinary shares per security, unless the issuer’s underlying shares price falls below a certain pre-determined level at which point a capital loss is likely to be incurred upon conversion. The price level is usually set at 20% of the issue date VWAP for each security.

The below table outlines the current CET1 capital levels of the major banks and the capital buffer above the conversion condition. Thanks to APRA’s “unquestionably strong” CET1 requirement of 10.5%, Australian banks are well capitalised and would need to experience a significant rise in bad debts before a conversion trigger is enforced. As at 31 December 2019, the major banks had reported capital buffers in the range of $22-30 billion in excess of the minimum capital requirements.

Regulatory Capital ANZ CBA NAB WBC
Common Equity Tier 1 (bn) 46.4 52.4 44 47.8
CET1 ratio 10.9% 11.7% 10.6% 10.8%
Common Equity Trigger buffer (bn) 24.6 29.4 22.7 25.1

Source: Company data. As at 31 December 2019

The volatility inherent in the listed income universe at the moment is a reminder to investors of the equity-like characteristics of these instruments. While the current volatility in security prices would be unsettling to investors, Lonsec believes that the risk of forced conversions into equity remains a very low probability event for the AT1 securities issued by the major banks. Lonsec continues to recommend a ‘hold-to-maturity’ approach for these securities. However, we also urge investors not to allocate to hybrid securities as part of their defensive bucket in their asset allocations.

If you thought the coronavirus put an end to geopolitical maneuvering, you probably haven’t checked in on the oil market.

The WTI spot price has fallen from its most recent peak of around US$74 per barrel in late 2018 to around $32 as at the end of last week. The price was around $52 at the start of February, reminding us of the astonishing pace at which oil prices can move (especially on the downside).

The coronavirus has come along as a negative demand-driven catalyst to enforce this via sharply reduced prices, at least for the short term.

WTO crude oil spot price (US$)

Source: Bloomberg

With annual global supply and demand of around 99.5 million barrels of oil per day (MMBOPD), the movement of just 2 MMBOPD on either side, from historical observation, can have dramatic effects on the spot price. Some analysts are forecasting a 4 MMBOPD drop in demand in the February to April period – and potentially longer – due to the coronavirus and associated economic fallout.

OPEC have proposed an additional 1.5 MMBOPD cut if Russia joins in, but so far Russia has not agreed, in part causing a large drop in oil prices and leaving the market to ponder if the loose relationship between Russia and OPEC is over. There is an existing 2.1 MMBOPD cut to official supply levels already in place for OPEC+, which consists of the 14 OPEC members plus 10 non-OPEC producers (the so-called Vienna group led by Russia).

As the world’s attention is captured by the coronavirus, a repeat of 2015 is taking place in the background. On the back of the high oil prices that prevailed from 2010 to 2014, US shale producers increased their production to record levels, contributing to overall US oil output of 9.6 MMBOPD – up from approximately 5 million in 2009 – causing OPEC market share to fall from 34% to 31%.

US oil production (million barrels per day)

Source: Lonsec

When that level of supply started to weigh on inventories, prices started to fall. Previously, OPEC has stepped in to cut their output and stabilise prices, but this time it refused, arguing it was the US producers that caused the excess supply problem and they weren’t going to cut back voluntarily.

Lessons from 2015

This inaction from OPEC had a severe impact on Australian produces like Santos (STO) and Origin Energy (ORG), which had amassed large amounts of debt after investing in LNG plants, and were then forced to embark on dilutionary equity raisings and dividend cuts. BHP wrote off billions of dollars from its misguided acquisition of shale assets in 2012, back when oil prices were high, and only Beach Energy (BPT) and Woodside Petroleum (WPL) were able to take advantage of the situation and buy up assets at low values. Of course, WPL didn’t quite pull this off in the end and were forced to write down their Kitimat LNG acquisition.

As oil prices fell sharply from late 2014 and 2015, some US shale producers became uneconomic and exploration rig counts declined, leading to US production falling back to a low of 8.5 MMBOPD in September 2016. The cycle repeated itself with oil prices rising in response to this decline in output, combined with ongoing modest but positive global growth thanks to the Chinese economy.

As oil prices began their march back up to US $70 per barrel in 2018, US shale producers were once again encouraged to increase production, this time at an enforced cost base below that of the previous cycle. With the added support of a pro-business government, output rose to 13.1 MMBOPD by February 2020.

This time, however, Russia has had enough. After making some production cuts last year as part of the OPEC+ initiative, further cuts hand US producers an undeserved and unnecessary advantage. After Russia’s walkout, markets believe we could be entering a period of sustained low and volatile oil prices, as the world waits for US shale producers to be forced to cut back production once again.

Lonsec’s view

Lonsec has generally taken a cautious view on holding energy stocks in our model portfolios, partly due to the risks of the events described above, which tend to come in all-too-regular cycles. We avoided the trap in 2015 (although others were not so lucky) and have maintained a healthy degree of caution since.

Unless OPEC and Russia can come to some sort of agreement, oil markets are set for further pain. Given the magnitude of the price falls, opportunities may present themselves for those seeking to take advantage of the cyclical nature of energy businesses, but this must be done with an understanding of the history and inherent risks and volatility within the sector.

As Lonsec moves to hold more regular investment committee meetings as market volatility reaches intense levels, it’s important to consider both risk mitigation strategies as well as longer-term opportunities that could add value to portfolios as we move through the cycle.

At a security level, STO has gone from a semi-distressed situation, with multiple capital raisings and a dividend cut in 2016, to a much stronger company now under very good management. Still, after reaching a share price high of $9.00 on 15 January 2020, it has declined 25.5% over the last seven weeks to $6.70 per share, highlighting the potential volatility in the sector.

STO share price

Source: Lonsec

WPL appears to have good defensive characteristics compared to its peers, but its investment pipeline over the next five years includes large outlays on projects with a low internal rate of return. We decided to remove WPL from our core portfolio given the high level of volatility in both the stock and oil price, and we also questioned some of the projects the business has acquired recently.

OSH is in real trouble and is the most levered play – it has higher risk of capital management initiatives compared to its peers. Both STO and BPT have began cutting capex.

The coronavirus outbreak and the dramatic fall in oil prices were not predicable events, but Lonsec’s focus now is on diversifying our portfolios from a bottom-up perspective while looking for opportunities to take a more positive position in certain securities as valuations become more attractive. These conversations will take place on a regular basis, including as part of our formal investment committee meetings, which are now taking place monthly and as required as market volatility plays out.


Household consumption accounts for 56% of Australia’s GDP, making it the main engine of growth for the economy. When households cut back, the economy suffers, with flow-on effects to business and government in the form of lower sales and taxation revenue.

As consumers start making dramatic changes to their daily habits due to the coronavirus, what is the likely impact on discretionary spending and, by extension, GDP growth over the next quarter?

Based on the ABS national accounts data, rent and dwelling services is the largest component of consumer spending, representing 11.5% of GDP. This is followed by recreation and culture at 5.6%, food at 5.2%, and hospitality at 3.9%.

Australia’s consumption as a % of GDP

Source: ABS, Heuristic

Some of these components of household spending are more cyclical – that is, they’re more sensitive to changes in the economic environment. The table below, prepared by Heuristic, shows each sector’s growth during the 1990s recession when GDP dropped 1.4% over four quarters. For example, it shows that purchases of new cars declined 17.8%, while food rose 1.1%.

The second and third columns show the average quarterly growth of each component in ‘recession’ and ‘non-recession’ regimes. This gives us an idea of which sectors might be more ‘discretionary’. For example, communications may have grown 2.6% in the 90’s recession, but growth outside of recessions was 7.8% per quarter. The final two columns show the share of each component of overall consumption and GDP.

We estimate that 40% of consumption is ‘discretionary’, and therefore at risk in the current environment, at least for the next one or two quarters. Note that the ABS’s retail sales data is ‘discretionary’ and represents around 30% of consumption. We estimate discretionary spending is around 22% of GDP. Some of these sectors (such as hospitality) are experiencing declines of 50% or more, while others may experience declines of 10%. Other sectors are experiencing significant increases in the short term (such as food).

Given the nature of the coronavirus pandemic, transport services are unlikely to lift as it did in the previous recession, while recreation and culture will suffer more than in the last recession.

Spending on the discretionary sectors could decline by at least 17% over the quarter. This would force overall consumer spending down some 6–7%. Once we allow for an imported component of 20%, the potential near-term impact on GDP could be in the vicinity of 3%. Chinese retail sales data released earlier in the week revealed a 20.5% decline over January and February due to business and industry shutdowns.

Hopefully we start to see positive effects from fiscal stimulus, along with the rate cuts and other measures announced by the RBA, although this won’t be evident until the June quarter. The good news, if there is any, is that markets have likely already priced in a significant hit to GDP, meaning there shouldn’t be much of a reaction when the next GDP release comes along.

Consumption during recessionary and non-recessionary periods

Source: ABS, Heuristic

Diversification worked well in the last week of February 2020 as equity markets sold off in response to the rapidly escalating COVID-19 pandemic. Bond markets, notably the highest quality and safest bonds (government bonds and high-quality investment grade credit) rose in price, providing a cushioning impact to multi-asset portfolios. Bonds, as expected, provided good diversification benefits in what was a typical ‘flight to quality’ episode.

Roll forward to March and we are now seeing a very different market – one that is evolving rapidly. Most notably, bond yields have been rising, meaning prices have been falling. What’s going on? Are bond markets looking through the current bad news and pricing in an economic recovery? Usually yields rally in response to positive economic news, don’t they?  Unfortunately, this is not the case. Rising yields and falling equity markets are not a good combination for multi asset investors because it means correlations have risen.

10-year government bonds yields began rising rapidly in March

Source: Bloomberg, Lonsec

What we are seeing and hearing from our fund managers is that there are severe liquidity issues in bond markets. Our fixed income managers are reporting limited liquidity in what are usually the most liquid securities: government bonds. There are simply very few buyers of these assets and many sellers. Adding to the problem is the widening pipeline of bonds, with more supply on the way courtesy of government fiscal stimulus plans, which will be funded via new bond issuance. The impact of increased supply is, of course, to lower prices.

General deleveraging by investors is clearly taking place. Investors are selling any liquid assets they can – including bonds – to fund redemptions, margin calls, or simply to move into cash. Some of our fixed income managers have been taking profit, trimming their positions after building in additional duration to their portfolios in the second half of last year. Parts of the market are blaming hedge fund sellers (always the first and easiest to blame) and some are blaming social distancing, which is making it more difficult for bond traders to execute their trades working from home.

At the same time, we’ve seen companies drawing down their entire credit lines at banks in efforts to shore up their balance sheets and make it through the next few weeks, months, or quarters with little to no revenue coming in. Access to cash (or credit) is essential to keeping these businesses alive and through to the other side of this shutdown. Bills, interest payments and fixed costs still need to be serviced. Companies are hording cash, and those that held government bonds as part of their liquidity reserves are selling. The demand for liquidity has been great, and cash – or ‘cashflow’ – is certainly king in this environment.

In efforts to avoid a repeat of the global financial crisis, central banks are throwing everything they’ve got at this, flooding markets with liquidity to ensure credit markets continue to function and companies have access to funding. Stabilizing the government bond curve (off which all credit securities are priced) is a critical first step for a functioning credit market.

Here in Australia, the RBA announced a number of measures, including dropping the cash rate to 0.25%, providing strong forward guidance, introducing a term funding facility, and announcing its intention to buy government bonds across the curve to ensure the 3-year yield remains low at 0.25%. We expect a large buyer (with deep pockets) entering the market could go some way towards stabilizing bond yields. On the back of the RBA announcement, yields on the 3-year bond dropped from 0.62% to 0.35%. This is a good first step, however we will be monitoring markets closely to see if it is enough. Thankfully, we think the RBA still has more left in its arsenal if required.

Generally, we expect ETFs to trade close to their net asset value (NAV) due to the redemption mechanism that allows authorised participants to arbitrage between the ETF shares and the underlying shares.

However, in this recent period of heightened volatility and dislocation due to COVID-19, a number of ETFs have been trading at significant discounts, especially fixed income ETFs with large allocations to credit and high yield.

At the market’s close on 18 March, some of these discounts had narrowed to a small degree, but still ranged from -2% to -8%. The main issue is been the disruption to price discovery as credit markets have come under heightened stress, especially in the wake of the heavy falls in oil prices.

On the global equity ETF side, there has also been evidence of enhanced spreads immediately after US futures markets going into ‘limit down’ after breaching the -5% limit. The reason is that, due to time zone differences, market makers need to use futures markets as proxies when regional markets are closed and the ASX is open.

Without the S&P 500 futures markets to use as a proxy, market makers cannot effectively hedge their risk premia and need to use less-than-perfect proxies, exposing them to basis risk. This then narrows as regional markets open.

As a general observation, though, it’s fair to say that the local ETF market is holding up reasonably well in what has quickly turned into a severe market dislocation event. Markets such as these also shine a light on the golden rule for ETF liquidity, which is that the more liquid the underlying portfolio, the greater the efficacy of market making activities.

For example, cash and enhanced cash ETFs (such as BILL, AAA) are trading at NAV and have had basis point spreads, and large ASX ETFs have also been trading very well from a spread perspective. Importantly, while it is hard at present to gauge how long markets will stay volatile, the discounts and spread volatility should ease as markets normalise (whenever that might be).

The final point is that T+2 settlements for ETFs are very valuable in a ‘cash is king’ market such as this. This, along with the efficiency in implementing trades, has no doubt been behind the strong trading volumes we have seen, especially in larger ETFs.

Sadly, the title of our Symposium now seems all too prophetic.

Following the advice of the Australian government and health authorities, we’ve decided that the best option is to cancel the event.

Over 900 people were already registered to attend, but we all need to help ‘flatten the curve’ and prevent the spread as much as we can.

At this stage we’re not planning to re-schedule, but we’re working to make the content available to everyone who registered. We’ll provide further information on how to access these materials as it becomes available.

Who knows, we may all have plenty of time at home to watch and read!

We’d like to thank our event sponsors, AllianceBernstein, Fidante, Fidelity, Investors Mutual, Legg Mason, Pendal Group, Schroders and Talaria, and we look forward to continuing to work with them to keep you informed.

Feel free to put the Lonsec Symposium 2021 (Thursday 29th April 2021) in your diaries, and we look forward to seeing you all there, if not before.

The coronavirus has had a major impact on equity markets in the past few days, and the uncertainty surrounding looks set to continue for some time. Peter Green, our Head of Listed Products, looks at the stocks that have been directly and indirectly affected, as well as some of the reporting season’s best and worst performers.

It has been a turbulent start to the year with Australia beginning the recovery process from the tragic bushfires followed by the threat of a global pandemic with cases of the coronavirus increasing across the globe. Despite these events markets did not flinch in January, with equity markets generating strong returns for the month as liquidity conditions continue to be supportive of markets.

If we look at previous incidents of viral outbreaks, such as SARS in 2003 and H1N1 (swine flu) in 2009, short-term corrections were within the range of 5% to 15%. These corrections were followed by strong rebounds. The consensus view is that global growth will be down in the first quarter of the year as a result of the coronavirus with the key variable being how long the threat of the virus persists.

While history is a useful guide in this case, it must be said that the effect of this epidemic is likely to be greater given China’s dominant presence in the global economy, given the faster spread of the disease and the measures taken to combat it. The extended closure of Chinese industry, restrictions on people movement, disrupted supply chains, declines in key commodity prices, bans on Chinese travel and the flow-on effect to confidence will severely hamper growth in China and the countries and regions most heavily reliant on China.

While at the time of the SARS outbreak China accounted for around 9.0% of global output on a PPP basis, it now accounts for 19%, and this proportion is only likely to increase in coming years, according to the IMF. China accounts for 18% of global tourism spending (up from 4.0% in 2008) while overall tourism (domestic and global) spending accounts for more than 10.0% of Chinese GDP and has been contributing almost 1.5% to annual GDP growth. To place China’s emergence on the global stage into perspective, in 2003 there were 20 million Chinese overseas visits and in 2018, 150 million. The Chinese economy accounted for about 30% of global growth in 2019. So a drop in Chinese GDP growth to 5.0% for the year, assuming the virus is contained within a short period, would detract 0.2–0.3% from global growth.

China now accounts for around 19% of global output

Source: IMF, Lonsec

From an Australian equities perspective, we are likely to see earnings outlook downgrades across a number of sectors, at a time of elevated valuations and a sub-par growth outlook. While earnings across the Healthcare, Consumer Staples and Infrastructure sectors should be relatively immune to recent events, based on Lonsec’s initial estimates, 2020 earnings estimates for the Resources (Energy, Iron Ore and Copper), Tourism/Travel and Consumer Discretionary sectors are likely to see significant one-off earnings revisions, capturing the impact of the coronavirus outbreak and the recent bushfires across Australia. However, such downgrades are unlikely to impact the long-term investment thesis for most companies and should be regarded as short-term headwinds, reflecting a series of one-off unfortunate events.

From an asset allocation perspective, Lonsec’s multi-asset portfolios remain very well diversified with only a small direct exposure to Chinese equity and bond markets. Consequently, our current focus is on the flow on effects that a sustained slowdown in Chinese growth may have on the domestic growth outlook given our close trading ties. As previously noted, our valuation indicators for Australian equities remain elevated, making them susceptible to a pullback should Chinese authorities’ attempts to stabilise growth fail. We have maintained our slight underweight positions in both global and Australian equities for the time being, however continue to monitor events closely.

While there is a high degree of uncertainty regarding the coronavirus outbreak, Lonsec notes that this event does pose a long “tail risk” for global markets should the outbreak get out of hand. These factors make it a challenging period for investors, where factors other than fundamentals are having a material impact on the trajectory of markets. In such an environment, we believe selective valuation opportunities will present themselves for long-term investors, however ensuring that your portfolio is diversified will be very important in navigating an increasingly volatile market environment.


Important information: Any express or implied rating or advice is limited to general advice, it doesn’t consider any personal needs, goals or objectives.  Before making any decision about financial products, consider whether it is personally appropriate for you in light of your personal circumstances. Obtain and consider the Product Disclosure Statement for each financial product and seek professional personal advice before making any decisions regarding a financial product.