In this video, Dan Moradi, Portfolio Manager for Listed Products, provides an update on the Australian equity market following an interesting August reporting season and takes an in-depth look at how sectors and companies performed.

Similar to FY21, this year we had a challenging backdrop heading into the second half of the year, with the ongoing business disruptions caused by Covid, particularly with the Omicron wave that surged around Christmas. But given these challenges, what we saw during the reporting season from company results was pleasing, reflecting a stable operating environment and demonstrating that the underlying fundamentals of our domestic market remains strong despite the ongoing market volatility. Labour costs, labour constraints, price rises, and inventory management dominated discussions and outlook statements over the reporting period. To-date the market seems to be navigating these headwinds relatively well and we’ve seen many companies passing on the additional costs to end consumers to protect their profit margins.


The information in this video is prepared by Lonsec Investment Solutions Pty Ltd ABN 95 608 837 583 (LIS, we, us, our), a Corporate Authorised Representative (CAR) No. 1236821 of Lonsec Research Pty Ltd ABN 11 151 658 561, AFSL No. 421445 (Lonsec Research). Any express or implied rating or advice presented in this video is limited to general advice and based solely on consideration of the investment merits of the financial product(s) alone, without taking into account the investment objectives, financial situation and particular needs (“financial circumstances”) of any particular person. Before making an investment decision you must consider your financial circumstances or seek personal financial advice on its appropriateness. Read the Product Disclosure Statement for each financial product before making any decision about whether to acquire a financial product.

Past performance is not a reliable indicator of future performance. No representation, warranty or undertaking is given or made in relation to the accuracy or completeness of the information presented in this video, which is drawn from information not verified by LIS. This video may also contain third party material that is subject to copyright. To the extent that copyright subsists in a third party it remains with the original owner and permission may be required to reuse the material.

The information contained in this video is current as at the date of publication. Financial conclusions, ratings and advice are reasonably held at the time of publication but subject to change without notice. LIS assumes no obligation to update this document following publication. This video is not intended for use by a retail client or a member of the public and should not be used or relied upon by any other person. This video is not to be distributed without the consent of LIS. Except for any liability which cannot be excluded, LIS and Lonsec Research, their directors, officers, employees and agents disclaim all liability for any error or inaccuracy in, misstatement or omission from, this video or any loss or damage suffered by the reader or any other person as a consequence of relying upon it. Copyright © 2022 Lonsec Investment Solutions Pty Ltd.

You may not reproduce, transmit, disseminate, sell or publish this video without our written consent.

Can lifecycle MySuper options really deliver a Magic Pudding or is it all just pie in the sky?

Experience working with members and employers suggests a real lack of understanding of the difference in approach between a lifecycle product and the alternative ‘single strategy’ product type.  Yet in a future environment where legislation such as Your Future, Your Super is designed to encourage members to compare performance and determine whether they should potentially change funds, it is fundamental that members should understand and be able to compare the two product types. Particularly, since 37% of the 75 MySuper products registered with APRA as at 31 March 2022 were designated as ‘lifecycle’ products.

The value proposition of a lifecycle product is to place members in a lower risk strategy as they approach retirement, while still maintaining overall lifetime return by investing more aggressively during the earlier years of the member’s career. A fair comparison of lifecycle and single strategy products must therefore take into account both return over a typical member’s lifetime and the relative risk position at or near retirement.

Measuring lifetime investment performance

We have determined a methodology for calculating an ‘Equivalent Lifetime Return’ (ELTR) for MySuper products.

For a single strategy option, the ELTR is simply the annualised return for the option over the stated period (e.g. 5 years to 30 June 2022).

For a lifecycle strategy, the ELTR is the annualised return over a member’s lifetime from age 20 to 67 using each lifecycle stage option’s returns over the selected period, applied to the years during which the member would be invested in each lifecycle stage. For more detail and an example, refer to the Appendix to this article.

The ELTR as defined is designed to be calculated from the normal performance data published by super funds and collected by SuperRatings.  Other methods could be used, but this definition is consistent with the use of long-term average rates of return which forms the basis for current performance comparisons across the industry.

Evaluating Risk at Retirement

There are several possibilities for measuring the portfolio risk of an investment option, including Growth / Defensive allocation and standard deviation of return.  We have opted to use the ‘Standard Risk Label’ published by funds as part of their MySuper Dashboards.  Despite some known shortcomings, the Standard Risk Measure has the virtue of being developed within the superannuation industry and being legislated for this purpose.  In our comparisons, ‘Risk at Retirement’ is the Standard Risk Measure for the investment portfolio that would apply to a member at age 67 under a specific MySuper product.  For single strategy MySuper products, it is simply the Standard Risk Measure for that strategy.  For lifecycle products, it will typically be the lowest risk option in the product’s ‘glidepath’.

Product sample set

For this comparison, we included only registered MySuper products for which at least 5 years of historical performance is available.  Returns were calculated to 30 June 2022.  There were 45 products in total, of which 15 were classified as ‘lifecycle’ structures.

Top performers by ELTR

The following table summarises the Top 10 performing MySuper products by Equivalent Lifetime Return (ELTR):

Rank Fund Name Structure ELTR Risk at Retirement
1 Qantas Super Lifecycle 7.94% Medium to High
2 Hostplus Single strategy 7.76% Medium to High
3 Aware Super Lifecycle 7.45% Medium
4 AustralianSuper Single strategy 7.28% High
5 HESTA Single strategy 6.75% High
6 Vision Super Single strategy 6.71% High
7 UniSuper Single strategy 6.65% High
8 Lutheran Super Single strategy 6.60% Medium to High
9 Cbus Single strategy 6.55% Medium to High
10 VicSuper Single strategy 6.46% High

Perhaps as expected, the list is dominated by single strategy products with High or Medium to High risk profiles.  Qantas Super and Aware Super were the only funds with lifecycle products to make the Top 10, and Aware Super was the only product that was able to put retiring members into a ‘Medium’ risk position at age 67.

Above-median performers by Risk at Retirement

Advocates of lifecycle products might contend that their objective is not necessarily to be in the Top 10 performers, especially if it involves a higher risk categorisation at retirement.  Outperforming the median return might be a more realistic and consistent goal.

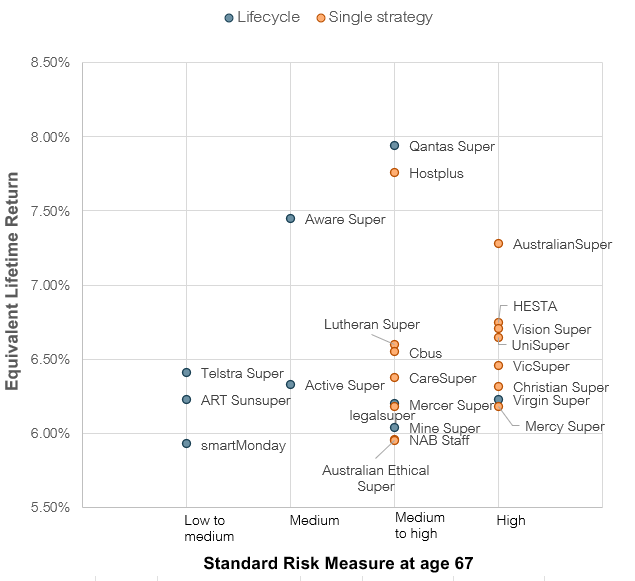
The median ELTR for our sample set was 5.92% per annum.

The chart below displays the 23 products which exceeded the median ELTR by risk at retirement category. We found that 9 out of 15 (60%) lifecycle products achieved an ELTR greater than the median, while 14 out of 30 (47%) single strategy products exceeded this benchmark.

Evidently, several lifecycle products have been able to deliver above-median performance (measured over a member’s lifetime) whilst placing their members in a lower-risk position close to retirement.

Conclusions

The aim of this research was to demonstrate a means of fairly comparing different types of MySuper products and assessing whether lifecycle products are able to deliver on their promise.  Our main conclusion is that yes, there are lifecycle products that are able to deliver above-median lifetime performance whilst achieving their risk objectives near retirement.  Nevertheless, the top performing products remain predominantly single strategies that are able to maintain exposure to higher returning assets (but with a higher risk classification) up until retirement.

The next questions are of course – how important is ‘de-risking’ near retirement for ‘disengaged’ members?  Is there such a thing as a ‘disengaged’ member approaching retirement?  Is a ‘one-size fits all’ approach to retirement risk suitable to address the differing needs of retirees?  A secondary aim of this research is to open up these more fundamental questions in the context of measurable objectives.  If we have achieved this objective, we may indeed have baked a magic pudding.

Appendix:

  1. Calculating the ELTR

The return shown in the MySuper performance tables is the Equivalent Lifetime Return (ELTR) calculated by SuperRatings for the 5 year period ending 30 June 2022. The model can determine the ELTR using either returns over 1, 3, 5, 7, 10, 15 or 20 years. The reason we haven’t focused on simply compounding 1-year returns is due to the volatility that we see over the short term.

For a single strategy option, the ELTR is simply the annualised return for the option over the stated period (e.g. 5 years to 30 June 2022).

For a lifecycle strategy, the ELTR is the annualised return over a member’s lifetime from age 20 to 67 using each lifecycle stage option’s returns over the selected period, applied to the years during which the member would be invested in each lifecycle stage. For example, if a lifecycle strategy has (say) a High Growth option applying up to age 50, then a Balanced option from age 50 to 60 and then a Capital Stable option applying until retirement, the ELTR would be calculated by compounding 30 years of the High Growth option’s returns together with 10 years of the Balanced option’s returns and 7 years of the Capital Stable option’s returns, converted to an average annualised rate of return over the entire 47-year period.

One challenge for this approach is the fact that there is currently insufficient data to provide 40 or more years of actual historical returns for each component investment option.  To overcome this issue, the ELTR calculation is based on published average returns over a shorter time period, such as 1 year, 3 years, 5 years, 7 years, 10 years, 15 years or 20 years. In each case, the average return over the stated period is used as a proxy for each lifecycle stage’s return during the appropriate period of membership.  For example, if the stated period is 5 years, a time-series of returns is developed for the member’s lifetime with the 5-year return used as the proxy return at each age i.e. the High Growth option 5-year return is used as the return for the member from ages 20 to 50, the Balanced option 5-year return then applies for ages 50 to 60 and finally the 5-year return for the Capital Stable option is applied from ages 60 to 67. These returns are then compounded over the 47 years and converted to an average annualised rate of return.

  1. Risk at Retirement

The measure of Risk at Retirement used for this analysis was determined by the product’s investment strategy at an assumed retirement age, which is age 67 for the purposes of this article.  The risk metric is the Standard Risk Label at age 67 as disclosed in the product’s Product Dashboard.

It has been a challenging period for multi-asset investors with both equity and bond markets recording some of the worse starts to a year in decades. Global equity markets fell significantly over the quarter and domestically the ASX 300 index has fallen more than 10% since the start of the calendar year. However, what has been most damaging to balanced portfolios has been the significant losses experienced in the bond markets. Bond market indices are down 10%, as persistent and high inflation has seen bond yields rise sharply. The defensive part of many investor portfolios failed when it was needed most.

Deanne Baker explains how the Multi-Asset portfolios are positioned to best navigate through the current challenging environment.


The information in this video is prepared by Lonsec Investment Solutions Pty Ltd ABN 95 608 837 583 (LIS, we, us, our), a Corporate Authorised Representative (CAR) No. 1236821 of Lonsec Research Pty Ltd ABN 11 151 658 561, AFSL No. 421445 (Lonsec Research). Any express or implied rating or advice presented in this video is limited to general advice and based solely on consideration of the investment merits of the financial product(s) alone, without taking into account the investment objectives, financial situation and particular needs (“financial circumstances”) of any particular person. Before making an investment decision you must consider your financial circumstances or seek personal financial advice on its appropriateness. Read the Product Disclosure Statement for each financial product before making any decision about whether to acquire a financial product.

Past performance is not a reliable indicator of future performance. No representation, warranty or undertaking is given or made in relation to the accuracy or completeness of the information presented in this video, which is drawn from information not verified by LIS. This video may also contain third party material that is subject to copyright. To the extent that copyright subsists in a third party it remains with the original owner and permission may be required to reuse the material.

The information contained in this video is current as at the date of publication. Financial conclusions, ratings and advice are reasonably held at the time of publication but subject to change without notice. LIS assumes no obligation to update this document following publication. This video is not intended for use by a retail client or a member of the public and should not be used or relied upon by any other person. This video is not to be distributed without the consent of LIS. Except for any liability which cannot be excluded, LIS and Lonsec Research, their directors, officers, employees and agents disclaim all liability for any error or inaccuracy in, misstatement or omission from, this video or any loss or damage suffered by the reader or any other person as a consequence of relying upon it. Copyright © 2022 Lonsec Investment Solutions Pty Ltd.

You may not reproduce, transmit, disseminate, sell or publish this video without our written consent.

We are currently in an environment we haven’t seen since the mid-1990s, of extremely high inflation and low growth, which has surprised many investors and has been damaging for those that have a low tolerance to risk, such as retirees. Despite negative returns, and while we haven’t been able to avoid the losses entirely, the Retirement portfolios have significantly outperformed the peer group benchmark, protecting retirees. The portfolio also delivered top quartile returns with less risk than the peer group over the 12 months to June 2022. In terms of total return, the portfolio remains comfortably above its Cash plus 2.4% objective over the 4-year recommended investment timeframe.

True to our investment philosophy and approach, having true diversification in the portfolios, being dynamic in how we positioned the portfolio this year, investing in high-quality strategies, and having a strong risk control, have paid off.


The information in this video is prepared by Lonsec Investment Solutions Pty Ltd ABN 95 608 837 583 (LIS, we, us, our), a Corporate Authorised Representative (CAR) No. 1236821 of Lonsec Research Pty Ltd ABN 11 151 658 561, AFSL No. 421445 (Lonsec Research). Any express or implied rating or advice presented in this video is limited to general advice and based solely on consideration of the investment merits of the financial product(s) alone, without taking into account the investment objectives, financial situation and particular needs (“financial circumstances”) of any particular person. Before making an investment decision you must consider your financial circumstances or seek personal financial advice on its appropriateness. Read the Product Disclosure Statement for each financial product before making any decision about whether to acquire a financial product.

Past performance is not a reliable indicator of future performance. No representation, warranty or undertaking is given or made in relation to the accuracy or completeness of the information presented in this video, which is drawn from information not verified by LIS. This video may also contain third party material that is subject to copyright. To the extent that copyright subsists in a third party it remains with the original owner and permission may be required to reuse the material.

The information contained in this video is current as at the date of publication. Financial conclusions, ratings and advice are reasonably held at the time of publication but subject to change without notice. LIS assumes no obligation to update this document following publication. This video is not intended for use by a retail client or a member of the public and should not be used or relied upon by any other person. This video is not to be distributed without the consent of LIS. Except for any liability which cannot be excluded, LIS and Lonsec Research, their directors, officers, employees and agents disclaim all liability for any error or inaccuracy in, misstatement or omission from, this video or any loss or damage suffered by the reader or any other person as a consequence of relying upon it. Copyright © 2022 Lonsec Investment Solutions Pty Ltd.

You may not reproduce, transmit, disseminate, sell or publish this video without our written consent.

It has been a challenging period for multi-asset investors with both equity and bond markets recording some of the worse starts to a year in decades. Global equity markets fell significantly over the quarter and domestically the ASX 300 index has fallen more than 10% since the start of the calendar year.

ESG and sustainable portfolios in general have felt the pain more acutely given the wide dispersion seen in sector returns and the Lonsec Sustainable portfolios were no exception. The portfolios have had a difficult quarter, lagging the peer group benchmark by some margin. Over the quarter, Dynamic Asset Allocation added value in the Balanced risk profile which benefited most from our underweight position in Fixed Income. In the higher risk profiles, DAA was flat to slightly negative as our overweight position in real assets more than offset the gains made in Fixed Income.

Looking ahead, our Sustainable positions remain diversified in order to be resilient to further market volatility. We continue to monitor developments regarding inflation, monetary policy and the global economy and we will adjust our portfolios if necessary to navigate through the challenges ahead.


The information in this video is prepared by Lonsec Investment Solutions Pty Ltd ABN 95 608 837 583 (LIS, we, us, our), a Corporate Authorised Representative (CAR) No. 1236821 of Lonsec Research Pty Ltd ABN 11 151 658 561, AFSL No. 421445 (Lonsec Research). Any express or implied rating or advice presented in this video is limited to general advice and based solely on consideration of the investment merits of the financial product(s) alone, without taking into account the investment objectives, financial situation and particular needs (“financial circumstances”) of any particular person. Before making an investment decision you must consider your financial circumstances or seek personal financial advice on its appropriateness. Read the Product Disclosure Statement for each financial product before making any decision about whether to acquire a financial product.

Past performance is not a reliable indicator of future performance. No representation, warranty or undertaking is given or made in relation to the accuracy or completeness of the information presented in this video, which is drawn from information not verified by LIS. This video may also contain third party material that is subject to copyright. To the extent that copyright subsists in a third party it remains with the original owner and permission may be required to reuse the material.

The information contained in this video is current as at the date of publication. Financial conclusions, ratings and advice are reasonably held at the time of publication but subject to change without notice. LIS assumes no obligation to update this document following publication. This video is not intended for use by a retail client or a member of the public and should not be used or relied upon by any other person. This video is not to be distributed without the consent of LIS. Except for any liability which cannot be excluded, LIS and Lonsec Research, their directors, officers, employees and agents disclaim all liability for any error or inaccuracy in, misstatement or omission from, this video or any loss or damage suffered by the reader or any other person as a consequence of relying upon it. Copyright © 2022 Lonsec Investment Solutions Pty Ltd.

You may not reproduce, transmit, disseminate, sell or publish this video without our written consent.

Equity markets ended the financial year on a negative note in June, with the S&P/ASX 200 falling around 9% to finish the quarter down 12%. This drove the ASX 200 index as a whole down 6.5% for FY22. Global equities also fell significantly over the quarter, but Australian investors received some protection on unhedged investments from a 6 cent (8%) depreciation in the Australian Dollar. Rising inflation and subsequent rising interest rates were the main factors causing these negative returns.

Dan Moradi, Portfolio Manager for Listed Products, explains in detail what caused these negative returns and provides an update on the portfolios’ latest performance, positioning and outlook.


The information in this video is prepared by Lonsec Investment Solutions Pty Ltd ABN 95 608 837 583 (LIS, we, us, our), a Corporate Authorised Representative (CAR) No. 1236821 of Lonsec Research Pty Ltd ABN 11 151 658 561, AFSL No. 421445 (Lonsec Research). Any express or implied rating or advice presented in this video is limited to general advice and based solely on consideration of the investment merits of the financial product(s) alone, without taking into account the investment objectives, financial situation and particular needs (“financial circumstances”) of any particular person. Before making an investment decision you must consider your financial circumstances or seek personal financial advice on its appropriateness. Read the Product Disclosure Statement for each financial product before making any decision about whether to acquire a financial product.

Past performance is not a reliable indicator of future performance. No representation, warranty or undertaking is given or made in relation to the accuracy or completeness of the information presented in this video, which is drawn from information not verified by LIS. This video may also contain third party material that is subject to copyright. To the extent that copyright subsists in a third party it remains with the original owner and permission may be required to reuse the material.

The information contained in this video is current as at the date of publication. Financial conclusions, ratings and advice are reasonably held at the time of publication but subject to change without notice. LIS assumes no obligation to update this document following publication. This video is not intended for use by a retail client or a member of the public and should not be used or relied upon by any other person. This video is not to be distributed without the consent of LIS. Except for any liability which cannot be excluded, LIS and Lonsec Research, their directors, officers, employees and agents disclaim all liability for any error or inaccuracy in, misstatement or omission from, this video or any loss or damage suffered by the reader or any other person as a consequence of relying upon it. Copyright © 2022 Lonsec Investment Solutions Pty Ltd.

You may not reproduce, transmit, disseminate, sell or publish this video without our written consent.

With a huge array of government initiatives reshaping super in recent years, none was more keenly watched than the inaugural performance test of 80 MySuper products.

The regulator found that 13 of the 80 products assessed were deemed to have underperformed the benchmark by more than 50 basis points. Since August when the results were released, 77% of these providers have announced their intentions to either merge or exit the industry.

This year, we expect to see the second round of MySuper results likely causing some MySuper solutions to be prevented from accepting new members. This will be accompanied by the first assessment of Choice options under the test. SuperRatings has conducted analysis of the industry’s performance to 31 March 2022, using its newly developed Performance Test iQ tool. Analysis was completed on over 650 options across Trustee Directed Products, including Retail, Industry, Corporate, and Government funds, excluding MySuper products.

The results from our analysis suggest that approximately 20% of options were estimated to fail the test, which allows for annualised underperformance of the benchmark of up to 50 basis points.

Option Type % Estimated to Fail
Capital Stable (20-40) 25%
Conservative Balanced (41-59) 20%
Balanced (60-76) 17%
Growth (77-90) 16%
High Growth (91-100) 26%

Breaking down the analysis further, SuperRatings found that all option types are facing challenges. In particular, options with growth assets, such as equities, making up between 91-100% of assets held were most likely to fail the test, with 26% of these options estimated as failing based on performance over the 8 years to 31 March 2022. Capital Stable options with between 20-40% growth assets are also facing a challenge to pass the test, with around a quarter of these options estimated as failing.

As the performance test captures investment returns over an eight-year period, funds have limited ability to shift their relative long-term position against the benchmark. However, with the test only accounting for the most recent level of fees charged, funds do have the ability to make fee changes to improve their performance test outcomes.

SuperRatings has been tracking an estimate of the benchmark representative administration fees and expenses (RAFE) based on the performance test calculation. While the test appears to be having an impact in terms of reducing fees for the MySuper products which were tested last year, our analysis shows that the Trustee Directed Product RAFE has remained flat.


We observed a decline in the RAFE for MySuper products each quarter since the start of the financial year, however the Trustee Directed Product RAFE saw an increase in the September quarter, followed by a return to the same RAFE in December 2021 and has remained stable since.

Since the results of the first test were published, we have observed an increase in funds seeking to simplify their investment menus, as well as a faster pace of merger announcements and shorter times for mergers to reach completion. While there are clear cost savings for funds in managing fewer options, the benefits of member choice are real, with highly engaged members particularly valuing additional choice. We suggest funds take a balanced approach when assessing the viability of offering additional options to ensure members achieve the best possible retirement outcomes.

The first performance test has had a significant impact on the future of those products which failed. Having an industry wide benchmark gives funds a clear target with significant potential benefit for members, however ensuring the test is appropriately capturing the nuances of the range of investment options in the industry remains a challenge. The regulator will be releasing the results of its second annual performance test later this year, with the industry closely monitoring potential outcomes. As the industry awaits the results of the second test, SuperRatings continues to use its comprehensive database and deep research capability to gain key insights into super fund performance and the future outlook for the industry.

With the passing of the government’s Retirement Income Covenant legislation, funds now have a clear framework and timeline to guide their path forwards.

As we expect the number of retirement income products in the market to grow, it is crucial for funds to ensure they are appropriately resourcing education, advice and digital capabilities to support retirees in understanding, planning and managing their retirement strategies.

Camille Schmidt, Market Insights Manager, SuperRatings

With the regulator set to release the results of its assessment of performance for Trustee Directed Products for the period to 30 June 2022, we have estimated the potential outcomes for diversified Choice options using our new Performance Test iQ analysis tool for the 8-year period to 31 March 2022.

The results indicate that approximately 20% of options were estimated to fail the test, which allows for annualised underperformance of the benchmark of up to 50 basis points.

Kirby Rappell, Executive Director, SuperRatings

Lonsec Research chatted with leading Fixed Income Managers to learn more about the sector, how they are approaching the changing investment landscape and what drew them to this sometimes overlooked, but very important, sector.

In this video, Isrin Khor, Lonsec Sector Manager of Fixed Income is joined by Anthony Kirkham, Head of Melbourne Operations and Investment Management/Portfolio Manager at Western Asset Management, and Sachin Gupta, Managing Director and Head of the Global Desk at PIMCO. The discussion focuses on the key qualitative strengths of PIMCO and Western Asset, particularly on business, people, and the process followed by a market outlook discussion.

IMPORTANT NOTICE: This video is published by Lonsec Research Pty Ltd ABN 11 151 658 561, AFSL No. 421445 (Lonsec). Please read the following before making any investment decision about any financial product mentioned in this video.
Disclosure as at the date of publication: Lonsec receives fees from fund managers or product issuers for researching their financial product(s) using comprehensive and objective criteria. Lonsec receives subscriptions for providing research content to subscribers including fund managers and product issuers. Lonsec receives fees for providing investment consulting advice to clients, which includes model portfolios, approved product lists and other advice. Lonsec’s fees are not linked to the product rating outcome or the inclusion of products in model portfolios, or in approved product lists. Lonsec and its representatives, Authorised Representatives and their respective associates may have positions in the financial product(s) mentioned in this video, which may change during the life of this video, but Lonsec considers such holdings not to be sufficiently material to compromise any recommendation or advice.
Warnings: Past performance is not a reliable indicator of future performance. The information contained in this video is obtained from various sources deemed to be reliable. It is not guaranteed as accurate or complete and should not be relied upon as such. Opinions expressed are subject to change. This video is but one tool to help make investment decisions. The changing character of markets requires constant analysis and may result in changes. Any express or implied rating or advice presented in this video is limited to “General Advice” (as defined in the Corporations Act 2001 (Cth)) and based solely on consideration of the investment merits of the financial product(s) alone, without taking into account the investment objectives, financial situation and particular needs (‘financial circumstances’) of any particular person. It does not constitute a recommendation to purchase, redeem or sell the relevant financial product(s).
Before making an investment decision based on the rating(s) or advice, the reader must consider whether it is personally appropriate in light of his or her financial circumstances, or should seek independent financial advice on its appropriateness. If our advice relates to the acquisition or possible acquisition of particular financial product(s), the reader should obtain and consider the Investment Statement or Product Disclosure Statement for each financial product before making any decision about whether to acquire a financial product. Where Lonsec’s research process relies upon the participation of the fund manager(s) or product issuer(s) and they are no longer an active participant in Lonsec’s research process, Lonsec reserves the right to withdraw the video at any time and discontinue future coverage of the financial product(s).
Disclaimer: This video is for the exclusive use of the person to whom it is provided by Lonsec and must not be used or relied upon by any other person. No representation, warranty or undertaking is given or made in relation to the accuracy or completeness of the information presented in this video, which is drawn from third party information or opinion not verified by Lonsec. Financial conclusions, ratings and advice are reasonably held at the time of completion but subject to change without notice. Lonsec assumes no obligation to update this video following publication. Except for any liability which cannot be excluded, Lonsec, its directors, officers, employees and agents disclaim all liability for any error or inaccuracy in, misstatement or omission from, this video or any loss or damage suffered by the viewer or any other person as a consequence of relying upon it.

Copyright © 2021 Lonsec Research Pty Ltd (ABN 11 151 658 561, AFSL No. 421445) (Lonsec). This video is subject to copyright of Lonsec. Except for the temporary copy held in a computer’s cache and a single permanent copy for your personal reference or other than as permitted under the Copyright Act 1968 (Cth), no part of this video may, in any form or by any means (electronic, mechanical, micro-copying, photocopying, recording or otherwise), be reproduced, stored or transmitted without the prior written permission of Lonsec.

This video may also contain third party supplied material that is subject to copyright. Any such material is the intellectual property of that third party or its content providers. The same restrictions applying above to Lonsec copyrighted material, applies to such third party content.

Important information: Any express or implied rating or advice is limited to general advice, it doesn’t consider any personal needs, goals or objectives.  Before making any decision about financial products, consider whether it is personally appropriate for you in light of your personal circumstances. Obtain and consider the Product Disclosure Statement for each financial product and seek professional personal advice before making any decisions regarding a financial product.

Important information: Any express or implied rating or advice is limited to general advice, it doesn’t consider any personal needs, goals or objectives.  Before making any decision about financial products, consider whether it is personally appropriate for you in light of your personal circumstances. Obtain and consider the Product Disclosure Statement for each financial product and seek professional personal advice before making any decisions regarding a financial product.