Super funds have managed to push through a challenging quarter for markets, posting gains in September and recovering from August’s falls. Despite the recent volatility and geopolitical risks that have shaken global markets in recent months, Australia’s super funds have proved up to the task of navigating the current uncertainty.

The median balanced option returned 1.2% in September, according to leading superannuation research house SuperRatings. The median growth option fared slightly better, returning 1.5% in September, while the capital stable option returned 0.4%.

It has been a successful year for super funds, which has seen the median balanced option return hit 11.5% over the calendar year to date. Over the past five years, the median balanced option has returned 7.8% p.a., compared to 8.6% p.a. from growth and 4.9% p.a. from capital stable.

Accumulation returns (% p.a. to end of September 2019)

  1 mth 1 yr 3 yrs 5 yrs 7 yrs 10 yrs
SR50 Growth (77-90) Index 1.4% 7.0% 9.1% 9.5% 10.3% 8.3%
SR50 Balanced (60-76) Index 1.2% 6.9% 8.5% 7.8% 9.1% 7.7%
SR50 Capital Stable (20-40) Index 0.4% 5.8% 4.9% 4.9% 5.4% 5.6%

Source: SuperRatings

Pension returns also saw promising growth in September, with the balanced option returning 1.2% over the month, compared to 1.5% from the median growth option and 0.5% from the median capital stable option.

Pension returns (% p.a. to end of September 2019)

  1 mth 1 yr 3 yrs 5 yrs 7 yrs 10 yrs
SRP50 Growth (77-90) Index 1.5% 7.9% 10.6% 9.7% 11.5% 9.3%
SRP50 Balanced (60-76) Index 1.2% 7.8% 9.3% 8.5% 10.0% 8.6%
SRP50 Capital Stable (20-40) Index 0.5% 6.7% 5.6% 5.5% 6.1% 6.3%

Source: SuperRatings

However, while pension returns have held up well, the low rate environment is making it challenging for super funds to deliver income to those in the retirement phase. The RBA’s interest rate cut last week brings the cash rate to a new record low of 0.75% and has pulled longer-term rates down with it. Falling rates have resulted in capital gains in bond markets since the start of 2019, but the downside is the challenge the low rate environment presents to retirees in need of income.

“With interest rates so low, the hunt for yield is intensifying and is likely to become more of a challenge for super funds going forward,” said SuperRatings Executive Director Kirby Rappell.

“Pension returns are holding up well, but the split between capital gains and income is critical for retirees, because they rely on income streams to fund activities in retirement. Over the past few years we’ve seen super funds steadily reduce their allocation to bonds in favour of other income-generating assets like alternatives and property in order to generate their required yield. We expect this theme to continue to play out as rates remain low and possibly move lower over the next year or two.”

The income challenge

The key theme throughout 2019 has been the steady fall in yields as uncertainty surrounding the economic outlook has seen investors move into bonds and other safe assets. In Australia, the yield on 10-year government bonds ended September at 1.0%, down from 2.3% at the start of 2019. As the chart below shows, yields have been on the decline since the Global Financial Crisis, with the 10-year yield falling from a high of 6.5% just prior to the market meltdown. Meanwhile, the cash rate is now 225 basis points below the “emergency lows” of 2009.

Falling yields have supported capital growth but at the expense of income

10-year bond yields are at an all-time low

Source: Bloomberg, SuperRatings

Over the past 15 years to September 2019, an estimated growth rate of 6.9% was observed for the SR50 (60-76%) Balanced Index, which is well ahead of the return objective of inflation plus 3.0%. Over this period, a starting balance of $100,000 in the median balanced option would have accumulated to over $271,000, which exceeds the return objective by around $43,000.

Growth in $100,000 invested over 15 years to 30 September 2019

Super funds have exceeded their return objective

Source: SuperRatings

“Long-term super returns are healthy, even when you include the GFC period,” said Mr Rappell. “However, there’s no doubt that super funds are finding it harder to identify opportunities in the current environment. With valuations stretched, funds are paying more for growth, while lower interest rates mean they need to look beyond traditional assets to generate income.”

One of the most common investment pitfalls is to back the current winner. All too often investors pile into the best performing share, asset class or fund manager over the past year in the hope that its success will be repeated. This type of naïve momentum strategy can pay off in the short term, but investors quickly find that prior successes are not so easily replicated.

Very rarely does this kind of momentum strategy hold up in the world of managed funds, even over relatively short periods of time. For example, looking at three-year rolling returns for global growth managers, it’s clear that performance can get shuffled around a lot. Those who have outperformed over the previous three years can easily find themselves near the bottom of the pack over the next three years. Equally, those languishing near the bottom can suddenly find themselves out in front of the pack.

Following the winner can make you a loser: Global growth manager return rankings (2016 versus 2019)

Source: iRate

Obviously, if your manager research is focused on performance, you need to take a long-term view. The challenge, however, is that your analysis will inevitably be limited to those managers who have built up a sufficient track record. There’s also the classic survivorship bias problem: researchers tend to focus on the performance of those funds that have managed to remain in existence over their period of analysis. For active managers, medium- and long-term market dynamics can also have a significant impact on performance. For example, there will be periods when the market favours growth managers and periods when it favours value managers. Just because growth has outperformed value over the past decade doesn’t mean it will continue to outperform in the next. A change in market fundamentals can upend even the most thoroughly researched investment theses.

This all creates a significant conundrum for quantitative research. While qualitative research methods are sometimes criticised for being subject to arbitrary rules, in fact it’s the opposite that proves the case. Determining which quantitative metrics are relevant for which managers over which timeframe is difficult to do with a high degree of precision or confidence. Determining which are the main predictors of future performance is nigh impossible.

So how do successful researchers overcome this challenge? Clearly, quantitative measures are essential in assessing which funds are capable of delivering on their investment objectives. But they are far from the only measures that should inform your investment decisions. Qualitative factors should ideally make up the bulk of your research, but they tend to play a back-seat role because gathering the qualitative intelligence required to pick successful managers is a resource-heavy, time-consuming task. This can result in its own form of selective bias, where researchers focus on those factors that are relatively easier to measure and compare.

The limitations of quant-only research

Selecting the right manager involves looking at more than just past performance. It’s about delivering future outperformance based on an in-depth assessment of individual investment teams. This means understanding how people, strategies, and capabilities come together to position fund managers for success. When it comes to selecting for future success, qualitative research is not merely a filter or a heuristic, it’s the backbone of your entire research process.

While you might be able to get away with poor manager selection when the bull market is raging, the real test comes when the market reaches a turning point. Given the troubling signals from financial markets over the past six months, this is something many investors are starting to take very seriously. Market turning points pose a real challenge for fund managers and have a way of pushing their process and discipline to their absolute limit. In times like these, product recommendations and manager selection really count, and advisers can quickly find their own processes exposed when things go wrong.

Identifying future outperformance is an artform, not a science. Lonsec’s entire research process is built around understanding the range of qualitative factors that determine manager success and giving advisers the tools to select investment products based on individual client needs. Our analysis is based on an onsite assessment of investment teams, combined with a rigorous peer review process that safeguards the quality and integrity of our investment product ratings. Looking back over the past 10 years, our qualitative process has proven its worth. Lonsec’s Recommended and Highly Recommended managers have outperformed their respective benchmarks, even during a period where the long-running beta rally has pushed passive investment strategies ever higher, casting shade on many active managers who have struggled to offer value in this environment.

Performance of Australian equity managers rated Recommended or higher by Lonsec

Performance of global equity managers rated Recommended or higher by Lonsec

Source: iRate. Average performance is calculated based on historical monthly performance of managers currently rated.

Despite the fact that some active managers struggle to beat the market, we know that there are some that can consistently outperform. But identifying them has little to do with their past performance and much to do with having the right people, resources and processes in place to deliver on their mandate. Looking back through history, there have been funds that have been highly successful, producing people who went on to found their own funds and enjoy similar success. For new funds and products entering the market, there’s often no track record to speak of, meaning qualitative factors are the only means to measure the likelihood of success. If you screen these products out simply because you don’t have enough performance data, you risk missing out on new innovations and strategies that could prove highly valuable.

People and resources

Arguably the most important factor to consider when assessing a fund is the people responsible for making the investment decisions. Your research should take into account the size of the team, its quality, its stability, and its key person risk. Is the team large enough to carry out its mission? Does its analysts have the right level of experience and a track record of success working together? Is the fund overly reliant on a single person whose departure could adversely affect the fund’s performance?

Your research should also examine the culture and structure of the fund. Does the investment team demonstrate a real passion for investing? Do they treat it as a business or a profession? Do they have a stake in the fund’s long-term performance?

Investment philosophy

One of the most telling tests of a fund manager’s capability is to ask them to explain their investment philosophy as simply and concisely as they can. A fund’s investment philosophy should not be a string empty words displayed on the manager’s website and then largely forgotten. An effective philosophy is regularly consulted to ensure that all investment decisions ae consistent with the fund’s purpose. Your research should examine the fund’s philosophy to see if it is consistent and lived out through its investment decisions.

Is the manager sticking closely to its mandate or is it stretching it too far? Is it remaining true to label and delivering on investors’ expectations, or could it end up surprising investors when the market turns? Does the manager exercise patience and buy/sell discipline, or are they liable to panic? While this is fundamentally a qualitative research exercise, this is one example where quantitative research can play a crucial supporting role. For example, Lonsec considers key valuation metrics, performance across differing market conditions, and output from style research tools using holdings-based style analysis software.

Research process

Once the soundness of the investment philosophy has been established, the next step is to ensure that the fund has a robust process in place to identify securities and incorporate them in their portfolio. This involves everything from the idea generation process to the intellectual property and software used to value assets. If the size of the manager’s investable universe is very large, what process do they have for narrowing down their list of potential opportunities? What attributes are they looking for when searching for the right stocks, bonds or properties?

What macro or market themes are they looking to take advantage of? How do they carry out their fundamental analysis and what valuation methods do they use? Do their people and systems have the appropriate breadth and depth to carry out their research process? Lonsec typically requests that managers explain multiple investment theses as a means of demonstrating the investment process at work and gauging consistency with the fund manager’s stated investment style and objectives.

Partnering with a research house to achieve in-depth qualitative research at scale

Developing an effective qualitative research model requires a lot of work, but the real challenge is in supporting the process with the right people and resources. Most investors don’t have the data or the capabilities to be carrying out in-depth qualitative research at scale, which is why they partner with a research house like Lonsec. For investors committed to generating long-term outperformance, a world class research effort is required to be able to identify and evaluate those managers that can generate consistent outperformance from the thousands of managers out there.


Congratulations to all of the finalists for this year’s SuperRatings and Lonsec Fund of the Year Awards Dinner. A full list of the awards is available below.

SuperRatings MySuper of the Year Award

Awarded to the fund that has provided the Best Value for Money Default Offering.

Finalists
AustralianSuper
CareSuper
Cbus Super
First State Super
HESTA
Hostplus
QSuper
Statewide Super
Sunsuper
UniSuper


SuperRatings MyChoice Super of the Year Award

Awarded to the fund with the Best Value for Money Offering for Engaged Members.

Finalists
CareSuper
Cbus Super
Hostplus
Mercer Super Trust
QSuper
Statewide Super
Sunsuper
TelstraSuper
UniSuper
VicSuper


SuperRatings Pension of the Year Award

Awarded to the fund with the Best Value for Money Pension Offering.

Finalists
AustralianSuper
BUSSQ
Equip
HESTA
QSuper
Sunsuper
Tasplan
TelstraSuper
UniSuper
VicSuper


SuperRatings Career Fund of the Year Award

Awarded to the fund with the offering that is best tailored to its industry sector.

Finalists
Cbus Super
HESTA
Hostplus
Intrust Super
Mercy Super
TelstraSuper


SuperRatings Best New Innovation Award

Awarded to the fund that has developed and launched the most innovative product or service during the year.

Finalists
First State Super Explorer
Hostplus Self Managed Invest
Intrust Super SuperCents
Kogan Super
Raiz Invest Super
Sunsuper Adviser Online Transact


Infinity Award

Awarded to the fund most committed to addressing its environmental and ethical responsibilities.

Finalists
Australian Ethical Super
AMP
CareSuper
Christian Super
HESTA
Local Government Super

SuperRatings Momentum Award

Awarded to the fund that has demonstrated significant progress in executing key projects that will enhance its strategic positioning in coming years.

Finalists
Cbus Super
HESTA
Mercer Super Trust
Rest
Sunsuper
Tasplan


SuperRatings Net Benefit Award

Awarded to the fund with the best Net Benefit outcomes delivered to members over the short and long term.

Finalists
AustralianSuper
CareSuper
Cbus Super
Hostplus
QSuper
UniSuper


SuperRatings Smooth Ride Award

Awarded to the fund that has best weathered the ups and downs of the market, while also delivering strong outcomes.

Finalists
CareSuper
Cbus Super
CSC PSSap
HESTA
Media Super
QSuper


SuperRatings Fund of the Year Award

Announced on the night.


Active management has fallen out of favour among investors, reflecting changing investor preferences and the scars of the Global Financial Crisis, which have led investors to shun stock pickers and more elaborate strategies in favour of lower-cost, vanilla products. Investors today are focused far less on alpha generation, with its goal of outperforming benchmarks, and are now far more content in generating the majority of their returns from index funds or similar passive strategies.

The growth in passive management has been astonishing. In the last five calendar years, investors moved US$1.5 trillion into funds managed by Vanguard, one of the world’s largest managers of passive strategies. Blackrock, the second largest passive manager, took in US$685 billion over the same period. Vanguard now manages close to US$4.0 trillion globally in passive strategies and on average owns around 7% of every listed US company, according to Bloomberg data. As passive managers continue to suck up funds, active managers are struggling to get a positive message through.

Passive managers don’t apply any security selection, meaning the money simply flows into passive or index strategies that replicate benchmarks like the S&P/ASX 300 Index in Australia or the S&P 500 Index in the United States, with Exchange Traded Funds making it easier than ever before for investors to gain relatively cheap passive exposure.

At its core, passive investing is a momentum strategy. It buys more of those stocks that go up in price and sells more of those that fall in price. Passive strategies tend to work best when financial markets experience strong upward moves in share prices. Passive management is used mostly in the portfolio management of equities (Australian, Global and Emerging Markets) and fixed income (Australian and Global) and have given rise to the major ETF providers that currently dominate the market (see chart below).

FUM share of Australia’s major ETF providers (August 2019)
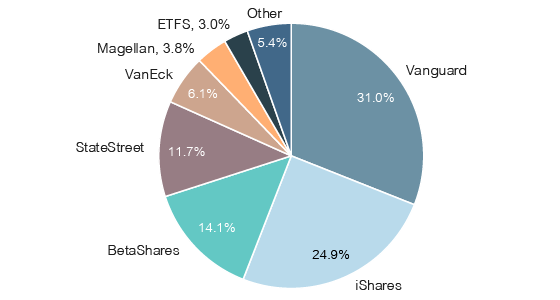
Source: ASX, Lonsec

The beta rally has put active managers in the shade

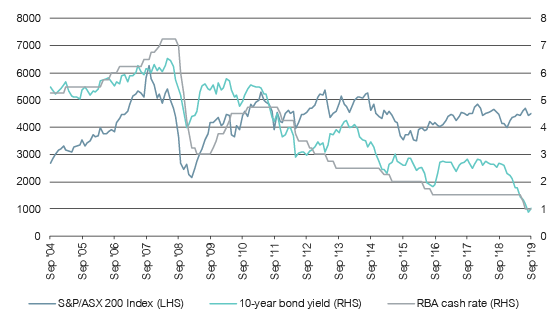
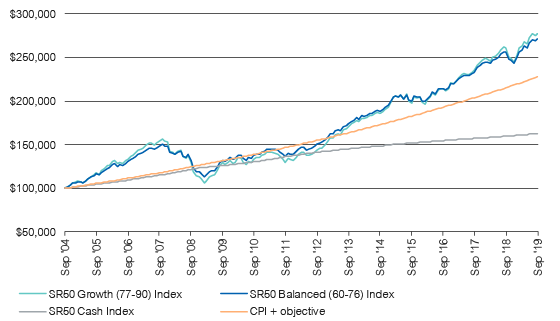
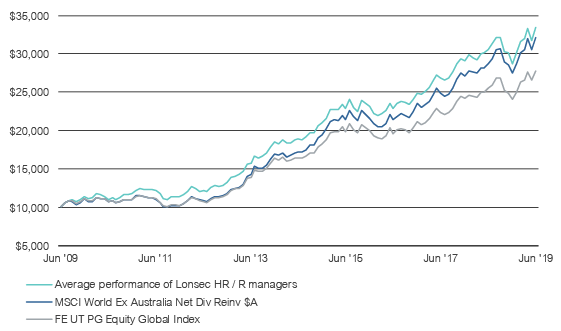
The post-GFC period has been characterised by strong equity market returns, but given the length of the bull market to date, investors are questioning how long this situation can last.

Given the inevitable cyclicality of financial markets, the one thing that’s certain is that strong markets will not last forever. In a low return environment, market beta may end up providing disappointing returns, making alpha a valuable contributor to portfolios.

The aim of active management is to be an additional incremental return source, above market returns. Alpha doesn’t scale well with beta, meaning it becomes a smaller percentage of returns when beta is very high. This is the environment we find ourselves in, so we would expect beta to do well and for seekers of alpha to struggle. But even taking a broader view, the case for active management does not appear great.

The hard truth is that most active fund managers underperform benchmarks constructed by index committees. One of the world’s most widely used benchmarks for assessing US equity fund performance is the S&P 500 index. The committee looks at only a handful of criteria when looking to add new stocks to the index, including: liquidity, financial viability (four consecutive quarters of positive earnings), market capitalisation (must be greater than US$6.1 billion), and sector representation (the committee tries to keep the weight of each sector in balance with sector weightings of the S&P Total Market Index of eligible companies). Changes to the index are made when needed.

The S&P committee does no macroeconomic forecasting, invests over a long-term horizon with low portfolio turnover, and is unconstrained by sector or industry limitations, position weightings, investment style, or performance pressures. Yet this straightforward strategy has generally outperformed active fund managers.

Some active managers can consistently outperform

If alpha were easy to find, it wouldn’t exist. There are three general sources to generate excess return for investment portfolios: strategic asset allocation, tactical tilts within asset classes (including opportunistic investing), and superior fund manager selection. While opportunistic investments tend to be episodic alpha generators in portfolios, the biggest long-term drivers of alpha are asset allocation and manager selection.

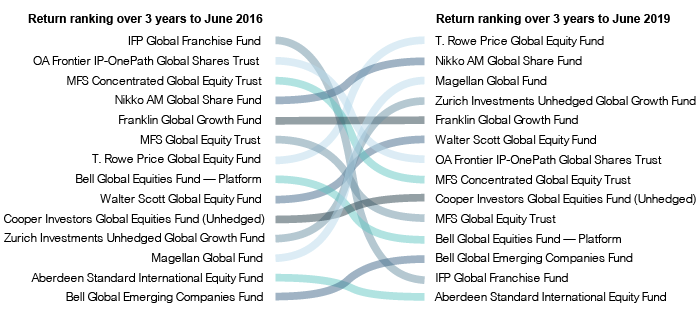
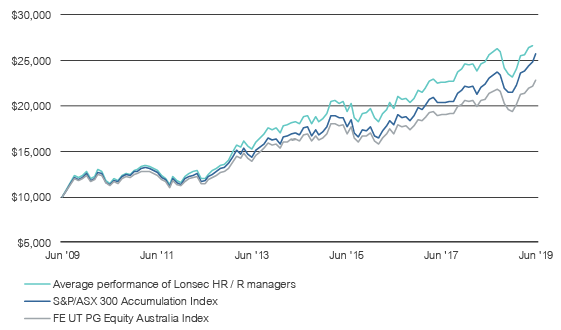
Even as managers have struggled to generate alpha, a significant number of managers are still generating returns in excess of market indices. The key is having the right resources and the right approach to find them. Average active fund managers tend to underperform industry benchmarks, but the best fund managers outperform over longer time frames.

There’s a deep body of research that looks at how investors can gain an edge by identifying active fund managers that are able to tap sustainable sources of alpha. Research indicates that to meaningfully outperform, it is often helpful to find active fund managers with a portfolio that looks significantly different to the benchmark they are attempting to beat (i.e. they have a high degree of ‘activeness’).

In the financial literature, there are numerous studies showing that the average active fund manager underperforms the benchmark index after fees. However, research presented in 2006 by Martijn Cremers and Antti Petajisto of the Yale School of Management introduced an idea called Active Share. This is a new method of measuring the extent of active management employed by fund managers and is a useful tool for finding those that can consistently outperform. By analysing 2,650 US equity funds from 1980 to 2003, Cremers and Petajisto found that the top-ranking active funds—those with an active share of 80% or higher—beat their benchmark indices by 2.0–2.7% p.a. before fees and by 1.5–1.6% p.a. after fees.

Active share aims to measure the proportion of a manager’s holdings that are different to the benchmark. It is calculated by taking the sum of the absolute value of the differences of the weight of each holding in the manager’s portfolio versus the weight of each holding in the benchmark index and dividing by two. For a long-only equity fund, the active share is between 0% and 100%. The active share for fully passive strategies that replicate an index is 0%, and more than 90% for strategies that are very different to the benchmark index.

As you might expect, the portfolios of active, high-conviction fund managers will diverge significantly from the benchmark, and will frequently incur volatility relative to benchmark returns. However, this differentiation provides investors with the opportunity to add value over the long term.

What to look for when assessing active managers

Skilled managers with high active share have shown a higher tendency to outperform the market. Investors that tilt towards active managers with high active share have a greater chance of outperforming. They tend to be smaller fund management organizations, often where the founder is an investor first and invests his or her wealth alongside external clients, bringing their investing acumen to a portfolio of funds.

Active managers with high active share tend to maintain this high level consistently over time. This proves useful when conducting analysis to help identify managers that are likely to outperform in the future as well. While some of these managers may not have beaten the index in recent periods, when there are dislocations in markets, these managers will be well positioned to generate long-term returns above the fees they charge.

Active share by itself does not indicate whether a fund will outperform an unmanaged benchmark. There are other important aspects to consider when conducting manager due diligence. Here are a few things you should consider:

  • Find out as much as you can about the fund’s culture and process. Outperformers see investing as a profession and not a business. Examine the fund’s investment philosophy to see if it is consistent and lived out through the fund’s investment decisions. Does the manager exercise patience and discipline?
  • Successful active fund managers have low portfolio turnover with long holding periods of at least four years versus roughly one year for average performing funds. This is a useful metric to look at when assessing a fund’s buy/sell discipline. Another strong indicator is for active managers to add to stock holdings when market pricing improves, rather than giving in to agency behaviour of selling into a falling market.
  • Alpha generators are high conviction stock pickers. This means their portfolios are concentrated in their best ideas, leading to a higher level of ‘activeness’ and differentiation from the benchmark.

While there are active managers that are persistently generating alpha, finding them is not a simple task. For investors that are committed to generating long-term outperformance, it’s critical to have the right resources in place to identify these managers. A world class research effort is required to be able to identify and evaluate those managers that can generate consistent outperformance from the thousands of managers out there.

Historically, high valuations in a range of asset classes including equities, sovereign bonds, credit and unlisted assets mean future beta returns are expected to be lower. This will make it a challenging environment for investors to meet their investment objectives. For those with the knowledge and capacity, finding alpha can help bridge the gap.

With an increasing focus in the market on how we are all building our client portfolios, it is incredibly important to have a strong and defendable investment framework in place. This investment framework consists of, but is not limited to, how we structure our investment committee, what our APL looks like, and where we get our research from. However, the foundation for this framework must lie with a clearly defined and articulated investment philosophy underpinning all our investment decisions.

At its essence an investment philosophy reflects a broad set of investment beliefs. It underpins our investment strategy and process and ultimately is our ‘source of truth’ as it gives a frame of reference around all investment decisions.

Your investment philosophy should provide transparency and ensure consistency in your decision making and help mitigate behavioral biases such as chasing last year’s winners. Typically, an investment philosophy will be underpinned by some sort of empirical evidence supporting the philosophy. An example of this may be a belief in active management or an investment approach based on a valuation discipline.

There are a number of different approaches that can be taken when articulating your investment philosophy, but for many with a diverse client base, keeping it simple is the best solution. Think broadly about what you are trying to achieve across your client base, irrespective of whether they are wealth accumulators, retirees or high net worth clients.

  • Do you believe in diversification?
  • Do you believe that market beta is the primary driver of returns?
  • How do you define risk?
  • Do you believe markets are inefficient/efficient?

Answering questions such as this will help build the framework for what will become your investment philosophy. For anyone that has a more focused client base (for example; predominately retirees), you can start to ask questions around liquidity, income and timeframes.

Importantly, once you have established a set of principles that you believe in, ensure that you match this belief through your investment portfolios. For example, a philosophy based on protecting portfolios from downside risk and volatility, cannot be implemented via an index based solution.

It is always important to ensure that your investment philosophy does not remain a pretty plaque on the wall of your boardroom, but instead forms the basis for every conversation you have with your clients, as it should be clearly reflected in your recommended solutions. This is especially important in difficult market environments as a clearly articulated investment philosophy will be the reference point for your client education process.

A combination of factors has created fertile ground for market volatility, resulting in a bumpy ride for super members, who have experienced six negative monthly returns over the past year.

According to SuperRatings, the median balanced option return for August was an estimated -0.5%, with the negative result driven by a fall in Australian and international shares. The median growth option, which has a higher exposure to growth assets like shares, fared worse, returning an estimated -0.9%.

In contrast, the median capital stable option, which includes a higher allocation to bonds and other defensive assets, performed more favourably with an estimated return of 0.3% (see table below).

Estimated accumulation returns (% p.a. to end of August 2019)

1 month 1 year 3 years 5 years 7 years 10 years
SR50 Growth (77-90) Index -0.9% 5.2% 8.8% 8.0% 10.2% 8.5%
SR50 Balanced (60-76) Index -0.5% 5.3% 8.0% 7.5% 9.2% 8.0%
SR50 Capital Stable (20-40) Index 0.3% 5.3% 4.8% 4.8% 5.4% 5.7%

Source: SuperRatings

Investors were caught off guard in August as trade negotiations between the US and China broke down, while a range of geopolitical and market risks, including further signs of a slowing global economy, added to uncertainty.

In Australia, a disappointing GDP result for the June quarter revealed a domestic economy in a more fragile state than previously acknowledged. Action from the Reserve Bank to lower interest rates is expected to assist in stabilising markets but could be detrimental for savers and retirees who rely on interest income.

Pension products shared a similar fate in August, with the balanced pension option returning an estimated -0.6% over the month while the growth pension option returned an estimated -1.0% and the capital stable pension option was mostly flat with an estimated return of 0.3%. Long-term returns are still holding up well, with the median balanced option for accumulation members delivering 9.2% p.a. over the past seven years (in excess of the typical CPI + 3.0% target) and the median balanced pension option returning 10.2% p.a.

Estimated pension returns (% p.a. to end of August 2019)

1 month 1 year 3 years 5 years 7 years 10 years
SRP50 Growth (77-90) Index -1.0% 5.9% 9.9% 9.2% 11.5% 9.4%
SRP50 Balanced (60-76) Index -0.6% 6.2% 8.7% 8.0% 10.2% 8.8%
SRP50 Capital Stable (20-40) Index 0.3% 6.2% 5.5% 5.5% 6.3% 6.4%

Source: SuperRatings

“There will always be negative months for super members, but the timing of negative returns can have a real impact on those entering the retirement phase,” said SuperRatings Executive Director Kirby Rappell.

“For members shifting their super savings to a pension product, a number of down months in relatively quick succession will mean they begin drawing down on a smaller pool of savings than they might have anticipated. As members get closer to retirement, it’s important that they review their risk tolerance to make sure they can retire even if the market takes a turn for the worse.”

As the chart below shows, down months in the latter part of 2018 took their toll on pension balances, although they were able to recover through 2019 to finish above their starting value by the end of August 2019.

Pension balance over 12 months to end August 2019*

Pension balance over 12 months to end August 2019
Source: SuperRatings
*Assumes a starting balance of $250,000 at the end of August 2018 and annual 5% drawdown applied monthly.

Comparing balanced and capital stable option performance shows that the balanced option suffered a greater drop but was able to bounce back relatively quickly. A starting balance of $250,000 fell to $232,951 over the four months to December 2018, before recovering to $252,091 at the end of August 2019.

In contrast, the capital stable option was able to better withstand the market fall, with a starting balance of $250,000 dropping to only $241,746 in December before rising back to $252,201.

While both performed similarly over the full 12-month period, a member retiring at December 2018 could have been over $8,500 worse off if they were in a balanced option compared to someone in a capital stable option. While a capital stable option is not expected to perform as well over longer periods, it will provide a smoother ride and may be an appropriate choice for those nearing retirement.

“Super fund returns have generally held up well under challenging conditions, but there’s no doubt this has been a challenging year for those entering retirement,” said Mr Rappell.

“Under these market conditions, timing plays a bigger role in determining your retirement outcome. At the same time interest rates are at record lows and moving lower, so the income generated for retirees and savers is less, particularly if someone is relying on interest from a bank account. In the current low rate and low return environment, it’s harder for retirees to generate capital growth and income.”

Many retirees struggle to have enough income to fund a comfortable retirement because of an over-reliance on so-called “low risk” asset allocations, a problem that requires innovative solutions to overcome according to the team at Legg Mason’s Martin Currie.

Access the full article here.


Recent market turmoil is a timely reminder to super members not to allow short-term market movements to impact their investment decisions, according to leading research house SuperRatings.

As investors deal with a renewed bout of volatility and growing uncertainty surrounding the economic outlook, recent data show that members are often better off riding the wave rather than switching out of their current investment option in favour of something safer.

After a promising start to the 2020 financial year, markets took a dive through the first half of August, with super funds likely to feel the pinch. According to SuperRatings, the median balanced option return was a promising 1.3% in July, but this has likely been reversed due to August’s fall in share markets. The return for the median growth option, with two thirds of the portfolio allocated to local and international shares, was 1.6% over the year, while the cash option returned 0.1%.

Median Balanced option returns to 31 July 2019

 Period Accumulation returns Pension returns
 Month of July 2019 1.3% 1.5%
 Financial year return to 31 July 2019 1.3% 1.5%
 Rolling 1-year return to 31 July 2019 7.2% 8.2%
 Rolling 3-year return to 31 July 2019 8.4% 9.0%
 Rolling 5-year return to 31 July 2019 7.8% 8.4%
 Rolling 7-year return to 31 July 2019 9.5% 10.6%
 Rolling 10-year return to 31 July 2019 8.3% 9.3%
 Rolling 15-year return to 31 July 2019 7.6% 8.4%
 Rolling 20-year return to 31 July 2019 7.3% 8.0%

Median Balanced Option refers to ‘Balanced’ options with exposure to growth style assets of between 60% and 76%. Approximately 60% to 70% of Australians in our major funds are invested in their fund’s default investment option, which in most cases is the balanced investment option. Returns are net of investment fees, tax and implicit asset-based administration fees.

AustralianSuper’s balanced option remains on top of the long-term returns chart, delivering 9.6% p.a. over the 10 years to the end of 31 July 2019, followed closely by Hostplus on 9.5% p.a. and UniSuper on 9.4%.

Top 10 performing funds over 10 years to 31 July 2019


Source: SuperRatings

The SR50 Balanced Index took a dive in the December quarter of 2018, only to rebound strongly through to the end of July 2019. Switching to a capital stable option at the end of December would have meant missing out on $4,384 by the end of July (for a starting account balance of $100,000).

Balanced options have bounced back
(Value of $100,000 invested over 11 months to 31 July 2019)


Source: SuperRatings

“The lesson for investors in the current market environment is that switching in response to short-term market movements is not a good idea,” said SuperRatings Executive Director Kirby Rappell.

Historically, the June quarter is the most challenging period for super, so members might be breathing a sigh of relief. Whether the worst of recent volatility is over remains to be seen, but members have reason to be optimistic. As the chart below shows, the September quarter has delivered an average return of 2.4% over the past decade, compared to the average June quarter return of 0.9%. For growth options and options focused on Australian or international shares, the results are even more pronounced. Australian share options returns have averaged 3.9% in the September quarter and -0.6% in the June quarter.

Average quarterly returns


Source: SuperRatings

“There are certainly some significant challenges facing markets at the moment and investors are forced to deal with a constantly shifting narrative,” said Mr Rappell.

“One of the key challenges facing funds and especially retirees at the moment is record low interest rates in Australia and the continual drop in bond yields. Lower interest rates mean retirees receive less income from annuities while investors start looking for riskier assets to add to their portfolio to generate the desired yield.”

Release ends


Warnings: Past performance is not a reliable indicator of future performance. Any express or implied rating or advice presented in this document is limited to “General Advice” (as defined in the Corporations Act 2001(Cth)) and based solely on consideration of the merits of the superannuation or pension financial product(s) alone, without taking into account the objectives, financial situation or particular needs (‘financial circumstances’) of any particular person. Before making an investment decision based on the rating(s) or advice, the reader must consider whether it is personally appropriate in light of his or her financial circumstances, or should seek independent financial advice on its appropriateness. If SuperRatings advice relates to the acquisition or possible acquisition of particular financial product(s), the reader should obtain and consider the Product Disclosure Statement for each superannuation or pension financial product before making any decision about whether to acquire a financial product. SuperRatings research process relies upon the participation of the superannuation fund or product issuer(s). Should the superannuation fund or product issuer(s) no longer be an active participant in SuperRatings research process, SuperRatings reserves the right to withdraw the rating and document at any time and discontinue future coverage of the superannuation and pension financial product(s).

Copyright © 2019 SuperRatings Pty Ltd (ABN 95 100 192 283 AFSL No. 311880 (SuperRatings)). This media release is subject to the copyright of SuperRatings. Except for the temporary copy held in a computer’s cache and a single permanent copy for your personal reference or other than as permitted under the Copyright Act 1968 (Cth.), no part of this media release may, in any form or by any means (electronic, mechanical, micro-copying, photocopying, recording or otherwise), be reproduced, stored or transmitted without the prior written permission of SuperRatings. This media release may also contain third party supplied material that is subject to copyright. Any such material is the intellectual property of that third party or its content providers. The same restrictions applying above to SuperRatings copyrighted material, applies to such third party content.

Super funds have had a convincing finish to what was a bumpy 2019 financial year, with an improvement in sentiment and a rallying share market in June helping funds over the line with solid returns.

A promising 2.0% gain in the September 2018 quarter seemed to vanish before members’ eyes as funds suffered a 4.7% loss in the December quarter. Funds fought back strongly in the final six months, helped by a solid performance in June, bringing the FY19 result to 6.9%.

According to SuperRatings’ data, the median balanced option returned 2.3% in June, driven predominately by a rebound in Australian and international share markets. By comparison, the top 10 funds achieved an average return of 8.5% for the year. The return for the median growth option, with two thirds of the portfolio allocated to local and international shares, was 7.4% over the year, while the median capital stable option returned 5.3%.

While funds have ridden the wave of market fluctuations since the Global Financial Crisis, the FY19 financial year has nevertheless proved a fitting bookend to super performance over the past decade, during which the superannuation system has amassed an additional $1.3 trillion for members.

Median balanced option financial year returns since introduction
of compulsory SG

* Interim return

Source: SuperRatings

Australia’s leading super funds in 2018-19

UniSuper was the highest returning balanced option over the 12 months to 30 June 2019, delivering a 9.9% gain to members. This was followed by QSuper and Media Super, which returned 9.7% and 8.8% respectively. Both UniSuper and QSuper are among the top returning funds over 10 years, narrowly trailing AustralianSuper, which remains on top of the long-term leader board with a return of 9.8% p.a.

Top 10 returning super funds over 1 year

Source: SuperRatings

Top 10 returning super funds over 10 years

Source: SuperRatings

“UniSuper was a standout performer for the 2019 financial year, and they have also delivered consistently strong outcomes for their members over the past 10 years,” said SuperRatings Executive Director Kirby Rappell. “While year-to-year performance can fluctuate, the ability of the fund to provide solid returns over the long term, while protecting their members’ savings against the ups and downs of the market has been key to their success.”

While superannuation continues to deliver for members, SuperRatings warned that the system could become a victim of its own success, as higher account balances mean members will feel more of the bumps as markets move.

“The 4.7% drop we saw in the December quarter was felt more acutely for someone with a $100,000 balance than one with only $10,000,” said Mr Rappell. “Members should enjoy the strength of returns we’ve seen over the past decade, but as more and more workers enter and exit the system, it’s important that we keep talking about how funds manage market pullbacks and other risks for their members. The uncertainty that many consumers and investors feel at the moment reminds us that super is a long-term game, and members must have an understanding of both risk and return, and the effect they have on their retirement savings.”

High returns are not a free lunch – consumers should understand risk

Most consumers can’t define risk, but they know it when they experience it. For superannuation members, risk can mean the likelihood of running out of money in retirement, or not having enough cash to pay for holidays, car repairs, or an inheritance for their kids.

For a young worker with a relatively low super balance, being exposed to riskier assets is less of a problem – in fact, it can help them accumulate wealth over their working life. However, for members approaching retirement (aged 50 and over), an unexpected pullback in the market can mean the difference between living comfortably and having to cut back in order to get by.

While measuring risk can be tricky, it’s essential to understanding the value that members are getting from their fund. The conversation around risk will become increasingly important as a greater number of people begin transitioning to retirement and drawing down on their super.

Risk can be measured as the degree to which returns fluctuate over time. Members want high returns, but they also want consistent returns. Unfortunately, higher returns often mean taking on more risk, which means returns will be less consistent. The table below shows the top 10 funds ranked according to their risk-adjusted return, which measures how much members are being rewarded for taking on risk.

Top 10 funds ranked by risk and return (over 7 years)

Fund Risk/return ranking1 Return % p.a.
QSuper – Balanced 1 9.5%
CareSuper – Balanced 2 10.4%
Hostplus – Balanced* 3 11.1%
Cbus – Growth (Cbus MySuper)* 4 10.7%
BUSSQ Premium Choice – Balanced Growth 5 9.8%
Sunsuper for Life – Balanced 6 10.5%
Catholic Super – Balanced (MySuper) 7 9.7%
CSC PSSap – MySuper Balanced 8 9.4%
HESTA – Core Pool 9 9.9%
Media Super – Balanced 10 9.9%

1 Risk/return ranking determined by Sharpe ratio

* Interim return

Source: SuperRatings

QSuper’s return of 9.5% p.a. over the past seven years is slightly below the average of 10.1% across the top 10 ranking funds, but it has the best return to risk ratio of its peers, meaning it delivered the best return given the level of risk involved. Funds such as CareSuper and Hostplus were able to deliver higher returns, but for a slightly higher level of risk.

High returns are not a free lunch – consumers should understand risk

Following the introduction of MySuper, which provides a low-cost, ‘set-and-forget’ alternative for members, we have seen lifecycle strategies become increasingly popular. Members starting their working life in a lifecycle product are given a higher allocation to riskier growth assets like shares, which is gradually shifted over to safer assets as they age.

This allows members to benefit from higher risk and return earlier on in their working life, and having more certainty as they get closer to retirement. Approximately one third of MySuper products have some sort of age-based strategy, and tend to be offered by retail master trusts.

The chart below shows how a lifecycle product’s asset allocation changes as members age. For those starting out in the workforce, the allocation to growth assets like equities is high (around 90% for the median fund) and is reduced over time to around 50% by the time the member reaches the age of 60.

Lifecycle vs Single Default GAA

Source: SuperRatings

When assessing the performance of lifecycle products, SuperRatings found there are some retail funds that have improved their position. smartMonday MySuper – Aon MySuper High Growth (11.8% p.a.), ANZ Smart Choice Super – MySuper (10.2% p.a.) and Mercer SmartPath – MySuper (9.9% p.a.) have delivered strong returns over the three years to 30 June 2019 for younger members (in the 1995-1999 cohort), in excess of the not-for-profit median across both single default and lifecycle MySuper products.

Important information: Any express or implied rating or advice is limited to general advice, it doesn’t consider any personal needs, goals or objectives.  Before making any decision about financial products, consider whether it is personally appropriate for you in light of your personal circumstances. Obtain and consider the Product Disclosure Statement for each financial product and seek professional personal advice before making any decisions regarding a financial product.