Super members suffered sharp declines in December 2018, pushing many into negative territory for the year, with the likelihood of further losses over coming months as market volatility and political risk continue to challenge the outlook.

The latest data from superannuation research house SuperRatings, reveals major fund categories all suffered declines in December 2018, contributing to an already horror fourth quarter. The median return for the Balanced option in December was -1.2 percent, contributing to a loss of nearly 5 percent for the quarter (-4.7%) but keeping members just above water for the year, with a gain of 0.6 percent.


Interim results only. Median Balanced Option refers to ‘Balanced’ options with exposure to growth style assets of between 60% and 76%. Approximately 60% to 70% of Australians in our major funds are invested in their fund’s default investment option, which in most cases is the balanced investment option. Returns are net of investment fees, tax and implicit asset-based administration fees.

Members in the median Growth option or exposed solely to domestic or international equities were not as fortunate. Growth option members suffered a -1.7 percent decline in December and -0.3 percent for the year, as heavy losses in the fourth quarter clawed back earlier gains. Members in the median Australian Shares option experienced declines of -0.9 percent in December and -3.4 percent for the year, while the median International Shares option recorded a loss of -3.9 percent for December and -1.7 percent for the year.

SuperRatings Executive Director Kirby Rappell believes the latest data will be a cause for concern for many super members but argues it’s important to keep a long-term perspective.  “For many super members 2018 will be remembered as a turning point”, said Mr Rappell. “Volatility is likely to be a feature of markets over the coming months and members can expect ongoing fluctuation in returns”. “However, it’s important to keep a long-term perspective and recognise that super returns have been overwhelmingly positive over the last decade.”

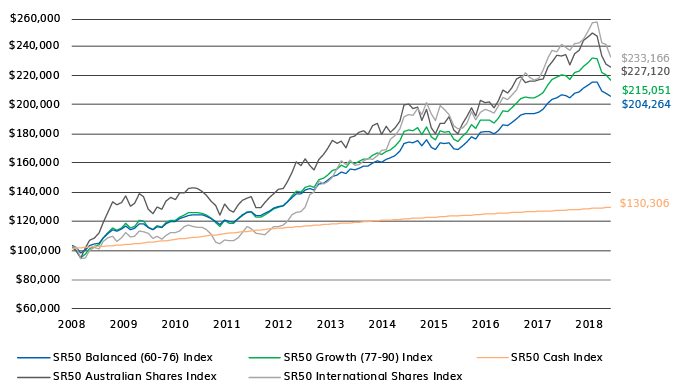
Despite the declines, super members remain well ahead over a ten-year period, with $100,000 invested in the median Balanced option in December 2008 now worth $204,264, while the median Growth option is worth $215,051 over the same period. Those invested in domestic and international shares have performed even better over the last ten years, despite a more volatile 2018 with $100,000 invested in the median Australian Shares option in 2008 now worth $227,120 and the median International Shares option rising to $233,166 over the same period. Meanwhile, $100,000 invested in the median Cash option ten years ago would only be worth $130,306.

Growth in $100,000 invested over 10 years to 31 December 2018

As we enter a more challenging investment environment, the importance of reviewing your superannuation fund to ensure it is in line with your retirement objectives is paramount.

Release ends

Synopsis of SuperRatings’ views regarding the Productivity Commission’s final report Superannuation: Assessing Efficiency and Competitiveness:

SuperRatings supported the need for a review of the current system and we engaged with the Productivity Commission by providing data and insights, including a formal submission regarding the draft report at that time.

Our submission focused on areas where we foresee implementation issues that could potentially present challenges. As a general principle, we support initiatives that:

  • ensure unintended multiple accounts are consolidated;
  • make it easier for members to engage with their superannuation;
  • provide simple, easy to use tools and information to help inform members;
  • improve member outcomes;
  • require funds to demonstrate how they are providing quality member outcomes; and
  • improve MySuper requirements.

Our responses to the key recommendations and findings were as follows…

Recommendation 1: Defaulting only once for new workforce entrants

  • SuperRatings supports the recommendation of creating a default account only for members who are new to the workforce or do not already have a superannuation account and do not nominate a fund of their own.
  • We note that the proliferation of member accounts has been the catalyst for a number of issues, which persist within the superannuation system such as balance erosion due to multiple insurance policies and account keeping fees.
  • We agree that a centralised system is needed to facilitate this change. A centralised system will remove some of the administrative burden for members seeking to consolidate their superannuation accounts and improve efficiency of the process.

Recommendation 2 and 3: ‘Best in show’ shortlist for new members and independent expert panel for shortlist selection

  • We do not believe that the overall approach covered by recommendations 2 and 3 is workable in practice.
  • One of the key considerations is the role of government in directing the superannuation system. We believe that there would be clear risks involved if the Australian Government, either directly or indirectly, were seen to be endorsing specific products for selection by consumers.
  • SuperRatings has more than fifteen years of experience as one of Australia’s leading providers of information about superannuation funds to fund members, employers and trustees. During this time, we have gradually evolved a sophisticated approach to rating and comparing a range of superannuation products.
  • As a result, we also have an appreciation of the practical challenges involved in creating lists of rated products and explaining our ratings to consumers, product providers and other interested parties.
  • The “Best in Show” shortlist recommendation also has unintended consequences for employer-sponsored corporate funds. We assume that the intention of the Productivity Commission’s recommendation is to publish a list of funds that could be joined by any new employee in any occupation or industry, i.e. those classified as “Public Offer” funds.
  • However, based on SuperRatings data, we note that in the past some of the best performing funds have been “Limited Public Offer” funds.

Recommendation 4: Elevated MySuper and Choice outcomes tests

  • SuperRatings support the Productivity Commission’s recommendations for strengthening the MySuper authorisation and have long held the view that the emphasis placed on size alone should not be the key determinant when assessing the viability of a fund.
  • Our in-house analysis suggests there are examples of good small funds delivering quality member outcomes in a cost controlled manner, helped in part by their ability to know and understand their demographic.
  • Conversely, there are examples of larger funds for whom demonstrating quality member outcomes may not be as easily attainable despite the potential size benefits.

Recommendation 5: Cleaning up unintended multiple accounts

  • We are supportive of legislation to ensure that unintended accounts are sent to the ATO once they meet a definition of ‘lost’. Policies that aim to reunite members with any existing superannuation accounts are a positive step towards reaching the true level of membership across the industry.
  • Whilst we support auto-consolidation of the aforementioned accounts by the ATO, a framework addressing trustee reporting requirements is essential to ensure that any unnecessary processing delays are avoided and that funds are allocated into the member’s most appropriate account.
  • In relation to the transfer of accounts from Eligible Rollover Funds (ERFs) to the ATO and prohibiting further accounts from being sent to ERFs, we believe further information would be useful regarding investment of ATO-held super, fees and charges for ATO-held super and governance of ATO-held super.

Finding 3.7: Association between fees and returns

  • SuperRatings does not ascribe to the view that higher fees are clearly associated with lower net returns over the long term. Superannuation products levy a variety of fees and charges, some of which may ultimately add to retirement balances.
  • For a number of providers with a high investment fee, it can be attributed to allocations to higher cost asset classes, which have been a key reason for their consistently strong performance outcomes for members.

There has always been an element of tension between super funds and financial advisers. From the super fund’s perspective, the adviser is a possible threat to member retention and can disrupt the fund’s engagement process. For the adviser, the super fund can sometimes seem like a closed shop, unwilling to give up control of the advice experience or shed any real light on its investment process, structures and strategy. At face value, the two should be natural enemies.

While there will inevitably be some antagonism between the two, the reality is that both funds and advisers need each other – now more than ever before. In a post-Royal Commission environment, the most successful super funds will be those that actively engage with third-party adviser networks, giving their members the flexibility to choose how they access financial advice. For advisers, success means rising to the challenge of ever higher standards and increased scrutiny, which requires them to have the information and tools to justify investment decisions based on their client’s best interest.

Finding a common path will require a big shift in thinking but the rewards will be more sustainable growth for funds and advisers, as well as better member outcomes. With the median fund currently providing one financial adviser for every 14,230 members, the ability to access scale is crucial for future growth. Third party advice networks facilitate greater reach through their advice channels, while concerns over quality control can be managed through the delivery of accurate and timely information to advisers and dedicated monitoring.

While funds must be prepared to give up some control, advisers will need to work harder than ever to ensure their advice is in their clients’ best interest. The limitations of many advice businesses have been laid bare by the Royal Commission. There will likely be significant turnover in coming years, with more advisers distancing themselves from aligned groups. This provides a significant opportunity to support and build traction within the new advice landscape.

Overcoming the ‘us vs them’ mentality

SuperRatings found that funds with a dedicated strategy focused on servicing third party advice networks have been rewarded with improved member retention, which can aid membership growth. These relationships can be mutually beneficial for funds and advisers, with funds able to service and engage with more members, and advisers able to access a broader client base and a more diversified pool of funds.

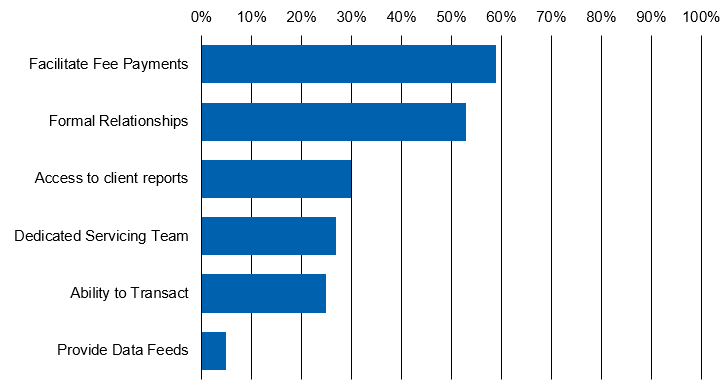
Which is why it’s surprising that many funds are yet to fully take advantage of these opportunities. According to SuperRatings’ data, only 53% of Not for Profit (NFP) funds have formal relationships with advisers, which have traditionally been the domain of retail funds through vertically integrated business functions. Even fewer NFPs have a dedicated servicing team for third party advisers – only 27% compared to 79% of Retail Master Trusts (RMTs) – which is essential for enabling advisers to provide a competitive service.

Third party adviser network trends (% of Not-for-Profits)


Source: SuperRatings. Data to 30 June 2017

When it comes to being open and transparent with advisers, super funds also have a lot of work to do. SuperRatings’ analysis shows that only 5% of NFP funds provide data feeds to third party advisers, compared to 73% of RMTs, while 30% of NFP funds (92% of RMTs) provide access to client reports, which enable advisers to provide timely, informed advice to their clients. Funds are also reluctant to allow advisers to transact on behalf of their members, with only 25% of NFPs offering this capability, meaning there are still significant barriers for advisers to effectively engage with funds and provide a streamlined service.

Empowering advisers means more opportunities for funds

Funds and advisers need each other, but how can they go about creating mutually beneficial and trusting relationships? The answer is by sharing information and being transparent about members’ needs. For advisers, this means having access to high quality investment product research that enables them to efficiently assess a wide range of NFP, retail and corporate funds, and ensures they have an in-depth understanding of how each fund stacks up. Equally, super funds need to support this process by giving advisers the information they need to make decisions in their client’s best interest. Transparency is no longer a radical strategy for super funds – it not only reduces friction for the adviser and their client by making it easier to do business, it means that the adviser is in a position to assess the product and consider it for their client. Communicating third party assessments, such as Lonsec’s well recognised investment option ratings, also helps advisers to easily identify and justify high quality superannuation offerings. We expect to see significant changes in funds’ external advice offerings in coming years, particularly as funds continue to report growing success in this area. SuperRatings is supporting this evolution by making its specialised superannuation research available to financial advisers via Lonsec’s market leading iRate platform, giving advisers the tools to make in-depth fund comparisons and ensure that they can fully justify their fund decision on a best interest basis.

With potential risks over default models and concerns about the sustainability of the old model, it is impossible for funds to ignore these opportunities. While funds and advisers might not always see eye to ey, they can’t afford to allow their differences to get in the way of the vast opportunity staring them in face.

With 2019 upon us, SuperRatings shares some tips that will help get your superannuation off to a flying start in the new year. Here are the six questions we think every member should ask themselves if they want to get the most value out of their retirement savings. If you’re looking for a new year’s resolution that will have a real impact on your future, getting your super in shape should be high up on your list.

Warnings: Past performance is not a reliable indicator of future performance. Any express or implied rating or advice presented in this document is limited to “General Advice” (as defined in the Corporations Act 2001(Cth)) and based solely on consideration of the merits of the superannuation or pension financial product(s) alone, without taking into account the objectives, financial situation or particular needs (‘financial circumstances’) of any particular person. Before making an investment decision based on the rating(s) or advice, the reader must consider whether it is personally appropriate in light of his or her financial circumstances, or should seek independent financial advice on its appropriateness.

If SuperRatings advice relates to the acquisition or possible acquisition of particular financial product(s), the reader should obtain and consider the Product Disclosure Statement for each superannuation or pension financial product before making any decision about whether to acquire a financial product. SuperRatings’ research process relies upon the participation of the superannuation fund or product issuer(s). Should the superannuation fund or product issuer(s) no longer be an active participant in SuperRatings research process, SuperRatings reserves the right to withdraw the rating and document at any time and discontinue future coverage of the superannuation and pension financial product(s).

Copyright © 2018 SuperRatings Pty Ltd (ABN 95 100 192 283 AFSL No. 311880 (SuperRatings)).

This media release is subject to the copyright of SuperRatings. Except for the temporary copy held in a computer’s cache and a single permanent copy for your personal reference or other than as permitted under the Copyright Act 1968 (Cth.), no part of this media release may, in any form or by any means (electronic, mechanical, micro-copying, photocopying, recording or otherwise), be reproduced, stored or transmitted without the prior written permission of SuperRatings. This media release may also contain third party supplied material that is subject to copyright. Any such material is the intellectual property of that third party or its content providers. The same restrictions applying above to SuperRatings copyrighted material, applies to such third party content.

Our Executive Director Kirby Rappell appeared on the Today show last week, to discuss some simple steps that individuals can take to get the most out of their superannuation, such as consolidating accounts and making voluntary contributions. Click here to watch the video!

Super members have suffered their second straight month of negative returns and are now firmly in the red for the financial year as market volatility and political uncertainty weighs on market sentiment. Nonetheless, super members remain well ahead over the long term with $100,000 invested ten years ago in any number of funds still worth more than twice as much today.

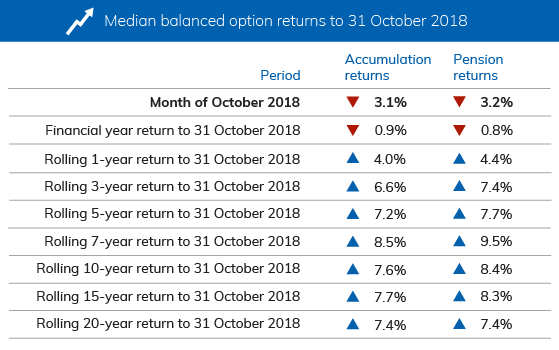
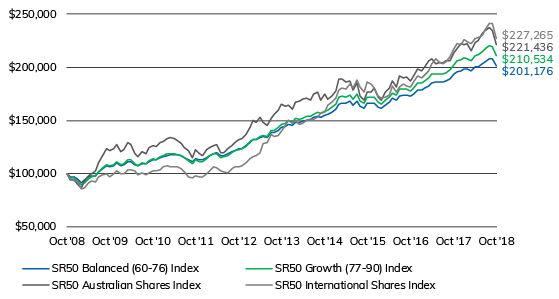
The latest data from superannuation research house SuperRatings reveals a decline of -3.1 percent in the month of October for members invested in the median Balanced option. However, because of stronger performance in July and August the losses for the financial year to date (FYTD) are lower at -0.9 percent. The decline has been more severe for members invested in the median Growth option, suffering a decline of -4.1 percent in the month of October and -1.5 percent FYTD.

Interim results only. Median Balanced Option refers to ‘Balanced’ options with exposure to growth style assets of between 60% and 76%. Approximately 60% to 70% of Australians in our major funds are invested in their fund’s default investment option, which in most cases is the balanced investment option. Returns are net of investment fees, tax and implicit asset-based administration fees.

Members who had directed their investments towards Australian and international equities have experienced even greater declines with the median Australian Shares option down -5.7 percent in October and -4.4 percent FYTD, while those in the median International Shares option suffered a decline of -5.8 percent in October but just -1.1 percent FYTD. The performance of the International Shares option reflects the divergence in domestic and international markets over recent months.

Growth of $100,000 invested over 10 years to 31 October 2018

Select index

SR50 Balanced (60-76) Index
SR50 Growth (77-90) Index
SR50 Australian Shares Index
SR50 International Shares Index
SR50 Cash Index

Source: SuperRatings

Interim results only

Source: SuperRatings

Interim results

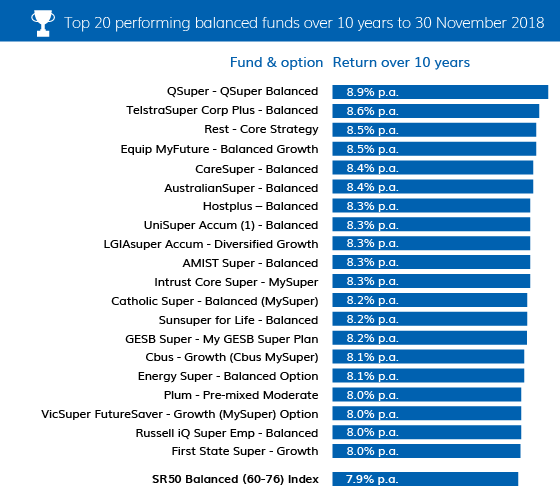
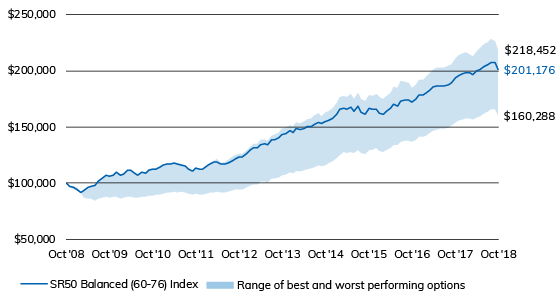
When considered over the longer term, the recent selling will not significantly diminish the stellar performance achieved by super funds over recent years. An investment of $100,000 in the median balanced fund 10 years ago would now be worth around $193,751 as at the end of September 2018. In the best performing balanced fund over that period, the same $100,000 investment would have doubled in value to $213,156.

Best and worst performing balanced options to 31 October 2018

Source: SuperRatings

Interim results

“The market rally gave way to a rolling bear market in October, and despite an attempted recovery, this month remains under significant pressure,” said SuperRatings Executive Director Kirby Rappell. “Investors are concerned that earnings momentum is slowing and that valuations, especially in some growth sectors, are too high. Add to this significant uncertainty globally, whether it’s renewed trade tensions between China and the US or the continuing Brexit saga in the UK, and it looks like volatility will be a more permanent feature of markets heading into 2019.”

Release ends

Warnings: Past performance is not a reliable indicator of future performance. Any express or implied rating or advice presented in this document is limited to “General Advice” (as defined in the Corporations Act 2001(Cth)) and based solely on consideration of the merits of the superannuation or pension financial product(s) alone, without taking into account the objectives, financial situation or particular needs (‘financial circumstances’) of any particular person. Before making an investment decision based on the rating(s) or advice, the reader must consider whether it is personally appropriate in light of his or her financial circumstances, or should seek independent financial advice on its appropriateness.

If SuperRatings advice relates to the acquisition or possible acquisition of particular financial product(s), the reader should obtain and consider the Product Disclosure Statement for each superannuation or pension financial product before making any decision about whether to acquire a financial product. SuperRatings’ research process relies upon the participation of the superannuation fund or product issuer(s). Should the superannuation fund or product issuer(s) no longer be an active participant in SuperRatings research process, SuperRatings reserves the right to withdraw the rating and document at any time and discontinue future coverage of the superannuation and pension financial product(s).

Copyright © 2018 SuperRatings Pty Ltd (ABN 95 100 192 283 AFSL No. 311880 (SuperRatings)).

This media release is subject to the copyright of SuperRatings. Except for the temporary copy held in a computer’s cache and a single permanent copy for your personal reference or other than as permitted under the Copyright Act 1968 (Cth.), no part of this media release may, in any form or by any means (electronic, mechanical, micro-copying, photocopying, recording or otherwise), be reproduced, stored or transmitted without the prior written permission of SuperRatings. This media release may also contain third party supplied material that is subject to copyright. Any such material is the intellectual property of that third party or its content providers. The same restrictions applying above to SuperRatings copyrighted material, applies to such third party content.

// GLOBAL PARAMETERS

var chartHeight = 376;
var chartWidth = 700;
var startAmt = 100000;
var numAxes = 8;
var dateNum = 10;

// DATA

// SR50 Balanced (60-76) Index

var balancedPrices = [
100000,
96890,
96770.63152,
94983.3747264571,
91506.5082945952,
93556.2540803941,
96414.3976425501,
97388.1830587399,
97904.3404289512,
101448.477552479,
104608.597628239,
107276.116867759,
106148.96670783,
107539.518171702,
109897.322107617,
107512.550217881,
108412.322750655,
111556.280110424,
111464.580848173,
108652.106544212,
107312.860678948,
109460.083708273,
109030.233959551,
111472.511200245,
112963.901927593,
112763.503965573,
114664.583878929,
115799.76325933,
117061.980678857,
117459.991413165,
117630.308400714,
117330.351114292,
116555.970796938,
114944.817612612,
112834.200871609,
110790.096488619,
113866.626678011,
112715.207349043,
112592.347773033,
115164.970327299,
117232.181544674,
118981.168461139,
119338.111966522,
116719.356437529,
117011.971864118,
118269.850561657,
120209.476110868,
121985.691329882,
123023.911548791,
123680.244116904,
126049.462873207,
129278.093815242,
131799.016644639,
131554.26587073,
134209.557173065,
135135.603117559,
134319.113803522,
138404.161011629,
139014.52336169,
140868.838088812,
143357.426982489,
144482.782784301,
146563.334856395,
145323.262480175,
148363.570454523,
147836.879779409,
148905.149072695,
150474.162628474,
150745.016121206,
152584.105317884,
153906.094006358,
152986.812906858,
154861.819285845,
156016.933595898,
157837.651210962,
160883.44436638,
165652.512307733,
166648.249559214,
166146.97162454,
167756.105044724,
164367.431722821,
168180.75613879,
163274.082578441,
161647.219619629,
166477.561836303,
165939.173401324,
166208.658618928,
162460.653367071,
161656.473132904,
164420.475510531,
166673.364865976,
170481.851253164,
168777.032740632,
173251.986986717,
173749.046937382,
173827.234008504,
172506.147030039,
174517.741210557,
178269.872646583,
178073.775786672,
180032.587320326,
182715.072871398,
185258.101255623,
186135.298365068,
186172.525424741,
186265.611687453,
187377.431123616,
189129.410104622,
193420.378161075,
195845.676282837,
197001.165772906,
198655.975565398,
198271.576252679,
196844.02090366,
200032.894042299,
200769.215125269,
203459.522607947,
205595.847595331,
207713.484825563,
207547.314037702,
201175.611496745
];

// SR50 Growth (77-90) Index

var growthPrices = [
100000,
95945,
95551.6255,
93221.0258024295,
88876.9260000363,
91481.9975780233,
95086.3882825975,
96498.421148594,
97415.1561495057,
101720.906051314,
105423.547031582,
108491.372250201,
106830.586323795,
108395.654413438,
111311.49751716,
108217.037886183,
109284.815399006,
113306.496605689,
113068.552962817,
109178.994740896,
107268.36233293,
109874.983537621,
109006.971167673,
111933.808343526,
113687.811120269,
113426.329154692,
115600.3716056,
116860.415656101,
118297.798768671,
118617.202825346,
118664.649706477,
118047.593528003,
116914.336630134,
114722.192818319,
111838.306335252,
109340.062248335,
113225.46136033,
111564.443842174,
111299.032030273,
114270.716185482,
116681.828296995,
118749.546976246,
118987.046070199,
115333.310846521,
115627.872122423,
117052.638762716,
119182.996788197,
121089.924736808,
122245.970248271,
122985.191630362,
125678.567327067,
129641.463912024,
132467.647825306,
132076.868264221,
135190.316279814,
136261.969916964,
135212.752748603,
140261.461723483,
140882.258953072,
143093.969536376,
146013.086514918,
147363.123512835,
149691.460864338,
147925.101626138,
151603.99890358,
150800.497709391,
152006.901691067,
153778.846144079,
153863.424509459,
156149.681134245,
157576.576920449,
156435.092197238,
158499.25323878,
159878.672239717,
162130.563338214,
165652.03917392,
171719.542064782,
172784.031506042,
172214.016986103,
174239.081611843,
169956.98194215,
174664.790341948,
168278.346947885,
166174.867611036,
172067.096066788,
171420.639986865,
171673.485430846,
166742.851255787,
165442.257015992,
168700.642267921,
171435.617080369,
176103.980369085,
173585.693449807,
179109.884558153,
179488.16463434,
179441.856687864,
177503.884635636,
180272.945235951,
185293.366487827,
184774.545061662,
187158.136692957,
190321.109203068,
193291.260433291,
194118.353736685,
193963.059053696,
193887.413460665,
195139.926151621,
197290.563277738,
202628.851338907,
205690.97854034,
207171.953585831,
209047.688453597,
208448.975873866,
206114.347344078,
210401.525768835,
211348.332634795,
214346.520081552,
217154.459494621,
219999.182914,
219581.184466463,
210534.439666445
];

// SR50 Australian Shares Index

var australianPrices = [
100000,
93750,
94256.15625,
90485.91,
86362.64805312,
93149.7158383186,
98111.8943507417,
99563.9503871326,
103018.819465566,
110034.401071171,
116914.412032547,
123578.533518402,
121601.276982108,
123218.57396597,
127652.964005857,
120874.591617146,
122744.642424055,
129149.457865742,
127444.685021915,
118865.618604979,
115744.207460413,
120570.740911512,
119027.435427844,
124377.718650326,
126605.945479947,
125416.609228108,
129528.894428088,
129813.85799583,
132552.930399542,
133427.779740179,
132949.57457759,
130606.471275235,
128399.221910683,
124095.665189903,
121160.802708162,
114925.8678008,
122433.400114887,
118441.826404342,
116926.837002804,
122026.834852355,
124772.438636533,
126356.923834778,
127447.005016701,
119802.096420774,
119798.382555785,
123560.051768037,
126757.168107535,
129165.554301578,
132316.935495428,
132978.520172905,
137127.4500023,
143572.440152408,
150380.070974674,
147883.761796495,
152808.291064318,
148010.110724898,
144889.761570596,
151909.815408453,
155614.74389645,
159513.826919519,
164865.037271188,
163216.386898476,
164620.047825803,
160213.498385602,
167150.742865699,
167697.994397841,
170205.079414089,
171194.311335643,
168848.949270345,
175028.82081364,
176318.258136574,
168690.553971327,
174510.378083338,
170182.520706871,
173160.714819242,
177612.330475815,
188617.012859766,
189074.409115951,
186402.787715142,
187433.967936782,
178437.137475817,
185620.838193456,
173174.960992585,
169493.261321882,
176578.079645137,
176560.421837172,
180804.757817716,
172078.035376886,
169336.832273332,
176247.637735239,
180807.692866363,
186629.70057666,
181338.00204651,
191638.000562751,
190102.213626241,
190756.545445543,
186846.036263909,
191390.131865848,
198461.997238291,
196913.993659832,
200005.543360291,
205865.705780748,
207650.767315573,
203607.391574404,
204511.408392994,
204607.937777756,
205672.512878013,
206234.204510683,
214074.610263566,
217698.893415328,
222035.673071055,
221547.194590299,
222228.452213664,
215717.158563803,
223159.400534255,
225402.821987825,
231736.641285683,
234355.265332212,
237073.786410065,
234845.292817811,
221435.626597914
];

// SR50 International Shares Index

var internationalPrices = [
100000,
94730,
93500.4046,
92817.85164642,
85281.0420927307,
86044.8191057132,
90923.5603490071,
92655.6541736557,
91814.0628667964,
96593.7193515161,
99105.1560546555,
100125.939162018,
96982.8858057835,
99257.1344779292,
102691.431330866,
99620.9575340726,
100119.062321743,
103893.550971273,
103357.148567608,
102273.242150579,
98974.9300912233,
100452.823747345,
98363.4050134006,
100476.841133519,
102641.815629422,
102673.839875899,
103840.933413768,
106790.015922719,
107537.546034178,
106741.768193525,
106204.216648903,
106355.451453411,
104812.446563725,
101919.623038566,
96506.1622608725,
95473.5463246811,
97543.6037560929,
97057.3488913688,
97076.760361147,
99406.6026098146,
102804.220880415,
106475.153999613,
105133.992959834,
102334.800397279,
101696.128907999,
101050.358489433,
104263.052536888,
106770.266161242,
106415.682107321,
107454.937658781,
109933.493250819,
114374.806378152,
115930.303744894,
116372.23006277,
119335.998018009,
127933.440659218,
129008.081560755,
136446.300519304,
134822.589543124,
136200.611230845,
139229.712824619,
144926.296524838,
149625.096910766,
147167.953569297,
150488.209769774,
146703.431294065,
147215.132862418,
150041.368983111,
151096.910013907,
151051.580940903,
153340.012392158,
156759.494668503,
157345.148140584,
164016.582421745,
166713.835119671,
171216.942520088,
178893.796571861,
180228.165400491,
179697.934137882,
184384.815656067,
180319.499240482,
188294.129094392,
180988.128591401,
176301.441001526,
186397.343020479,
183805.487965779,
180110.997657667,
173184.288909748,
170875.395970003,
171492.597900247,
174263.060819326,
182087.646513174,
176928.921399809,
181781.020140278,
184001.475301291,
182760.017347433,
181115.177191307,
185842.464431177,
191688.696677253,
190174.355973502,
193122.058491092,
196578.943338082,
203164.337939908,
208105.700967283,
204714.41046432,
203083.860184971,
204676.443816542,
209788.442677304,
217614.390742938,
222706.567486323,
221459.410708399,
226342.81217393,
224554.703957756,
222578.622562928,
227030.195014187,
227478.352619145,
230231.750599247,
235319.87228749,
240826.357299017,
241283.927377885,
227265.33119723
];

// SR50 Cash Index

var cashPrices = [
100000,
100394.3,
100721.2842351,
101047.117589601,
101279.525960057,
101477.831271886,
101694.689397314,
101915.366873307,
102144.574533405,
102379.507054832,
102604.741970352,
102850.993351081,
103077.265536453,
103334.958700295,
103613.963088785,
103914.443581743,
104205.404023772,
104506.140819784,
104820.077266807,
105145.019506334,
105496.309016505,
105865.546098062,
106225.488954796,
106580.600764372,
106962.692218112,
107326.365371654,
107721.541048952,
108120.110750833,
108476.907116311,
108867.42398193,
109248.459965866,
109641.754421744,
110036.464737662,
110421.592364244,
110818.447567201,
111199.219753042,
111599.536944153,
111967.815416068,
112344.811050574,
112717.795823262,
113055.949210732,
113431.294962111,
113805.618235486,
114181.176775664,
114482.615082351,
114799.502960899,
115119.334376148,
115433.840397664,
115745.511766738,
116023.879722537,
116326.353976973,
116609.143343491,
116863.584494267,
117126.060105041,
117407.279775353,
117677.316518836,
117924.438883526,
118195.665092958,
118443.521402658,
118682.540428849,
118919.905509706,
119154.653403182,
119384.502729597,
119617.780047931,
119837.039438759,
120071.800199019,
120299.936619397,
120536.205694918,
120777.278106308,
121018.83266252,
121251.309840065,
121479.141051255,
121716.875730292,
121946.312041043,
122201.179833209,
122457.435707319,
122679.818410564,
122906.039995713,
123112.030518746,
123318.735617987,
123510.989526815,
123706.630934226,
123904.56154372,
124088.931531298,
124287.473821748,
124472.165007847,
124666.715001754,
124867.303746192,
125054.604701811,
125258.068543661,
125471.007260185,
125683.053262455,
125871.577842349,
126069.699705872,
126263.973113119,
126434.934532714,
126611.94344106,
126781.476833328,
126958.844119418,
127136.586501185,
127301.864063636,
127480.086673325,
127654.096991635,
127841.365551921,
128017.01958819,
128184.84990087,
128351.490205741,
128518.347143008,
128698.272829009,
128862.10573032,
129027.951260395,
129211.816090941,
129366.87027025,
129535.047201601,
129717.020566201,
129906.666850269,
130084.76889052,
130292.904520745,
130488.343877526,
130671.027558955,
130867.034100293
];

// Dates

var dates = [“Oct 2008″,”Nov 2008″,”Dec 2008″,”Jan 2009″,”Feb 2009″,”Mar 2009″,”Apr 2009″,”May 2009″,”Jun 2009″,”Jul 2009″,”Aug 2009″,”Sep 2009″,”Oct 2009″,”Nov 2009″,”Dec 2009″,”Jan 2010″,”Feb 2010″,”Mar 2010″,”Apr 2010″,”May 2010″,”Jun 2010″,”Jul 2010″,”Aug 2010″,”Sep 2010″,”Oct 2010″,”Nov 2010″,”Dec 2010″,”Jan 2011″,”Feb 2011″,”Mar 2011″,”Apr 2011″,”May 2011″,”Jun 2011″,”Jul 2011″,”Aug 2011″,”Sep 2011″,”Oct 2011″,”Nov 2011″,”Dec 2011″,”Jan 2012″,”Feb 2012″,”Mar 2012″,”Apr 2012″,”May 2012″,”Jun 2012″,”Jul 2012″,”Aug 2012″,”Sep 2012″,”Oct 2012″,”Nov 2012″,”Dec 2012″,”Jan 2013″,”Feb 2013″,”Mar 2013″,”Apr 2013″,”May 2013″,”Jun 2013″,”Jul 2013″,”Aug 2013″,”Sep 2013″,”Oct 2013″,”Nov 2013″,”Dec 2013″,”Jan 2014″,”Feb 2014″,”Mar 2014″,”Apr 2014″,”May 2014″,”Jun 2014″,”Jul 2014″,”Aug 2014″,”Sep 2014″,”Oct 2014″,”Nov 2014″,”Dec 2014″,”Jan 2015″,”Feb 2015″,”Mar 2015″,”Apr 2015″,”May 2015″,”Jun 2015″,”Jul 2015″,”Aug 2015″,”Sep 2015″,”Oct 2015″,”Nov 2015″,”Dec 2015″,”Jan 2016″,”Feb 2016″,”Mar 2016″,”Apr 2016″,”May 2016″,”Jun 2016″,”Jul 2016″,”Aug 2016″,”Sep 2016″,”Oct 2016″,”Nov 2016″,”Dec 2016″,”Jan 2017″,”Feb 2017″,”Mar 2017″,”Apr 2017″,”May 2017″,”Jun 2017″,”Jul 2017″,”Aug 2017″,”Sep 2017″,”Oct 2017″,”Nov 2017″,”Dec 2017″,”Jan 2018″,”Feb 2018″,”Mar 2018″,”Apr 2018″,”May 2018″,”Jun 2018″,”Jul 2018″,”Aug 2018″,”Sep 2018″,”Oct 2018”];

// All prices

var allPrices = balancedPrices.concat(growthPrices, australianPrices, internationalPrices, cashPrices);

// FUNCTIONS

var balancedPoints = calcpoints(balancedPrices, chartHeight, chartWidth);
createchart(balancedPoints, balancedPrices);
createaxes(balancedPrices);
createDates();

function removeChart(){
var lines = document.getElementsByClassName(“line”);
while(lines.length > 0){
lines[0].parentNode.removeChild(lines[0]);
};
var labels = document.getElementsByClassName(“price-label”);
while(labels.length > 0){
labels[0].parentNode.removeChild(labels[0]);
};
var polyline = document.getElementById(“polyline-id”);
polyline.setAttribute(“points”, “”);
var polylineFill = document.getElementById(“polyline-fill”);
polylineFill.setAttribute(“points”, “”);
};

function report(portfolio){
if(portfolio == “balanced”){
removeChart();
createaxes(balancedPrices);
createDates();
var balancedPoints = calcpoints(balancedPrices, chartHeight, chartWidth);
createchart(balancedPoints, balancedPrices);
} else if(portfolio == “growth”){
removeChart();
createaxes(growthPrices);
createDates();
var growthPoints = calcpoints(growthPrices, chartHeight, chartWidth);
createchart(growthPoints, growthPrices);
} else if(portfolio == “australian”){
removeChart();
createaxes(australianPrices);
createDates();
var australianPoints = calcpoints(australianPrices, chartHeight, chartWidth);
createchart(australianPoints, australianPrices);
} else if(portfolio == “international”){
removeChart();
createaxes(internationalPrices);
createDates();
var internationalPoints = calcpoints(internationalPrices, chartHeight, chartWidth);
createchart(internationalPoints, internationalPrices);
} else if(portfolio == “cash”){
removeChart();
createaxes(cashPrices);
createDates();
var cashPoints = calcpoints(cashPrices, chartHeight, chartWidth);
createchart(cashPoints, cashPrices);
};
};

function numberWithCommas(num){
var parts = num.toString().split(“.”);
parts[0] = parts[0].replace(/B(?=(d{3})+(?!d))/g, “,”);
return parts.join(“.”);
};

function dataconvert(prices, dates){
var data = [];
for(var i = 0; i < prices.length; i++){
var datum = {
price: prices[i],
date: dates[i]
};
data.push(datum);
};
return data;
};

function calcdollar(data, startAmt){
var oneData = [];
for(var i = 0; i < data.length; i++){
oneData.push(data[i] + 1);
};
var dollarAmts = [];
var start = startAmt;
var accum = start;
for(var i = 0; i < oneData.length; i++){
accum = oneData[i] * accum;
dollarAmts.push(accum);
};
return dollarAmts;
};

function calcpoints(prices, chartHeight, chartWidth){
var points = [];
var xPoint = 0;
var step = chartWidth / prices.length;
var max = Math.max.apply(null, allPrices);
var min = Math.min.apply(null, allPrices);
var range = max – min;
var firstInterval = range / numAxes;
var interval = 20000;

var minAxis = 50000 // startAmt – (interval * Math.ceil((startAmt – min) / interval));
var maxAxis = 250000 // minAxis + (numAxes * interval);
var axisRange = maxAxis – minAxis;

for(var i = 0; i < prices.length; i++){
if(prices[i] === maxAxis){
var yPoint = 0;
} else if(prices[i] === minAxis){
var yPoint = chartHeight;
} else {
var yPoint = ((maxAxis – prices[i]) / axisRange) * chartHeight;
}
var xandy = {
x: xPoint,
y: yPoint
};
points.push(xandy);
var xPoint = xPoint + step;
};
return points;
};

function createaxes(prices){
var max = Math.max.apply(null, allPrices);
var min = Math.min.apply(null, allPrices);
var range = max – min;
var firstInterval = range / numAxes;
var interval = 25000;

var minAxis = 50000 // startAmt – (interval * Math.ceil((startAmt – min) / interval));
var maxAxis = 250000 // minAxis + (numAxes * interval);
var axisRange = maxAxis – minAxis;

var step = chartHeight / numAxes;
var accum = step;
var d = “”;

// DRAW AXES

for(var i = 1; i minAxis; i = i – interval){
accum = accum + step;
var div = document.createElement(“div”);
div.style.position = “absolute”;
div.className = “price-label”;
div.style.left = chartWidth + 5 + “px”;
div.style.top = accum – 12 + “px”;
var commaNum = numberWithCommas(priceLabel);
div.innerHTML = “$” + commaNum;
document.getElementById(“main-chart”).appendChild(div);
priceLabel = priceLabel – interval;
};
};

// DRAW DATES

function createDates() {
var step = chartWidth / dateNum;
var left = 0 – 25;

for(var i = 0; i <= dateNum * 12; i += 12) {
var date = dates[i];
var div = document.createElement(“div”);
div.className = “price-label”;
div.style.position = “absolute”;
div.style.top = chartHeight + 5 + “px”;
div.style.left = left + “px”;
div.style.zIndex = “4”;
div.innerHTML = date;
document.getElementById(“main-chart”).appendChild(div);
var step
left += step;
};
};

function createchart(points, prices){

// DRAW CHART LINE

var pairs = [];
for(var i = 0; i < points.length; i++){
var xPoint = points[i].x;
var yPoint = points[i].y;
pairs.push(xPoint);
pairs.push(yPoint);

var chart = document.getElementById(“chart”);
var point = chart.createSVGPoint();
point.x = xPoint;
point.y = yPoint;
var polyline = document.getElementById(“polyline-id”);
polyline.points.appendItem(point);
};

// DRAW CHART FILL

for(var i = 0; i < points.length; i++){
var xPoint = points[i].x;
var yPoint = points[i].y;
pairs.push(xPoint);
pairs.push(yPoint);

var chart = document.getElementById(“chart”);
var point = chart.createSVGPoint();
point.x = xPoint;
point.y = yPoint;
var polyline = document.getElementById(“polyline-fill”);
polyline.points.appendItem(point);
};

var num = points.length – 1;

var chart = document.getElementById(“chart”);
var point = chart.createSVGPoint();
point.x = points[num].x;
point.y = chartHeight;
var polyline = document.getElementById(“polyline-fill”);
polyline.points.appendItem(point);

var chart = document.getElementById(“chart”);
var point = chart.createSVGPoint();
point.x = 0;
point.y = chartHeight;
var polyline = document.getElementById(“polyline-fill”);
polyline.points.appendItem(point);

var chart = document.getElementById(“chart”);
var point = chart.createSVGPoint();
point.x = 0;
point.y = points[0].y;
var polyline = document.getElementById(“polyline-fill”);
polyline.points.appendItem(point);

var left = 0;
var step = chartWidth / points.length;

// CREATE INTERACTIVE ELEMENTS

for(var i = 0; i < points.length; i++){
var top = points[i].y;
var div = document.createElement(“div”);
div.id = left;
div.className = “line”;
div.style.position = “absolute”;
div.style.height = chartHeight + “px”;
div.style.width = step + “px”;
div.style.left = left – (step / 2) + “px”;
div.style.top = “0px”;
document.getElementById(“chart-container”).appendChild(div);

var div = document.createElement(“div”);
div.className = “cursor”;
div.style.height = chartHeight – points[i].y + “px”;
div.style.top = chartHeight – (chartHeight – points[i].y) + “px”;
div.style.left = “2px”;
div.style.position = “absolute”;
div.style.zIndex = “2”;
document.getElementById(left).appendChild(div);

var div = document.createElement(“div”);
div.className = “dot”;
div.style.position = “absolute”;
div.style.top = points[i].y – 6 + “px”;
div.style.left = 0 – (step / 2) + “px”;
div.style.zIndex = “3”;
document.getElementById(left).appendChild(div);

var div = document.createElement(“div”);
div.className = “label-chart”;
div.style.position = “absolute”;
div.style.top = chartHeight – 26 + “px”;
div.style.left = “-50px”;
div.style.zIndex = “4”;
var num = Math.round(prices[i]);
var commaNum = numberWithCommas(num);
div.innerHTML = dates[i] + “: $” + commaNum;
document.getElementById(left).appendChild(div);

var left = left + step;
};
};

The SuperRatings and Lonsec Day of Confrontation 2018 may be over, but the conversation hasn’t finished. Once again, the event has sparked discussion on a range of critical issues, from the government’s view on the ‘Best in Show’ proposal to the future of financial advice and the vexed issue of licensing. Below is a selection of articles flowing from the day’s event as well as the 16th Fund of the Year Awards dinner.

Market turmoil could force super mergers

Australian Financial Review
A detailed review and survey prepared for the event by SuperRatings executive director, Kirby Rappell, suggest operating expenses for an average super fund are rising by around 5 per cent a year. Read

Top super funds announced by SuperRatings

Sydney Morning Herald
The $70 billion fund for those working in the higher education and research sector, UniSuper, was named fund of the year by researcher SuperRatings at a dinner at Melbourne’s Grant Hyatt on Tuesday night. Read.

Robert wants ‘mutt’ funds closed

The Australian
In remarks at the annual “Day of Confrontation” conference organised by research company SuperRatings, Mr Robert said there were 220 funds in existence — which “would seem to be very, very excessive especially when a whole heap aren’t working.” Read

Super sector faces rising costs as funds fight for active members

Adviser Voice
Super funds are battling to improve active member ratios while operating costs per member are rising across the sector, with long-term implications for the sustainability of smaller funds. Read

Congratulations to all of the award winners & finalists from this year’s SuperRatings and Lonsec Fund of the Year Awards Dinner. A full list of the awards is available below.

SuperRatings Fund of the Year Award

Winner
UniSuper


SuperRatings Pension of the Year Award

Winner
QSuper

Finalists
AustralianSuper
BUSSQ
Cbus Super
Equip
HESTA
Sunsuper
TelstraSuper
UniSuper
VicSuper

SuperRatings MyChoice Super of the Year Award

Winner
Sunsuper

Finalists

CareSuper
Cbus Super
Hostplus
Mercer Super Trust
QSuper
Statewide Super
TelstraSuper
UniSuper
VicSuper


SuperRatings MySuper of the Year Award

Winner
UniSuper

Finalists
AustralianSuper
CareSuper
First State Super
HESTA
Hostplus
Intrust Super
QSuper
Rest
Sunsuper

SuperRatings Career Fund of the Year Award

Winner
Hostplus

Finalists
Cbus Super
HESTA
Intrust Super
Telstra Super


SuperRatings Best New Innovation Award

Winner
Sunsuper BEAM

Finalists
BUSSQ Centrelink Asssist Program
QSuper Online Tax Deduction Claims Facility
WA Super Scaled Advice Tool


SuperRatings Rising Star Award

Winner
Tasplan Super

Finalists
HUB24
MTAA Super
netwealth
WA Super

SuperRatings Infinity Award

Winner
Australian Ethical Super


In addition to the SuperRatings honours, Lonsec also presented a number of awards recognising excellence across the broader wealth management industry:

Lonsec Innovation Award

Winner
Magellan Global Trust

Finalists
Challenger CarePlus
Partners Group Global Real Estate Fund

Lonsec Rising Star Award

Winner
Lennox Capital Partners Pty Ltd

Finalists
Affirmative Investment Management Partners Ltd
India Avenue Investment Management

Lonsec Disruptor Award

Winner
BetaShares Australia 200 ETF

Finalists
BetaShares Australian Investment Grade Corporate Bond ETF
CFM IS Trends Trust

Listed Fund Award

Winner
MCP Master Income Trust

Finalists
VanEck Vectors Australian Floating Rate ETF
Vanguard Global Value Equity Active ETF

Pendal Retirement Innovation Award

Winner
Sam Harris – General Manager, Insights and Customer Experience, HESTA

Finalists
Jean-Luc Ambrosi – Executive General Manager, Marketing & Digital, TelstraSuper
Steven Hack – Manager – Product and Advice, BUSSQ
Lyn Melcer – Head of Technical Advice, QSuper


The evening was proudly supported by our principal sponsor Pendal, and the Link Group.

Voluntary superannuation contributions have eased slightly after approaching record highs as super members appeared to take a breather after riding the bull market of recent years.

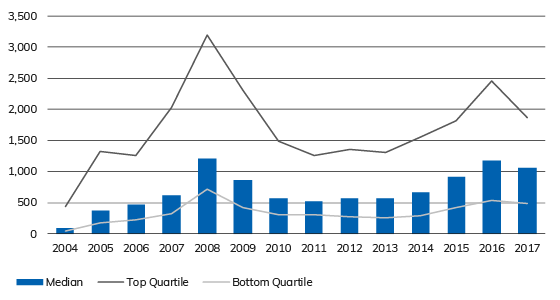
The latest data from superannuation research house SuperRatings reveals the average voluntary contribution over the course of the 2017 financial year was $1,054. This was a 10 percent decline on the prior year but just $158 per year less than the highest average contribution of $1,212 in the 2008 financial year and $260 higher than the eleven year average. Voluntary contributions more than halved in the years following the GFC but have slowly climbed since then.

Member contribution per active member


Source: SuperRatings

It remains to be seen how volatility throughout 2018 has affected member contributions but super balances remain well ahead over the course of the last decade despite recent fluctuations.

Data released by SuperRatings last week revealed that $100,000 invested in a Balanced Option in 2008 would be worth $193,751 as at the end of September 2018. This is a 9.7 percent annual return over the ten-year period. This return is despite the volatility of the first two weeks of October having cost members in a Balanced Option $2,700, while those 100 percent exposed to

Australian shares have experienced a decline of around $4,800 for the same period.

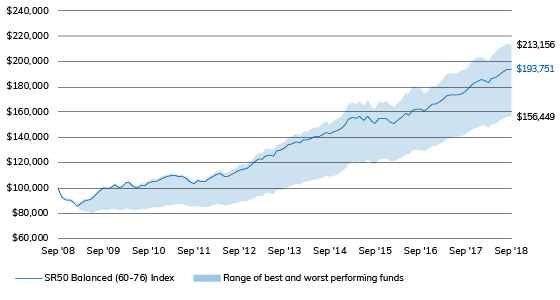
Best and worst performing options over 10 years to 30 September 2018*


Source: SuperRatings
*Interim results only

The latest data comes just a week before the annual SuperRatings Day of Confrontation, which brings together leaders from the superannuation industry along with policy makers and regulators to discuss trends across the sector.

Release ends

Australia’s superannuation funds have faced their first test of the financial year, with a major market selloff in October likely to put a dent in account balances. According to preliminary estimates from SuperRatings, over the period 28 September to 11 October, a typical balanced option account with a $100,000 balance will have lost $2,700. For members with pure Australian share exposure, this amount rises to $4,800.
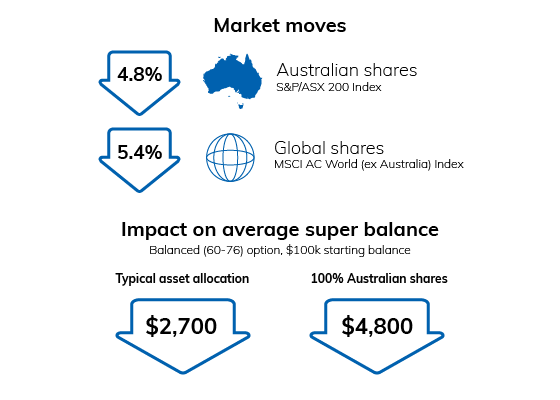
Impact of fall in share price index over the period 28 September to 11 October 2018

Source: SuperRatings, FE

October’s market jitters come on the back of lacklustre returns in the previous month, which saw super fund performance flat to slightly negative. According to SuperRatings, the median balanced option returned -0.1% in September as Australian shares came under pressure. However, while super funds may have taken a hit through the month, the data shows that superannuation has held up well over the past year, with the median balanced option delivering 9.7%.
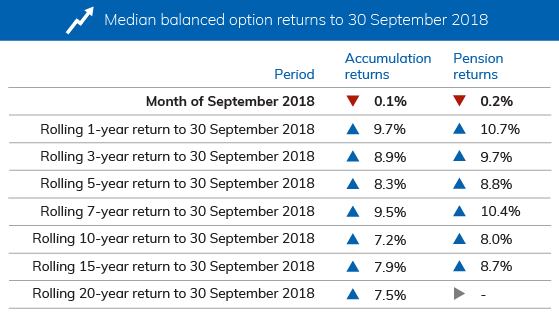
Interim results only. Median Balanced Option refers to ‘Balanced’ options with exposure to growth style assets of between 60% and 76%. Approximately 60% to 70% of Australians in our major funds are invested in their fund’s default investment option, which in most cases is the balanced investment option. Returns are net of investment fees, tax and implicit asset-based administration fees

“The market pullback is another timely reminder to members that good times should not be taken for granted,” said SuperRatings Executive Director Kirby Rappell. “We do not believe that recent selling will translate into a bear market for shares, but it certainly presents a clear message to super funds and other investment managers to be wary of holding too much risk.”

“These sort of market moves will inevitably impact superannuation account balances in the short term. However, over longer periods, as well as over the past 12 months, super returns are holding up well. The challenge for super funds in this environment will be to maintain discipline and stick to their long-term investment strategy.”

When there is a market drop, the balance of your superannuation can fall. However, it isn’t expected to affect most members directly as they cannot access their super. However, this is more challenging for those members nearing or in retirement. For most members, it is important to keep a long term view as volatility is unavoidable. Therefore, timing markets is a fraught exercise and one to be extremely cautious of.

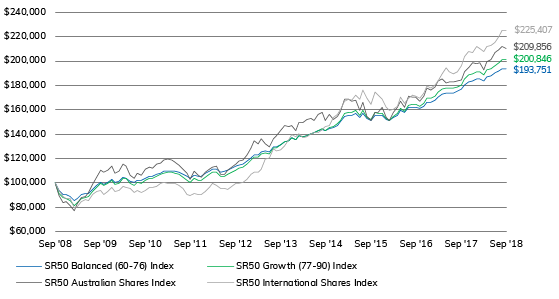
Growth in $100,000 invested for 10 years to 30 September 2018

Select index

SR50 Balanced (60-76) Index
SR50 Growth (77-90) Index
SR50 Australian Shares Index
SR50 International Shares Index
SR50 Cash Index

Source: SuperRatings

Interim results only
Source: SuperRatings

Interim results

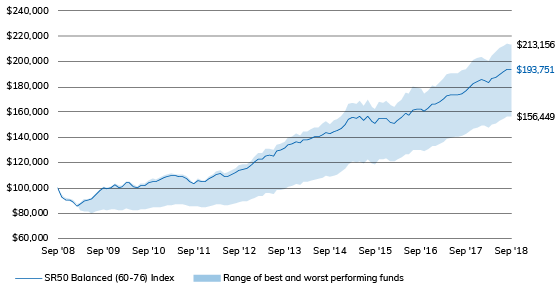
When considered over the longer term, the recent selling will not significantly diminish the stellar performance achieved by super funds over recent years. An investment of $100,000 in the median balanced fund 10 years ago would now be worth around $193,751 as at the end of September 2018. In the best performing balanced fund over that period, the same $100,000 investment would have doubled in value to $213,156.

Best and worst performing balanced options to 30 September 2018
Source: SuperRatings

Interim results

A comparison of balanced option returns shows that CareSuper remains ahead of the pack with an annual return of 7.6% over the past decade, followed closely by Equip MyFuture and HOSTPLUS. While the global financial crisis, continues to cast a shadow over long-term returns, Australia’s top performing funds have nevertheless delivered some impressive results.
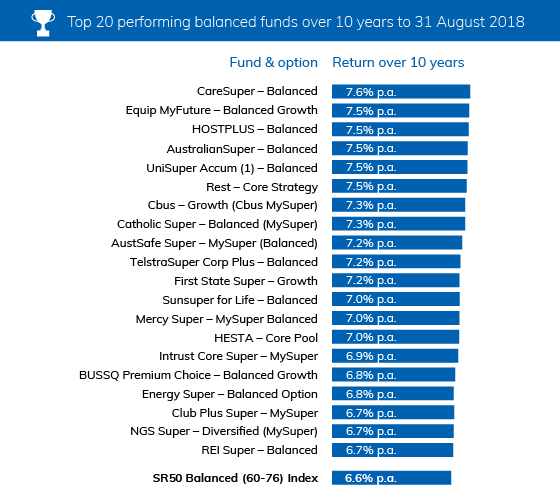
Source: SuperRatings
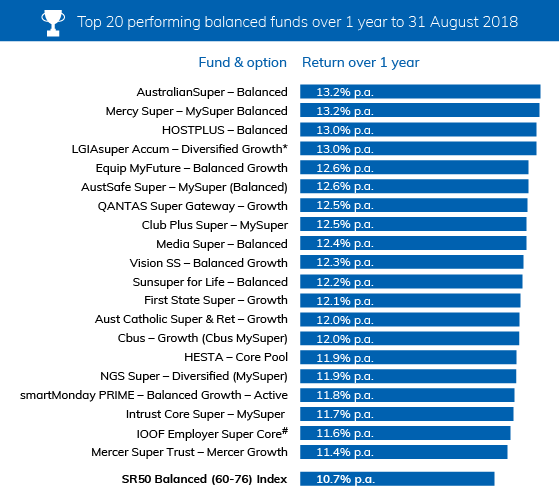
Source: SuperRatings

*Interim results

# IOOF Employer Super Core – IOOF MultiMix Balanced Growth Trust

Release ends

Warnings: Past performance is not a reliable indicator of future performance. Any express or implied rating or advice presented in this document is limited to “General Advice” (as defined in the Corporations Act 2001(Cth)) and based solely on consideration of the merits of the superannuation or pension financial product(s) alone, without taking into account the objectives, financial situation or particular needs (‘financial circumstances’) of any particular person. Before making an investment decision based on the rating(s) or advice, the reader must consider whether it is personally appropriate in light of his or her financial circumstances, or should seek independent financial advice on its appropriateness. If SuperRatings advice relates to the acquisition or possible acquisition of particular financial product(s), the reader should obtain and consider the Product Disclosure Statement for each superannuation or pension financial product before making any decision about whether to acquire a financial product. SuperRatings research process relies upon the participation of the superannuation fund or product issuer(s). Should the superannuation fund or product issuer(s) no longer be an active participant in SuperRatings research process, SuperRatings reserves the right to withdraw the rating and document at any time and discontinue future coverage of the superannuation and pension financial product(s). Copyright © 2018 SuperRatings Pty Ltd (ABN 95 100 192 283 AFSL No. 311880 (SuperRatings)). This media release is subject to the copyright of SuperRatings. Except for the temporary copy held in a computer’s cache and a single permanent copy for your personal reference or other than as permitted under the Copyright Act 1968 (Cth.), no part of this media release may, in any form or by any means (electronic, mechanical, micro-copying, photocopying, recording or otherwise), be reproduced, stored or transmitted without the prior written permission of SuperRatings. This media release may also contain third party supplied material that is subject to copyright. Any such material is the intellectual property of that third party or its content providers. The same restrictions applying above to SuperRatings copyrighted material, applies to such third party content.

// GLOBAL PARAMETERS

var chartHeight = 376;
var chartWidth = 700;
var startAmt = 100000;
var numAxes = 9;
var dateNum = 10;

// DATA

// SR50 Balanced (60-76) Index

var balancedPrices = [
100000,
93352.9,
90449.62481,
90338.1908722341,
88669.7348250148,
85423.9791817451,
87337.4763154162,
90005.6362168522,
90914.6931426424,
91396.5410162984,
94705.0958010884,
97655.1595352923,
100145.366103442,
99093.1387417934,
100391.258859311,
102592.337209801,
100366.083492349,
101206.047245096,
104141.022615204,
104055.418694614,
101429.892370112,
100179.667516758,
102184.1624841,
101782.885278025,
104062.821908253,
105455.078402564,
105268.001093478,
107042.714323912,
108102.437195719,
109280.753761153,
109652.30832394,
109811.30417101,
109531.285345374,
108808.378862095,
107304.320641084,
105333.998705472,
103425.767984924,
106297.798136097,
105222.914801345,
105108.221824212,
107509.839584673,
109439.641205218,
111072.371212359,
111405.588325996,
108960.90409577,
109234.069082338,
110408.335324973,
112219.032024303,
113877.180441494,
114846.389124231,
115459.094610209,
117670.829026562,
120684.849641249,
123038.204209253,
122809.722264036,
125288.513698214,
126153.004442731,
125390.787989888,
129204.298025025,
129774.088979315,
131505.14555221,
133828.315453536,
134878.867729846,
136821.123425156,
135663.479899855,
138501.69556284,
138010.014543592,
139007.274908684,
140471.994564397,
140724.844154613,
142441.687253299,
143675.802031662,
142817.626466127,
144567.999296096,
145646.332002845,
147346.024697318,
150189.360935903,
154641.424162126,
155570.973762764,
155103.016273686,
156605.188986296,
153441.764168773,
157001.613097489,
152421.091035369,
150902.367284293,
155411.631823482,
154909.030606165,
155160.60287187,
151661.731277109,
150911.005707287,
153491.28208287,
155594.41962997,
159149.752118515,
157558.25459733,
161735.754159723,
162199.774038407,
162272.763936725,
161039.490930806,
162917.37243455,
166420.095941892,
166237.033836356,
168065.641208556,
170569.819262564,
172943.81000706,
173762.698947444,
173797.451487233,
173884.350212977,
174922.265899398,
176557.789085557,
180563.53220433,
182827.618334641,
183906.301282815,
185451.114213591,
185092.266307587,
183759.601990173,
186736.507542413,
187423.884626677,
189935.364680675,
191929.686009822,
193906.561775723,
193751.436526302
];

// SR50 Growth (77-90) Index

var growthPrices = [
100000,
91467.9,
87758.876655,
87399.0652607145,
85267.3146599404,
81293.8577967872,
83676.6620626689,
86973.522547938,
88265.0793577749,
89103.5976116738,
93041.9766261098,
96428.7045753001,
99234.7798784414,
97715.6938680622,
99147.2287832293,
101814.289237498,
98983.8519966957,
99960.5256643471,
103639.073008795,
103421.430955477,
99863.7337306082,
98116.1183903226,
100500.340067207,
99706.3873806765,
102383.503881848,
103987.853387676,
103748.681324885,
105737.232299839,
106889.768131907,
108204.512279929,
108496.664463085,
108540.06312887,
107975.6548006,
106939.088514514,
104933.980604867,
102296.150200422,
100011.058797245,
103564.951771605,
102045.653929116,
101802.887318418,
104521.02440982,
106726.418024867,
108617.716878686,
108834.952312443,
105492.957431785,
105762.386445066,
107065.590570842,
109014.184319231,
110758.411268339,
111815.821820718,
112491.972095268,
114955.546284154,
118580.324569586,
121165.375645203,
120807.93778705,
123655.743304504,
124635.962381679,
123676.26547134,
128294.213547774,
128862.043736937,
130885.048961563,
133555.103960379,
134789.954451596,
136919.635731932,
135303.984030295,
138668.994113128,
137934.048444329,
139037.520831883,
140658.281212221,
140735.643266887,
142826.83419019,
144131.98580102,
143087.893695877,
144975.938453194,
146237.664045553,
148297.421543634,
151518.441539562,
157068.259016273,
158041.925153915,
157520.544842832,
159372.828929639,
155456.082285864,
159762.215765183,
153920.670107944,
151996.661731595,
157386.159363274,
156794.859562546,
157026.131980401,
152516.184443792,
151326.55820513,
154306.93476898,
156808.558795455,
161078.612660014,
158775.188498976,
163828.050097767,
164174.054939574,
164131.698033399,
162359.075694639,
164891.877275475,
169483.95116572,
169009.396102456,
171189.617312177,
174082.721844753,
176799.456801862,
177555.981677517,
177413.936892175,
177344.745456787,
178490.392512438,
180457.535128318,
185340.35511382,
188141.2185603,
189495.835333934,
191211.530627048,
190663.900803332,
188528.465114334,
192449.857188713,
193315.881546062,
196058.260641674,
198626.62385608,
201228.632628595,
200846.2982266
];

// SR50 Australian Shares Index

var australianPrices = [
100000,
89359.3,
83774.34375,
84226.6414319062,
80857.57577463,
77173.0577617316,
83237.9340251106,
87672.1020085623,
88969.649118289,
92056.8959426936,
98325.970556391,
104473.9001914,
110428.91250231,
108662.049902273,
110107.255165973,
114069.795064886,
108012.688946941,
109683.753257639,
115407.051502622,
113883.678422788,
106217.484726079,
103428.213577172,
107741.170083341,
106362.083106274,
111143.058741901,
113134.186639262,
112071.404089973,
115746.113358679,
116000.754808068,
118448.370734518,
119230.129981366,
118802.809195513,
116709.028486251,
114736.645904833,
110891.017744041,
108268.445174395,
102696.95098572,
109405.629308862,
105838.786982135,
104485.003057846,
109042.32543622,
111495.777758535,
112911.662640291,
113885.751553889,
107054.314746929,
107050.996063172,
110412.397339555,
113269.318120716,
115421.43516501,
118237.487340166,
118828.674776867,
122536.129429905,
128295.32751311,
134378.578762472,
132147.894355015,
136548.419237037,
132260.798872994,
129472.476711153,
135745.547680286,
139056.24584266,
142540.439138494,
147322.243250273,
145849.02081777,
147103.322396803,
143165.660662885,
149364.733769588,
149853.75390795,
152094.067528874,
152978.038249351,
150882.239125335,
156404.529077323,
157556.761243035,
150740.6981949,
155941.252282624,
152073.909226015,
154735.202637471,
158713.135226875,
168546.842372397,
168955.56846515,
166568.226282737,
167489.681710533,
159450.176988428,
165869.481663805,
154747.932918247,
151457.991864405,
157788.935924337,
157773.157030744,
161565.865952606,
153767.727866538,
151318.207961624,
157493.655346746,
161568.488691532,
166770.9940274,
162042.369262747,
171246.375836871,
169874.007380914,
170458.713714319,
166964.310083176,
171024.882104398,
177344.251498156,
175960.96633647,
178723.553507953,
183960.153625736,
185555.272117825,
181942.139859146,
182749.962960121,
182836.220942638,
183787.517800203,
184289.441511315,
191295.573209251,
194534.207263683,
198409.523206583,
197973.022255529,
198581.789298964,
192763.342872505,
199413.678201606,
201418.383908567,
207078.240496398,
209418.224614007,
211847.476019529,
209856.109744946
];

// SR50 International Shares Index

var internationalPrices = [
100000,
93420,
88496.766,
87348.07797732,
86710.4370080856,
79669.549523029,
80383.0700085573,
84940.7900780425,
86558.9121290292,
85772.6975301612,
90237.8526181863,
92584.0367862592,
93537.6523651577,
90601.411919763,
92726.0150292814,
95934.3351492946,
93065.8985283307,
93531.2280209723,
97057.355317363,
96556.2481918594,
95543.6628170714,
92462.3796912208,
93843.0279447701,
91891.0929635189,
93865.4649869331,
95887.9841610065,
95917.9012120648,
97008.1999951423,
99763.2328750043,
100461.575505129,
99718.1598463914,
99215.9791934049,
99357.2627477764,
97915.7875798316,
95213.3118426283,
90156.0567841071,
89191.3869765171,
91125.234628942,
90670.9753343167,
90689.1095293835,
92865.6481580887,
96039.7031464841,
99469.0888664387,
98216.1762230771,
95601.1705311376,
95004.5236258528,
94401.2449008286,
97402.5436799607,
99744.7826478327,
99413.5302246592,
100384.402760833,
102699.869394915,
106848.944118469,
108302.08975848,
108714.93732464,
111483.689348424,
119515.420263841,
120519.349794058,
127468.133945134,
125951.263151187,
127238.611011855,
130068.397720759,
135390.146213503,
139779.765534038,
137484.302224438,
140586.085566923,
137050.345514915,
137528.377120071,
140168.646904022,
141154.733334992,
141112.386914992,
143250.239576754,
146444.719919315,
146991.837392934,
153224.291298394,
155744.064768796,
159950.867702266,
167122.584757433,
168369.152117138,
167873.81007161,
172252.294785898,
168454.476190458,
175904.375399981,
169079.109730086,
164700.806183626,
174132.397849731,
171711.086857631,
168259.694011792,
161788.762699487,
159631.794915177,
160208.384958411,
162796.551417414,
170106.279372607,
165286.998371702,
169819.829015047,
171894.178226466,
170734.408205972,
169197.798532119,
173614.030271605,
179075.58043589,
177660.883350446,
180414.627042378,
183644.048866437,
189796.124503462,
194412.345843635,
191244.202255768,
189720.9421848,
191208.733813414,
195984.363149137,
203295.363832053,
208052.475345723,
206887.381483787,
211449.455132886,
209779.004437336,
207932.949198287,
212091.608182253,
212510.277016805,
215082.501409816,
219835.824690973,
224979.982988742,
225407.444956421
];

// SR50 Cash Index

var cashPrices = [
100000,
100570,
100966.54751,
101295.39555524,
101623.086159861,
101856.819258029,
102056.254910136,
102274.349126879,
102496.284464484,
102726.798608245,
102963.070245044,
103189.588999583,
103437.244013182,
103664.805950011,
103923.967964886,
104204.562678391,
104506.755910159,
104799.374826707,
105101.825822457,
105417.551707228,
105744.34611752,
106097.637977899,
106468.979710821,
106830.974241838,
107188.110188729,
107572.379563755,
107938.125654272,
108335.553832931,
108736.395382113,
109095.225486874,
109487.968298627,
109871.176187672,
110266.712421947,
110663.672586666,
111050.99544072,
111450.112718334,
111833.055305634,
112235.654304734,
112606.03196394,
112985.176473562,
113360.287259455,
113700.368121233,
114077.853343395,
114454.310259429,
114832.009483285,
115135.165988321,
115453.860127776,
115775.514582092,
116091.813287931,
116405.261183808,
116685.215836955,
116989.414194642,
117273.815460549,
117529.706925884,
117793.67864764,
118076.501270073,
118348.077222994,
118596.608185162,
118869.380383988,
119118.649474653,
119359.030909293,
119597.748971112,
119833.834927581,
120064.994395156,
120299.601394204,
120520.11056356,
120756.209460154,
120985.646258128,
121223.262067379,
121465.708591514,
121708.640008697,
121942.442306153,
122171.572155247,
122410.661921954,
122641.406019677,
122897.726558258,
123155.443090851,
123379.093375504,
123606.604423689,
123813.769092703,
124021.652411009,
124215.002167118,
124411.758730551,
124610.81754452,
124796.238441026,
124995.912422532,
125181.656348391,
125377.315277264,
125579.047377545,
125767.415948611,
125972.03953436,
126186.192001568,
126399.446666051,
126589.04583605,
126788.296994196,
126983.677759864,
127155.613659551,
127333.631518674,
127504.131251278,
127682.509530898,
127861.265044242,
128027.484688799,
128206.723167363,
128381.725344487,
128570.061335567,
128746.716599842,
128915.503545305,
129083.093699914,
129250.901721723,
129431.852984134,
129596.619732983,
129763.410582579,
129948.323442659,
130104.26143079,
130273.39697065,
130456.407583428,
130647.134851315,
130826.252073196,
131035.574076514,
131232.127437628,
131415.852416041
];

// Dates

var dates = [“Sep 2008″,”Oct 2008″,”Nov 2008″,”Dec 2008″,”Jan 2009″,”Feb 2009″,”Mar 2009″,”Apr 2009″,”May 2009″,”Jun 2009″,”Jul 2009″,”Aug 2009″,”Sep 2009″,”Oct 2009″,”Nov 2009″,”Dec 2009″,”Jan 2010″,”Feb 2010″,”Mar 2010″,”Apr 2010″,”May 2010″,”Jun 2010″,”Jul 2010″,”Aug 2010″,”Sep 2010″,”Oct 2010″,”Nov 2010″,”Dec 2010″,”Jan 2011″,”Feb 2011″,”Mar 2011″,”Apr 2011″,”May 2011″,”Jun 2011″,”Jul 2011″,”Aug 2011″,”Sep 2011″,”Oct 2011″,”Nov 2011″,”Dec 2011″,”Jan 2012″,”Feb 2012″,”Mar 2012″,”Apr 2012″,”May 2012″,”Jun 2012″,”Jul 2012″,”Aug 2012″,”Sep 2012″,”Oct 2012″,”Nov 2012″,”Dec 2012″,”Jan 2013″,”Feb 2013″,”Mar 2013″,”Apr 2013″,”May 2013″,”Jun 2013″,”Jul 2013″,”Aug 2013″,”Sep 2013″,”Oct 2013″,”Nov 2013″,”Dec 2013″,”Jan 2014″,”Feb 2014″,”Mar 2014″,”Apr 2014″,”May 2014″,”Jun 2014″,”Jul 2014″,”Aug 2014″,”Sep 2014″,”Oct 2014″,”Nov 2014″,”Dec 2014″,”Jan 2015″,”Feb 2015″,”Mar 2015″,”Apr 2015″,”May 2015″,”Jun 2015″,”Jul 2015″,”Aug 2015″,”Sep 2015″,”Oct 2015″,”Nov 2015″,”Dec 2015″,”Jan 2016″,”Feb 2016″,”Mar 2016″,”Apr 2016″,”May 2016″,”Jun 2016″,”Jul 2016″,”Aug 2016″,”Sep 2016″,”Oct 2016″,”Nov 2016″,”Dec 2016″,”Jan 2017″,”Feb 2017″,”Mar 2017″,”Apr 2017″,”May 2017″,”Jun 2017″,”Jul 2017″,”Aug 2017″,”Sep 2017″,”Oct 2017″,”Nov 2017″,”Dec 2017″,”Jan 2018″,”Feb 2018″,”Mar 2018″,”Apr 2018″,”May 2018″,”Jun 2018″,”Jul 2018″,”Aug 2018″,”Sep 2018”];

// All prices

var allPrices = balancedPrices.concat(growthPrices, australianPrices, internationalPrices, cashPrices);

// FUNCTIONS

var balancedPoints = calcpoints(balancedPrices, chartHeight, chartWidth);
createchart(balancedPoints, balancedPrices);
createaxes(balancedPrices);
createDates();

function removeChart(){
var lines = document.getElementsByClassName(“line”);
while(lines.length > 0){
lines[0].parentNode.removeChild(lines[0]);
};
var labels = document.getElementsByClassName(“price-label”);
while(labels.length > 0){
labels[0].parentNode.removeChild(labels[0]);
};
var polyline = document.getElementById(“polyline-id”);
polyline.setAttribute(“points”, “”);
var polylineFill = document.getElementById(“polyline-fill”);
polylineFill.setAttribute(“points”, “”);
};

function report(portfolio){
if(portfolio == “balanced”){
removeChart();
createaxes(balancedPrices);
createDates();
var balancedPoints = calcpoints(balancedPrices, chartHeight, chartWidth);
createchart(balancedPoints, balancedPrices);
} else if(portfolio == “growth”){
removeChart();
createaxes(growthPrices);
createDates();
var growthPoints = calcpoints(growthPrices, chartHeight, chartWidth);
createchart(growthPoints, growthPrices);
} else if(portfolio == “australian”){
removeChart();
createaxes(australianPrices);
createDates();
var australianPoints = calcpoints(australianPrices, chartHeight, chartWidth);
createchart(australianPoints, australianPrices);
} else if(portfolio == “international”){
removeChart();
createaxes(internationalPrices);
createDates();
var internationalPoints = calcpoints(internationalPrices, chartHeight, chartWidth);
createchart(internationalPoints, internationalPrices);
} else if(portfolio == “cash”){
removeChart();
createaxes(cashPrices);
createDates();
var cashPoints = calcpoints(cashPrices, chartHeight, chartWidth);
createchart(cashPoints, cashPrices);
};
};

function numberWithCommas(num){
var parts = num.toString().split(“.”);
parts[0] = parts[0].replace(/B(?=(d{3})+(?!d))/g, “,”);
return parts.join(“.”);
};

function dataconvert(prices, dates){
var data = [];
for(var i = 0; i < prices.length; i++){
var datum = {
price: prices[i],
date: dates[i]
};
data.push(datum);
};
return data;
};

function calcdollar(data, startAmt){
var oneData = [];
for(var i = 0; i < data.length; i++){
oneData.push(data[i] + 1);
};
var dollarAmts = [];
var start = startAmt;
var accum = start;
for(var i = 0; i < oneData.length; i++){
accum = oneData[i] * accum;
dollarAmts.push(accum);
};
return dollarAmts;
};

function calcpoints(prices, chartHeight, chartWidth){
var points = [];
var xPoint = 0;
var step = chartWidth / prices.length;
var max = Math.max.apply(null, allPrices);
var min = Math.min.apply(null, allPrices);
var range = max – min;
var firstInterval = range / numAxes;
var interval = 20000;

var minAxis = 60000 // startAmt – (interval * Math.ceil((startAmt – min) / interval));
var maxAxis = 240000 // minAxis + (numAxes * interval);
var axisRange = maxAxis – minAxis;

for(var i = 0; i < prices.length; i++){
if(prices[i] === maxAxis){
var yPoint = 0;
} else if(prices[i] === minAxis){
var yPoint = chartHeight;
} else {
var yPoint = ((maxAxis – prices[i]) / axisRange) * chartHeight;
}
var xandy = {
x: xPoint,
y: yPoint
};
points.push(xandy);
var xPoint = xPoint + step;
};
return points;
};

function createaxes(prices){
var max = Math.max.apply(null, allPrices);
var min = Math.min.apply(null, allPrices);
var range = max – min;
var firstInterval = range / numAxes;
var interval = 20000;

var minAxis = 60000 // startAmt – (interval * Math.ceil((startAmt – min) / interval));
var maxAxis = 240000 // minAxis + (numAxes * interval);
var axisRange = maxAxis – minAxis;

var step = chartHeight / numAxes;
var accum = step;
var d = “”;

// DRAW AXES

for(var i = 1; i minAxis; i = i – interval){
accum = accum + step;
var div = document.createElement(“div”);
div.style.position = “absolute”;
div.className = “price-label”;
div.style.left = chartWidth + 5 + “px”;
div.style.top = accum – 12 + “px”;
var commaNum = numberWithCommas(priceLabel);
div.innerHTML = “$” + commaNum;
document.getElementById(“main-chart”).appendChild(div);
priceLabel = priceLabel – interval;
};
};

// DRAW DATES

function createDates() {
var step = chartWidth / dateNum;
var left = 0 – 25;

for(var i = 0; i <= dateNum * 12; i += 12) {
var date = dates[i];
var div = document.createElement(“div”);
div.className = “price-label”;
div.style.position = “absolute”;
div.style.top = chartHeight + 5 + “px”;
div.style.left = left + “px”;
div.style.zIndex = “4”;
div.innerHTML = date;
document.getElementById(“main-chart”).appendChild(div);
var step
left += step;
};
};

function createchart(points, prices){

// DRAW CHART LINE

var pairs = [];
for(var i = 0; i < points.length; i++){
var xPoint = points[i].x;
var yPoint = points[i].y;
pairs.push(xPoint);
pairs.push(yPoint);

var chart = document.getElementById(“chart”);
var point = chart.createSVGPoint();
point.x = xPoint;
point.y = yPoint;
var polyline = document.getElementById(“polyline-id”);
polyline.points.appendItem(point);
};

// DRAW CHART FILL

for(var i = 0; i < points.length; i++){
var xPoint = points[i].x;
var yPoint = points[i].y;
pairs.push(xPoint);
pairs.push(yPoint);

var chart = document.getElementById(“chart”);
var point = chart.createSVGPoint();
point.x = xPoint;
point.y = yPoint;
var polyline = document.getElementById(“polyline-fill”);
polyline.points.appendItem(point);
};

var num = points.length – 1;

var chart = document.getElementById(“chart”);
var point = chart.createSVGPoint();
point.x = points[num].x;
point.y = chartHeight;
var polyline = document.getElementById(“polyline-fill”);
polyline.points.appendItem(point);

var chart = document.getElementById(“chart”);
var point = chart.createSVGPoint();
point.x = 0;
point.y = chartHeight;
var polyline = document.getElementById(“polyline-fill”);
polyline.points.appendItem(point);

var chart = document.getElementById(“chart”);
var point = chart.createSVGPoint();
point.x = 0;
point.y = points[0].y;
var polyline = document.getElementById(“polyline-fill”);
polyline.points.appendItem(point);

var left = 0;
var step = chartWidth / points.length;

// CREATE INTERACTIVE ELEMENTS

for(var i = 0; i < points.length; i++){
var top = points[i].y;
var div = document.createElement(“div”);
div.id = left;
div.className = “line”;
div.style.position = “absolute”;
div.style.height = chartHeight + “px”;
div.style.width = step + “px”;
div.style.left = left – (step / 2) + “px”;
div.style.top = “0px”;
document.getElementById(“chart-container”).appendChild(div);

var div = document.createElement(“div”);
div.className = “cursor”;
div.style.height = chartHeight – points[i].y + “px”;
div.style.top = chartHeight – (chartHeight – points[i].y) + “px”;
div.style.left = “2px”;
div.style.position = “absolute”;
div.style.zIndex = “2”;
document.getElementById(left).appendChild(div);

var div = document.createElement(“div”);
div.className = “dot”;
div.style.position = “absolute”;
div.style.top = points[i].y – 6 + “px”;
div.style.left = 0 – (step / 2) + “px”;
div.style.zIndex = “3”;
document.getElementById(left).appendChild(div);

var div = document.createElement(“div”);
div.className = “label-chart”;
div.style.position = “absolute”;
div.style.top = chartHeight – 26 + “px”;
div.style.left = “-50px”;
div.style.zIndex = “4”;
var num = Math.round(prices[i]);
var commaNum = numberWithCommas(num);
div.innerHTML = dates[i] + “: $” + commaNum;
document.getElementById(left).appendChild(div);

var left = left + step;
};
};
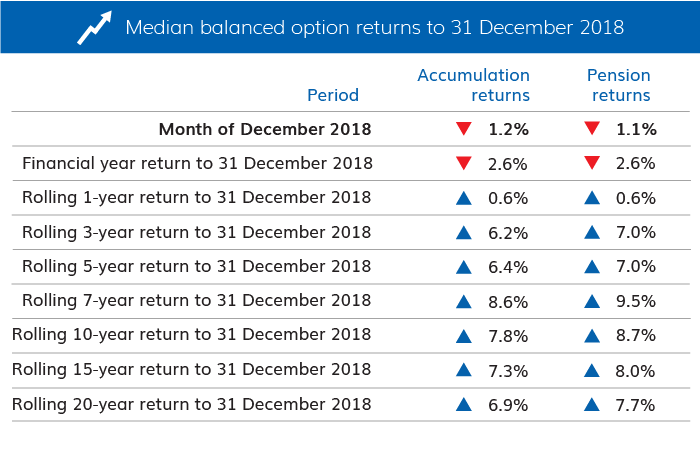
Important information: Any express or implied rating or advice is limited to general advice, it doesn’t consider any personal needs, goals or objectives.  Before making any decision about financial products, consider whether it is personally appropriate for you in light of your personal circumstances. Obtain and consider the Product Disclosure Statement for each financial product and seek professional personal advice before making any decisions regarding a financial product.