The question no-one wants to ask is – Why are APRA collecting, interpreting and then publishing information in the public domain? The answer is simple – They shouldn’t be!
Instead of regulating, APRA are now trying to play the shame game through their just released heatmaps. But there is a real risk that some of those shamed will be the wrong funds. As the founder of SuperRatings, Jeff Bresnahan says, “The problem is that no one in the industry wants to tell the regulator that they have got it wrong.”
Effectively, APRA is putting into circulation data which analyses just parts of a super fund, not the whole. By ignoring things like Governance, Advice, Insurance and Member servicing structures, consumers are not being provided with the whole picture.
As Bresnahan says, “While conflicts of interest were identified as a major issue in superannuation during the Royal Commission, it seems ironic that APRA has deliberately avoided reporting any measurement of a Fund’s Governance structure”.
In an industry which carries inherently conflicted Directors, it would appear that Governance is ignored in favour of more easily assessable information. Whether such omissions create any legal liabilities for APRA in the future remains debatable.
As a result, APRA continues its foray into unchartered territory. This is not the first time APRA have got it wrong. They have been producing performance tables for over a decade. Unfortunately, the performance tables were flawed from a usefulness perspective, in that they don’t reflect the performance of a super fund’s investment options. However, they continue to produce them and in doing so confuse and possibly mislead Australians.
And so it continues with the heatmaps. Having reviewed the heatmap methodology, SuperRatings is of the opinion that their release into the public domain may create more questions than they answer and that consumers could well be influenced into products that are inappropriate for them.
Aside from the bigger question of why APRA is publishing such data, there remain a number of problems with the methodology adopted. Critically, APRA appears to ignore implicit asset fees when measuring net investment performance. As Bresnahan says, “This methodology can easily overstate the net benefit a member receives. Similarly, a low-cost investment option with high administration fees creates the very real possibility of consumers investing monies in cheap investment options that have no chance of outperforming the relevant index over any time period, whilst getting slugged high administration fees.”
Investment analysis since the onset of the Superannuation Guarantee in 1992 has shown that all implicit fees and performance must be analysed together on an actual net of fees basis. Many leading funds, in terms of balanced option performance, have had higher allocations than the average fund to traditionally more expensive asset classes such as infrastructure, private equity and unlisted property. These asset classes have continually outperformed cheaper alternatives.
It’s only when all actual fees and returns are combined that the range of results is clearly evident in dollar terms, as the following graph indicates. The graph shows the disparity of net earnings on a $50,000 starting balance (and $50,000 salary) with SGC contributions mapped over both the last 3 and 10 years. Notably, many of the funds that added the most value, over both the short and long term, invested into the more expensive asset classes. Driving people into low-cost options will come at the expense of future earnings, something that taxpayers will ultimately have to bear.
Net benefit trend analysis (over 3 and 10 years)
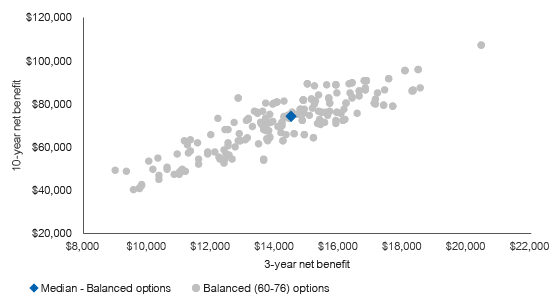
Source: SuperRatings
And the anomalies continue. The heatmaps are judging funds on short term performance over just 3 and 5 years. Whilst it will be claimed this is necessary due to the limited performance history of MySuper products, it should be noted that most funds have been around for over 25 years and that their default option provides an accurate MySuper proxy.
As Bresnahan said, “Given super is a key plank of Australia’s economic future, it seems counter-intuitive for the Government’s regulator to not measure funds over a more realistic period. Certainly, it is commonly accepted that 7, 10 and 15 year performance analysis is best practice given the long term (60 years plus) nature of superannuation membership.”
Again, a consumer moving funds due to seeing a 3-year performance gap, mid-way through an economic cycle, will no doubt be moving for the wrong reasons.
The way forward
Bresnahan says, “Australians are not stupid, but they remain frustratingly unengaged with their superannuation.” This problem remains the real challenge for much of the industry. APRA’s endeavours are admirable, but questionable at the same time. He goes on to say, “A regulator should set the structure under which funds need to operate. The morphing of this regulatory process into public comparisons leaves it open to being seen as stepping across the line. One wonders what they are actually trying to achieve by moving into this public domain.”
If APRA must continue down this path, then SuperRatings suggests that they need to concentrate on the whole picture, rather than isolated parts therein. This should, aside from earlier mentioned issues, also include:
- Regulations to enable consistent fee disclosures, including the inequitable use of tax deductions and transparency to members;
- The disclosure of risk within portfolios, both via the assumptions within their growth/defensive disclosures and accepted risk measures;
- Compulsory disclosure of major asset holdings;
- Moving members into go-forward products and removing legacy structures;
- Continued rationalisation of member accounts; and
- Increased focus on the decumulation phase and the optimisation of the alignment with retiree objectives.
Identifying poorly run funds is not difficult and APRA would be well aware of them. A series of simple measures such as the non-public fee analysis shown below, when combined with other key assessments, quickly shows those funds who have spent the past few decades masking conflicts of interest at the expense of members.
When it costs a fund over $1,200 to run every account (versus a median of $300) or a fund’s operating expenses as a percentage of assets are over two and a half times the median, then those funds bear further scrutiny. Similar work can be done across Investments, Governance, Administration and Insurance, to name a few. By putting together the whole picture, the poor funds are very quickly exposed.
Operating expenses versus size and members
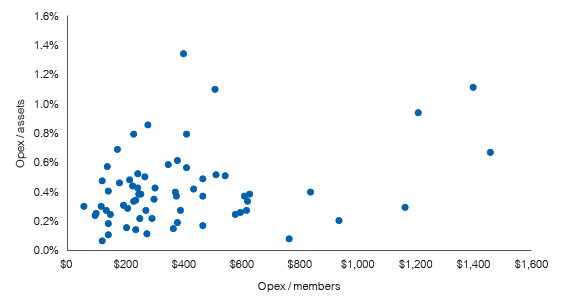
Source: SuperRatings
But it’s not all gloom and doom for the process. Importantly, after 14 years of industry debate, APRA has finally made a call on what constitutes a growth asset and what constitutes a defensive asset. The growth/defensive debate remains loud within the industry but with APRA’s call of Australian Unlisted Property and Australian Unlisted Infrastructure being 25% defensive, at least there is a starting point. SuperRatings suspect this will not however be the final position.
Certainly, APRA’s front foot involvement with data will give cause for reflection for all super funds, as the funds review their results and assess whether it has any implications for their future.
SuperRatings continues to watch the evolution of the market and continues to monitor funds on their effectiveness in responding to key challenges. We look forward to seeing whether the heatmaps evolve over time and remain broadly supportive of APRA’s underlying intentions. However, we underline that this remains only part of the picture and that the risk of making providers look alike is real. In an environment where innovation is needed, regulatory settings to support innovation are vital to ensure a vibrant industry that thrives into the future resulting in better outcomes for members.
Release ends
We welcome media enquiries regarding our research or information held in our database. We are also able to provide commentary and customised tables or charts for your use.
For more information contact:
Jeff Bresnahan
Founder & Chairman
Tel: 1300 826 395
Jeff.Bresnahan@superratings.com.au
Kirby Rappell
Executive Director
Tel: 1300 826 395
Kirby.Rappell@superratings.com.au