Last week, we partnered with Money Management to recognise the best performing funds at the annual Money Management and Lonsec Fund Manager of the Year Awards Dinner. A full list of winners can be found below.

Congratulations to all of our award winners and nominees!

Category Winner
Australian Large Cap Equities AB Managed Volatility Equities Fund
Australian Small Cap Equities Perennial Value Microcap Opportunities Trust
Global Equities Generation Wholesale Global Share Fund
Global Emerging Market Equities Fidelity China Fund
Long/Short Equities Solaris Australian Equity Long Short Fund
Responsible Investments Australian Ethical Australian Shares Fund (Wholesale)
Australian Property Securities Pendal Property Securities Fund
Global Property Securities Quay Global Real Estate Fund
Infrastructure Securities Magellan Infrastructure Fund
Direct Property Australian Unity Retail Property Fund
Australian Fixed Income Janus Henderson Australian Fixed Interest Fund
Global Fixed Income Colchester Global Government Bond Fund Class I
Alternative Strategies Partners Group Global Value Fund (AUD) – Wholesale
Multi-Asset BMO Pyrford Global Absolute Return
ETF Provider Van Eck
SMA Provider AB Concentrated Global Growth Equities Portfolio
Listed Products (LICs & LITs) Australian Foundation Investment Company Limited
Retirement and Income Focussed Legg Mason Martin Currie Real Income Fund
Emerging Manager Lennox Australian Small Companies Fund
Fund Manager of the Year AllianceBernstein

Leading research house and managed account provider Lonsec will work with financial advisers seeking to transition from conflicted advice models and introduce a greater degree of independence in their investment decisions.

Lonsec is offering to acquire in-house managed portfolios from advice licensees to enable them to take advantage of best practice governance principles and Lonsec’s experienced team of portfolio construction experts.

With a shift currently taking place in the advice industry in the wake of the Royal Commission into Financial Services, Lonsec said advisers are acutely aware of the need to present a professional, conflict-free advice environment for their clients.

“Advice models have come under a great deal of scrutiny by the Royal Commission as well as the regulators and the community,” said Lonsec CEO Charlie Haynes.

“The Royal Commission may have stopped short of a ban on vertically integrated or conflicted financial advice, but advisers know they need to start moving quickly in this direction to meet community expectations.”

While it is becoming increasingly unpalatable for licensees or advisers to charge portfolio management fees for in-house managed accounts, advisers are also cognisant of regulatory developments.

An empowered ASIC is investigating how platform providers ensure the integrity of managed accounts constructed by advice licensees who might lack the expertise or resources to act as specialist investment managers.

For many advisers, the question is how best to manage conflicts, either by outsourcing the portfolio construction process or introducing a greater degree of independence in their investment decisions.

Lonsec is proposing to acquire the investment management rights from existing managed account providers, enabling them to focus on the provision of advice without conflict.

Licensees have the flexibility to retain their existing branding, investment mandate and platform, or transition to Lonsec’s own professionally managed portfolios incorporating best ideas and insights from Australia’s leading investment product research house.

“An outsourced managed account solution is becoming increasingly popular, not just in order to reduce conflicts but to allow advisers to focus on their clients’ needs and aspirations while leaving the investment process to specialised portfolio managers,” said Mr Haynes.

With Australia’s economic expansion under threat, house prices falling, and a wave of people set to retire over the next decade, financial advisers are under pressure to provide advice and solutions that can withstand Australia’s future retirement challenges.

Lonsec’s Retire program addresses the growing need for the financial services industry to work together to come up with those solutions and strategies.

Lonsec has been running its successful Retire program for more than five years, and it continues to go from strength to strength. The schedule of content and events planned for the next 12 months is the largest yet, with nine Retire Partners now on board to deliver in-depth retirement insights, including:                          

Alliance Bernstein Fidelity      Legg Mason
Allianz Retire+  Invesco  Pendal
Challenger Investors Mutual  Talaria

Lonsec’s Retire Partners will be providing a wealth of content to help advisers understand and deal with a range of issues faced by advisers and their clients.

The program will really kick off on May 7th with the major Lonsec Symposium event at the Westin, Sydney. With more than 600 advisers and wealth managers already registered, along with an impressive line-up of high-profile speakers and industry leaders, this is a must-attend event for all retirement professionals.

Mention the property market to Australian investors and the first thing they probably think of is the collapse in residential property values. These price falls are the result of a number of factors, some of which have also negatively affected Australian listed property (or A-REITs), while themes such as low wages growth and higher household indebtedness have had a significant impact on retail businesses and their landlords. The rise of online juggernauts like Amazon have further added to the pressure. But despite the challenges, listed property has held up remarkably well as a diversified source of income and capital growth.

The S&P/ASX 300 A-REIT index overall has delivered an impressive 26% return over the year to March, outperforming local and global shares. With retail assets representing almost 46% of the index, the underperformance of this sector is certainly more pronounced. With retail sales growth currently around 3.0% per annum—well below peak years over the last decade of over 5.6% and the average 3.6%—this is translating into weaker rental growth and higher capital expenditure to improve patronage at shopping centres. In general, the super-regional centres will continue to adapt well and neighbourhood (food-based) centres are also reasonably placed, while it is the smaller shopping centres and retail strips that are most vulnerable.

But while retail has struggled, other sectors have stepped up. Leading the way in terms of A-REIT earnings has been the diversified and industrial REITs, particularly those with funds management businesses. Charter Hall Group (+38% for the March quarter) and Amazon’s landlord Goodman Group (+26%) came out on top following similar gains over calendar year 2018. Lonsec notes that the elevated earnings of funds management (boosted by performance fees from cyclical high returns) and development activities can disappear when the cycle turns, as can the premium ratings for such stocks.

Nevertheless, Australian commercial property is being underpinned by a growing economy and infrastructure spending is benefiting the Sydney office sector in particular. Income growth of around 5.0% is expected for FY19, however the outlook is for some easing in rental growth (Sydney and Melbourne) with signs of recovery in Brisbane and Perth. Capitalisation rates are now at or below previous cyclical troughs (pricing peaks) and the next supply wave is 18–24 months away (new space predominantly pre-committed).

A-REITs versus shares (growth of $10,000 over five years)

Source: Financial Express, Lonsec

Even those A-REITs with residential exposure are still expecting a better second half of FY19 from previous sales coming through. However, the market is expecting a 10–20% fall in FY20 sales given the soft secondary residential price market, tighter lending, and potential changes to negative gearing for investors should the Labor Party win government at the 18 May federal election.

Nonetheless, Australia remains attractive for international and local investors, with one of the highest REIT market dividend yields of 4.7% and a +2.9% spread to 10-year bonds. The Australian dollar has been relatively steady during the March quarter. Given the recent in rise in A-REIT prices, valuations overall for the sector are around a 10% premium to NAV3 (although the pricing between sectors has retail/residential at a discount and office/industrial at a premium).

A-REIT member price gains (12 months to 31 March 2019)

Source: Bloomberg, Lonsec

Turning to the overseas market and Lonsec has observed some similar themes, but the macro setting has had a major influence, with bond rates continuing to soften in the March quarter and expectations of interest rate rises pushed back. As China-US trade war tensions eased, listed markets recovered from the December quarter pullback and more than made up for the negative returns of calendar year 2018. The discount that listed property markets were trading at has now dissipated and the sector is trading more in line with private market valuations.

The fundamentals in developed property markets remain much the same, with demand from tenants in retail assets the weakest and major retailers sporadically trimming outlet numbers or completely closing down. Investment performance from retail shares continues to lag, especially the industrial and logistics sector, which is attracting investment to improve the supply lines on the back of expanding online channels.

It is yet to be seen whether counter-cyclical investors that are chipping away at the deep value offered by retail property shares (especially the higher quality ones) will reap the benefits of an eventual normalising of relative values. Some fund managers believe there has been a permanent shift in investor valuations towards the industrial/logistics property sector. Lonsec is still of the view that global property markets are in the mature part of the cycle, although the tail end is being extended while inflation and interest rate pressures are kept at bay.

Some investors baulk at the thought of investing in listed property in an environment of rising interest rates, a softening residential housing market, and the rise of competition from the online world. While listed property is traditionally a defensive asset class with a negative correlation to bond yields, the sector has shown it is able to deliver in this environment, and the asset class has remained critical to investor portfolios as a means of achieving diversification and reliable income streams. While some sectors have certainly come under pressure, as a whole listed property has been a truly understated performer.

IMPORTANT NOTICE: This document is published by Lonsec Research Pty Ltd ABN 11 151 658 561, AFSL 421 445 (Lonsec).

Please read the following before making any investment decision about any financial product mentioned in this document.

Warnings: Lonsec reserves the right to withdraw this document at any time and assumes no obligation to update this document after the date of publication. Past performance is not a reliable indicator of future performance. Any express or implied recommendation, rating, or advice presented in this document is a “class service” (as defined in the Financial Advisers Act 2008 (NZ)) or limited to “general advice” (as defined in the Corporations Act (C’th)) and based solely on consideration of data or the investment merits of the financial product(s) alone, without taking into account the investment objectives, financial situation and particular needs (“financial circumstances”) of any particular person.

Warnings and Disclosure in relation to particular products: If our general advice relates to the acquisition or possible acquisition or disposal or possible disposal of particular classes of assets or financial product(s), before making any decision the reader should obtain and consider more information, including the Investment Statement or Product Disclosure Statement and, where relevant, refer to Lonsec’s full research report for each financial product, including the disclosure notice. The reader must also consider whether it is personally appropriate in light of his or her financial circumstances or should seek further advice on its appropriateness. It is not a “personalised service” (as defined in the Financial Advisers Act 2008 (NZ)) and does not constitute a recommendation to purchase, hold, redeem or sell any financial product(s), and the reader should seek independent financial advice before investing in any financial product. Lonsec may receive a fee from Fund Manager or Product Issuer (s) for reviewing and rating individual financial product(s), using comprehensive and objective criteria. Lonsec may also receive fees from the Fund Manager or Financial Product Issuer (s) for subscribing to investment research content and services provided by Lonsec.

Disclaimer: This document is for the exclusive use of the person to whom it is provided by Lonsec and must not be used or relied upon by any other person. No representation, warranty or undertaking is given or made in relation to the accuracy or completeness of the information presented in this document, which is drawn from public information not verified by Lonsec. Conclusions, ratings and advice are reasonably held at the time of completion but subject to change without notice. Lonsec assumes no obligation to update this document following publication. Except for any liability which cannot be excluded, Lonsec, its directors, officers, employees and agents disclaim all liability for any error, inaccuracy, misstatement or omission, or any loss suffered through relying on the information.

Copyright © 2019 Lonsec Research Pty Ltd, ABN 11 151 658 561, AFSL 421 445. All rights reserved. Read our Privacy Policy here.

The Fed may have put its tightening plans on ice, but the yield curve is signalling that all may not be well in financial markets.
This article is intended for licensed financial advisers only and is not intended for use by retail investors.

The Fed may have put its tightening plans on ice, but the yield curve is signalling that all may not be well in financial markets. Yields on US government bonds have been moving lower since December 2018, when the Fed responded to market concerns by moving to a ‘neutral’ stance, thereby delaying further tightening. But the rate at which longer-term yields have fallen in response has ended up fulfilling the market’s fear of a yield curve inversion, which is traditionally a predictor of an economic recession—and a fall in equity markets.

Fears of a flattening or inverting yield curve cropped up about a year ago in March 2018, but back then yields were on the way up, with expectations of future Fed tightening and a gradual rise in inflation prompting investors to reassess long-term interest rates. While the 10-year yield moved higher, shorter-term rates also rose in line with the Fed’s tightening path, producing a very flat looking yield curve. The situation now is a bit different—the yield curve did indeed invert in April this year, at least across the 3-month to 10-year portion of the curve, but remains upward sloping beyond that range. Compare this to the shape of the yield curve during the previous tightening phase (way back in 2004) and things certainly look different this time around.

Inverted vs flat vs ‘normal’

Source: US Treasury, Lonsec

Is the yield curve still relevant?

If you went to university before the global financial crisis, you would have been taught that a yield curve with a positive slope is a sign of a healthy economy and healthy markets, and traditionally this has certainly been the case—a steepening yield curve generally means investors expect rising inflation and stronger economic growth. In contrast a flat or inverted yield curve means short-term inflation expectations have accelerated relative to longer-term expectations, pointing to low growth and a heightened risk of recession.

Today, things are not quite so straightforward. With the advent of quantitative easing and record low interest rates, as well as structural transformations taking place within economies, the power of the yield curve as a predictor of doom has been brought into question. In fact, some argue there is a risk in overreacting to what could possibly be a false signal. In the world of statistics there are two broad errors humans can make, known as Type I and Type II errors. We risk making a Type I error if we believe the recession signal to be true when it is in fact false. On the other hand, if we assume everything is fine and that the yield curve can be safely ignored, we risk committing a Type II error if the signal is in fact valid. Unfortunately, the elimination of both types of error is impossible.

The US 10-year yield fell as the Fed gave way to market fears

Source: Bloomberg, Lonsec

The yield curve has been an area of recent focus at the Fed and the academic community, but even among some of the world’s leading economists there is no consensus. The San Francisco Fed contends that an inverted curve continues to be a predictor of recessions (especially the 3-month to 10-year curve), while former Fed chair Janet Yellen among others believes that, given abnormally low cash rates, this time it’s different. Inverted yield curves have occurred on only eight occasions since 1958. The US economy has slipped into a recession within two years of an inverted yield curve more than two-thirds of the time. While this is a well-known phenomenon, investors have always debated whether an inverted yield curve is truly reflective of fundamentals or whether it is nothing more than a spurious correlation (although possibly one with the power to create a self-fulfilling prophesy).

April’s inversion contributed to a rally in bonds, although this proved short-lived as the curve quickly moved back into positive territory. Markets subsequently priced in a full Fed cut by the end of 2019 and a second cut by the end of 2020. It might be tempting to gloss over the yield curve in this situation, especially while other indicators of market health—like credit spreads and balance sheet quality—are pointing to a relatively benign outlook. But the empirical power of the yield curve does have historical validity, and while there are plenty of theories about why this time is different, these theories are untested because there are no other periods that can emulate the extraordinary nature of monetary policy in the decade following the GFC.

Very low or negative spreads can signal a fall in equities

Source: Bloomberg, Lonsec

One measure of the yield curve is the spread between 2-year and 10-year Treasury yields. Historically, when this spread has been very low or negative, an economic slowdown and a downturn in equities has followed within 18 to 24 months. As the chart above shows, a negative spread has proved a reliable indicator of economic as well as equities downturns in recent times. For those arguing that the yield curve is now less relevant than it has been in the past, the onus lies on them to explain why this relationship has broken down. Of course, only time will tell if things really are different this time around.

This article has been prepared for licensed financial advisers only. It is not intended for use by retail clients (as defined in the Corporations Act 2001) or any other persons. This information is directed to and prepared for Australian residents only. This information may constitute general advice. It has been prepared without taking account of an investor’s objectives, financial situation or needs and because of that an investor should, before acting on the advice, consider the appropriateness of the advice having regard to their personal objectives, financial situation and needs.

It’s been an interesting period for risk assets over the past six months. The last quarter of 2018 saw markets retract as sentiment shifted away from risk assets, driven by fears of further rate rises in the US and a pullback in global growth. Roll forward to the March quarter of 2019 and it has been risk on for equities, with both Australian and global markets posting double-digit returns for the quarter.

The key catalyst for the reversal in trend was the US Federal Reserve’s announcement that they plan to keep rates on hold until further notice. Interest rate markets adjusted their expectations, implying that rates may even drop by the end of 2020. It highlights the significant influence the Fed has on market sentiment despite market fundamentals not materially changing.

For some time we have been communicating that we are in the later stages of the cycle. The latest recovery may well be a late-cycle market rally, but either way the extended tail of the cycle is still wagging. Our medium-term view remains that returns will be lower as markets become increasingly constrained by the late stage of the cycle and tighter liquidity. We also believe that market volatility will increase and that valuation opportunities will present themselves as some markets retract. A good example of this has been emerging market equities, where valuation support has been increasing for the sector following a pullback during 2018.

Based on our internal valuation model we believe that the sector offers value and that the expected returns compensate for the additional risk associated with emerging markets equities over the medium term. Conversely, we have reduced our exposure to Australian equities, noting a softening in company earnings and broader market implications associated with the housing slowdown.

This article has been prepared for licensed financial advisers only. It is not intended for use by retail clients (as defined in the Corporations Act 2001) or any other persons. This information is directed to and prepared for Australian residents only. This information may constitute general advice. It has been prepared without taking account of an investor’s objectives, financial situation or needs and because of that an investor should, before acting on the advice, consider the appropriateness of the advice having regard to their personal objectives, financial situation and needs.

Last night Treasurer Frydenberg handed down his first budget a month before the regular budget season. With the possibility of a May election, this budget is as much a political statement as an economic one, with tax measures to please key voter groups, a further boost to infrastructure spending, and the much-vaunted return to surplus. But the implementation of these measures depends on the re-election of the current government, while the surplus itself remains at the mercy of the economic outlook.

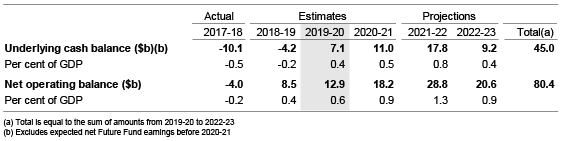
The long-awaited surplus

As expected, the underlying cash balance is forecast to return to a surplus of $7.1 billion in 2019-20, or 0.4% of GDP. Revenue growth is being driven by an improving economy, and a surplus may even be achieved slightly sooner than expected given the rise in commodity prices (especially iron ore) and associated company tax receipts.

Budget aggregates


Source: Budget 2019-20

The Budget also forecasts that the surplus will be maintained through the four-year period. However, these forecast surpluses remain small at less than 1.0% of GDP and are based on a range of assumptions. If the global and domestic economies slow, or if the government is not as frugal as it expects to be, the slim surpluses could easily be eroded.

Commonwealth revenue and expenses (% GDP)
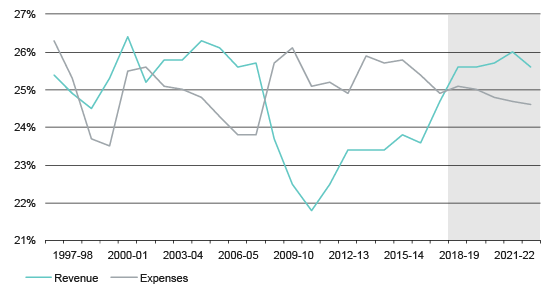

Source: Treasury

Income tax cuts

Another key selling point of this Budget is the income tax cuts, both to low- and middle-income earners and high-income earners. The Low and Middle Income Tax Offset (LMITO) will be more than doubled from $445 to $1,080 for this financial year. From 2022-23, the Government will increase the top threshold of the 19% tax bracket from $41,000 to $45,000 and increase the Low Income Tax Offset (LITO) from $645 to $700.

These measures have promised more than what the opposition proposed and are designed to peel low- and middle-income voters away from Labor. These measures are likely to be passed in parliament with oppposition support given many of the measures align with Labor policies, but it will be interesting to see Labor’s response to match these.

The long-term tax changes will take effect from July 2024 and will see a reduction in the marginal rate from 32.5% to 30% for those earning between $45,001 and $200,000. Tax changes this far out will inevitably be subject to future changes and election bargaining, and will likely not receive Labor’s support given their opposition to tax cuts for wealthier Australians.

Taxation receipts (% GDP)
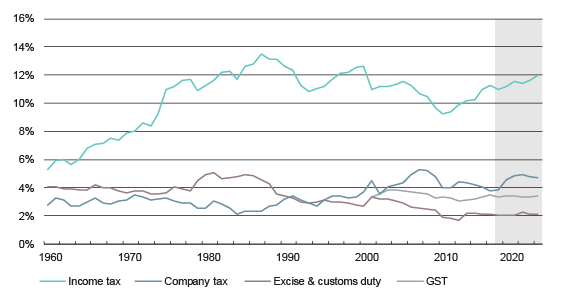

Source: Treasury

Infrastructure spending boost

Infrastructure spending for the next ten years has been increased from $75 billion to $100 billion, or around 0.4% of GDP. This is a small increment from the already committed infrastructure spending and a lot of the money is scheduled for the outer years. Some of the bigger projects include the $2 billion fast rail from Geelong to Melbourne, the $3.5 billion Western Sydney Rail, the $1.6 billion M1 Extension in NSW, the $1.5 billion North-South Corridor in SA, and the $800 million Gateway Motorway upgrade in QLD.

Economic outlook is still shaky

While the budget has delivered a surplus, it remains at the mercy of the economic outlook. The Government is assuming GDP growth of 2.25% this financial year, and 2.75% for the next two years. It also assumes the unemployment rate will remain at 5.0% until 2020-21 and that wages growth will pick up to 3.25% in 2020-21. While the labour market remains strong and is likely to continue to improve further, the wages growth assumption seems optimistic.

The Budget also forecasts inflation to return to 2.5% in 2020-21. This also seems overly optimistic and will likely be revised down again given that wages growth has been incredibly modest despite a tightening labour market. Australia’s GDP growth also faces a range of external uncertainties, including a slowdown in our biggest trading partner China, a slowdown in Europe, and geopolitical risks including Brexit and China-US trade tensions. Overall the economic outlook remains subdued.

Implications for the Australian dollar, RBA and financial markets

The RBA left the cash rate unchanged at 1.5% at its April meeting, however the easing bias saw the Australian dollar trade lower. In contrast, the Budget failed to move the dollar as markets had anticipated the surplus and there were no surprises in the budget measures. While income tax cuts and infrastructure spending—as well as other spending on education and health—are supportive of the economy, there is little in the Budget to boost productivity or shift the economic fundamentals. This means the RBA will likely remain in wait-and-see mode before deciding on the next rate move.

Australia holds on to its AAA rating

Australian general government net debt has been increasing since 2010 but is forecast to peak at 19.2% of GDP in 2018-19. The expected return to surplus and improvement in our fiscal position had already seen Standard & Poors lift its outlook for Australian sovereign debt from ‘negative’ to ‘stable’ back in September 2018. With few surprises in this Budget, Australia is likely to maintain its coveted AAA rating, along with only a handful of other countries.

At below 20%, its net debt-to-GDP ratio remains in the middle of the pack compared to other AAA-rated economies, while the average for advanced economies is higher at a 70% ratio. Holding onto the AAA rating means the Australian government can continue borrowing at cheaper interest rates (compared to lower-rated peers), with the rating favourably affecting the state and local governments as well as Australia’s banks, which tend to be rated one or a few notches below the sovereign credit rating.

Net government debt in advanced economies (% GDP)


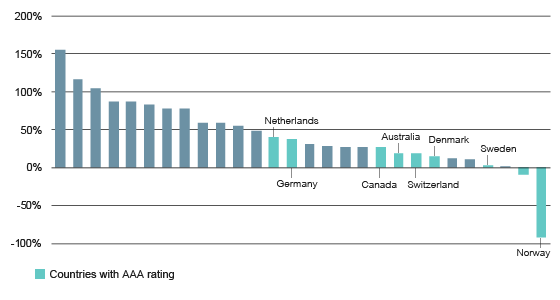
Source: IMF World Economic Outlook Database, October 2018; Bloomberg

This is an election budget containing few surprises. A return to surplus is undoubtedly welcomed, but the forecast surpluses are slim and vulnerable to the economic outlook. This Budget does not change the economic outlook for Australia, meaning the RBA will remain in wait-and-see mode with an easing bias. While the Budget contains many measures to please the electorate, it remains unclear whether they will be implemented, especially the long-term tax changes. With a federal election looming, it will also be interesting to see the response from Labor, which currently leads the government in the opinion polls.

IMPORTANT NOTICE: This document is published by Lonsec Research Pty Ltd ABN 11 151 658 561, AFSL 421 445 (Lonsec).

Please read the following before making any investment decision about any financial product mentioned in this document.

Warnings: Lonsec reserves the right to withdraw this document at any time and assumes no obligation to update this document after the date of publication. Past performance is not a reliable indicator of future performance. Any express or implied recommendation, rating, or advice presented in this document is a “class service” (as defined in the Financial Advisers Act 2008 (NZ)) or limited to “general advice” (as defined in the Corporations Act (C’th)) and based solely on consideration of data or the investment merits of the financial product(s) alone, without taking into account the investment objectives, financial situation and particular needs (“financial circumstances”) of any particular person.

Warnings and Disclosure in relation to particular products: If our general advice relates to the acquisition or possible acquisition or disposal or possible disposal of particular classes of assets or financial product(s), before making any decision the reader should obtain and consider more information, including the Investment Statement or Product Disclosure Statement and, where relevant, refer to Lonsec’s full research report for each financial product, including the disclosure notice. The reader must also consider whether it is personally appropriate in light of his or her financial circumstances or should seek further advice on its appropriateness. It is not a “personalised service” (as defined in the Financial Advisers Act 2008 (NZ)) and does not constitute a recommendation to purchase, hold, redeem or sell any financial product(s), and the reader should seek independent financial advice before investing in any financial product. Lonsec may receive a fee from Fund Manager or Product Issuer (s) for reviewing and rating individual financial product(s), using comprehensive and objective criteria. Lonsec may also receive fees from the Fund Manager or Financial Product Issuer (s) for subscribing to investment research content and services provided by Lonsec.

Disclaimer: This document is for the exclusive use of the person to whom it is provided by Lonsec and must not be used or relied upon by any other person. No representation, warranty or undertaking is given or made in relation to the accuracy or completeness of the information presented in this document, which is drawn from public information not verified by Lonsec. Conclusions, ratings and advice are reasonably held at the time of completion but subject to change without notice. Lonsec assumes no obligation to update this document following publication. Except for any liability which cannot be excluded, Lonsec, its directors, officers, employees and agents disclaim all liability for any error, inaccuracy, misstatement or omission, or any loss suffered through relying on the information.

Copyright © 2019 Lonsec Research Pty Ltd, ABN 11 151 658 561, AFSL 421 445. All rights reserved. Read our Privacy Policy here.

In recent years valuations across most asset classes have been sitting in the expensive range. Strong tailwinds from central banks in the form of low interest rates and liquidity support via quantitative easing have largely been responsible for these stretched valuations, while markets have been further fuelled by both strength in the cycle as well as shorter-term positive sentiment.

However, we are currently witnessing a shift in market dynamics as central banks move away from quantitative easing and interest rates gradually move higher from their previous historic lows. Cyclical indicators such as production figures and the output gap are also tapering off and shorter-term sentiment has moved into negative territory. This has resulted in increased volatility in markets and some asset classes retreating from their previous highs.

At the end of 2017 emerging market equities was one of the best performing sectors in the market, with the index (MSCI Emerging Markets TR Index AUD) returning just over 27% for the year. Roll forward one year and the sector was one of the worst performing, with returns of -4.7% as at the end of 2018. The sector has suffered amid concerns of a Chinese slowdown, a strengthening US dollar and other idiosyncratic country-specific issues which have seen large flows out of the sector.

Despite the negative news from a valuation perspective, Lonsec’s proprietary internal rate of return (IRR) model is signalling that the emerging market equities sector is beginning to present value from an absolute as well as asset class relative basis. Our analysis indicates that the valuation support for the sector has continued and the sector now offers a significant premium above developed markets. While risks remain in the sector and the threat of a China slowdown continues to be a topic of debate, in our view the emerging markets sector offers an attractive return premium relative to developed markets, warranting an active tilt to the sector.

Responding to market movements with Dynamic Asset Allocation

Our Dynamic Asset Allocation approach means we can be flexible across asset classes and adjust asset allocation positions for the medium term to navigate market changes. We recently reflected our view of the emerging markets opportunities by making changes to our Multi-Asset and Listed Diversified Managed portfolios and increasing our exposure to the emerging markets sector ahead of developed markets.

The date for Britain’s departure from the European Union is still very much TBC. Prime Minister May went to Brussels to ask for an extension beyond the 29 March deadline, and assuming a deal is finally agreed to by the House of Commons, Britain will have until 22 May to complete the withdrawal. If a deal doesn’t pass, the cliff-edge is moved back to 12 April.

While the British parliament is adamant that a no-deal scenario must be avoided, a ‘hard Brexit’ remains on the cards so long as no deal is forthcoming. Then again, even if a deal is made, it is difficult to know what the ramifications will be for markets and the economy. Given the event risk this represents, Lonsec has surveyed the global equities universe to create an overview of product exposures for the UK and Europe. The UK represents 6.2% of the MSCI World ex Australia Index and the EU countries ex-UK represent 16.3%. In short, at least one fifth of the index is directly exposed to Brexit.

These exposures presented below represent a point-in-time snapshot (December 2018) and are subject to change as these are actively managed strategies. It is worth noting that any adverse outcomes for fund managers who are over- or under-exposed to the UK and Europe could be largely offset by subsequent currency movements.

Several managers have significant UK and EU exposure

The below chart shows global equity funds with greater than 10% exposure to the UK. For comparative purposes, the reference index’s composition includes 6.2% exposure to the UK.

Global equity fund managers’ European exposure (%)

Global equity fund managers’ European exposure (%)
Source: Lonsec

Value managers tend to have the highest Brexit exposure

The below chart demonstrates the propensity for ‘value’ managers to be overweight UK domiciled securities. Value investors typically target stocks which they deem to be trading at below their intrinsic value and are therefore not representative of the company’s long-term fundamentals. Lonsec posits that this could be reflective of the harsh depreciation that UK securities have experienced during the Brexit fiasco, which on this metric could be looking attractive to ‘value’ orientated investors.

Average UK exposure by sub-sector (%)

Value managers tend to have the highest Brexit exposure
Source: Lonsec

Location of fund manager’s HQ can create an investment bias

The below chart illustrates the proclivity for global equity fund managers domiciled in the UK to be overweight domestic equities. This may be reflective of a home bias which is common for fund managers due to the greater familiarity and understanding of their domestic market.

Office locations of managers with >10% UK exposure

10% UK exposure” width=”561″ height=”301″ class=”alignnone size-full wp-image-5666″ style=”margin: 0;” />

Source: Lonsec

Protecting against Brexit chaos

Given the significance of the European and UK markets, the Brexit issue is not one that investors can afford to completely ignore. The challenge, however, is not in the evaluation of the risks associated with different outcomes but in managing the uncertainty involved in determining both the market’s reaction to developments and the short- and medium-term economic impacts. For wealth managers who recommend global exposure for their clients, this creates an extra layer of complexity in determining appropriate investment products and asset allocations.

The Brexit issue, along with other geo-political risks, are actively considered by Lonsec’s investment committees and feed into our model portfolio weights. Addressing these challenges requires a diverse mix of expertise, combining macro-economic, portfolio management, and research capabilities. For those interested in the broader topic of managing uncertainty in a portfolio context, our upcoming Lonsec Symposium is a must-attend event that will draw on the knowledge of Australia’s leading strategists and retirement experts.

IMPORTANT NOTICE: This document is published by Lonsec Research Pty Ltd ABN 11 151 658 561, AFSL 421 445 (Lonsec).

Please read the following before making any investment decision about any financial product mentioned in this document.

Warnings: Lonsec reserves the right to withdraw this document at any time and assumes no obligation to update this document after the date of publication. Past performance is not a reliable indicator of future performance. Any express or implied recommendation, rating, or advice presented in this document is a “class service” (as defined in the Financial Advisers Act 2008 (NZ)) or limited to “general advice” (as defined in the Corporations Act (C’th)) and based solely on consideration of data or the investment merits of the financial product(s) alone, without taking into account the investment objectives, financial situation and particular needs (“financial circumstances”) of any particular person.

Warnings and Disclosure in relation to particular products: If our general advice relates to the acquisition or possible acquisition or disposal or possible disposal of particular classes of assets or financial product(s), before making any decision the reader should obtain and consider more information, including the Investment Statement or Product Disclosure Statement and, where relevant, refer to Lonsec’s full research report for each financial product, including the disclosure notice. The reader must also consider whether it is personally appropriate in light of his or her financial circumstances or should seek further advice on its appropriateness. It is not a “personalised service” (as defined in the Financial Advisers Act 2008 (NZ)) and does not constitute a recommendation to purchase, hold, redeem or sell any financial product(s), and the reader should seek independent financial advice before investing in any financial product. Lonsec may receive a fee from Fund Manager or Product Issuer (s) for reviewing and rating individual financial product(s), using comprehensive and objective criteria. Lonsec may also receive fees from the Fund Manager or Financial Product Issuer (s) for subscribing to investment research content and services provided by Lonsec.

Disclaimer: This document is for the exclusive use of the person to whom it is provided by Lonsec and must not be used or relied upon by any other person. No representation, warranty or undertaking is given or made in relation to the accuracy or completeness of the information presented in this document, which is drawn from public information not verified by Lonsec. Conclusions, ratings and advice are reasonably held at the time of completion but subject to change without notice. Lonsec assumes no obligation to update this document following publication. Except for any liability which cannot be excluded, Lonsec, its directors, officers, employees and agents disclaim all liability for any error, inaccuracy, misstatement or omission, or any loss suffered through relying on the information.

Copyright © 2019 Lonsec Research Pty Ltd, ABN 11 151 658 561, AFSL 421 445. All rights reserved. Read our Privacy Policy here.

Over the past few months Lonsec has seen a noticeable increase in the number of fund managers seeking to bring alternative products to the market. This trend has been largely driven by market factors, with investors anticipating a period of increased volatility, lower returns, and a challenging valuation environment for key asset classes, which have remained at fair to expensive levels for a number of years.

The ability of alternative asset managers to provide diversification to traditional asset classes, as well as achieve positive absolute returns during market downturns, is an attractive proposition, especially for those who believe the market has reached a turning point. Fund managers have been keen to offer their own solutions, ranging from market neutral and risk premia strategies, to global macro and liquid alternatives.

The appeal of alternatives is due in no small part to their track record during the global financial crisis, which saw strategies like managed futures deliver positive returns even as market panic reached its crescendo. As the chart below shows, global managed futures funds like the Winton Global Alpha Fund outperformed global shares, which remained beaten down for around four years after the GFC.

Managed futures outperformed following the GFC

Source: Lonsec

The Winton Global Alpha Fund, which is a managed futures strategy for example generated 25.6% for the year ending 2008 compared to global equities which generated -26% (MSCI AC World ex Australia TR Index AUD). However, as the chart also shows, extrapolating such exceptional performance into the future is dangerous and can lead to a mismatch between expectations and reality.

Diversification does not mean downside protection

While certain alternative strategies performed exceptionally well during the GFC, most financial advisers will tell you that recent performance has been mixed at best. The chart below shows rolling three-year returns for a range of alternative strategies, including multi-asset strategies (Invesco and Aberdeen) and managed futures (AQR and Winton).

Performance has been divergent, highlighting the heterogenous nature of alternative assets even among similar strategies. Some alternatives products have generated negative returns during periods when equity markets were relatively strong and have also struggled to protect capital in down markets.

Managed futures have struggled in recent years

Source: Lonsec

This brings us to the major issue investors must understand when thinking about alternatives: diversification is not downside protection. Alternative assets may provide protection in certain market environments, and certainly there have been periods when this has been the case, with the GFC being the most powerful case study. But when markets are volatile and there is no clear trend, investors should not expect alternatives to rescue their portfolio.

Take managed futures as an example. These strategies seek to identify price trends across a range of asset classes (equities, bonds, commodities and currencies), using futures contracts to take long and short positions. A key contributor to the underperformance of these strategies in recent periods has been the lack of persistent trends within these asset classes. In the case of multi-asset strategies, the lack of market volatility (at least until very recently) has made it challenging to generate alpha through relative value trades.

A better way to incorporate alternatives in your portfolio

Despite some common misconceptions, alternatives can be an invaluable part of your portfolio if you understand what they can and cannot do. Indeed, alternatives are a mainstay of many institutional portfolios, as well as major not-for-profits like some of the big US college endowment funds. We don’t have to look far afield to Australia’s own sovereign wealth fund, which has significant exposure to alternative assets. As at the end of 2018, 14.6% of the Future Fund’s assets were invested alternatives, which does not even include the allocations to private equity, property and infrastructure.

Future Fund asset allocation

As at December 2018

Source: Future Fund, Lonsec

Alternative assets provide a different source of returns to traditional assets, which can be beneficial to portfolios where there is heightened uncertainty and a risk of markets moving up and down. They may offer downside protection in certain environments, but they should not be positioned within a portfolio as an ‘insurance policy’ against down markets. Considering the market outlook over the next 12 months, we believe that markets will be characterised by periods of heightened volatility.

Central bank policy will continue to be a major driver of sentiment, and market reaction to themes such as the US-China trade war and Brexit will continue to contribute to volatility. If this is the case, then it will likely continue to be a challenging period for managed futures. Lonsec’s preference is to allocate to diversified multi-asset strategies that are in a position to take advantage of the increased volatility.

However, given the heavy reliance on manager skill in the sector, manager selection becomes a very important factor, and understanding exactly what individual strategies bring to a portfolio and how they may perform in different market environments is critical. This is the foundation of Lonsec’s research-driven approach to portfolio construction. Alternatives can be valuable source of alpha and diversification, but choosing the right products means understanding which individual strategies are likely to achieve your portfolio’s objectives.

This article has been prepared for licensed financial advisers only. It is not intended for use by retail clients (as defined in the Corporations Act 2001) or any other persons. This information is directed to and prepared for Australian residents only. This information may constitute general advice. It has been prepared without taking account of an investor’s objectives, financial situation or needs and because of that an investor should, before acting on the advice, consider the appropriateness of the advice having regard to their personal objectives, financial situation and needs.

Important information: Any express or implied rating or advice is limited to general advice, it doesn’t consider any personal needs, goals or objectives.  Before making any decision about financial products, consider whether it is personally appropriate for you in light of your personal circumstances. Obtain and consider the Product Disclosure Statement for each financial product and seek professional personal advice before making any decisions regarding a financial product.