Leading superannuation research house SuperRatings has analysed super fund performance in line with the government’s performance test criteria and found that 90% of trustee directed options are estimated to pass the test based on 30 June 2022 data.

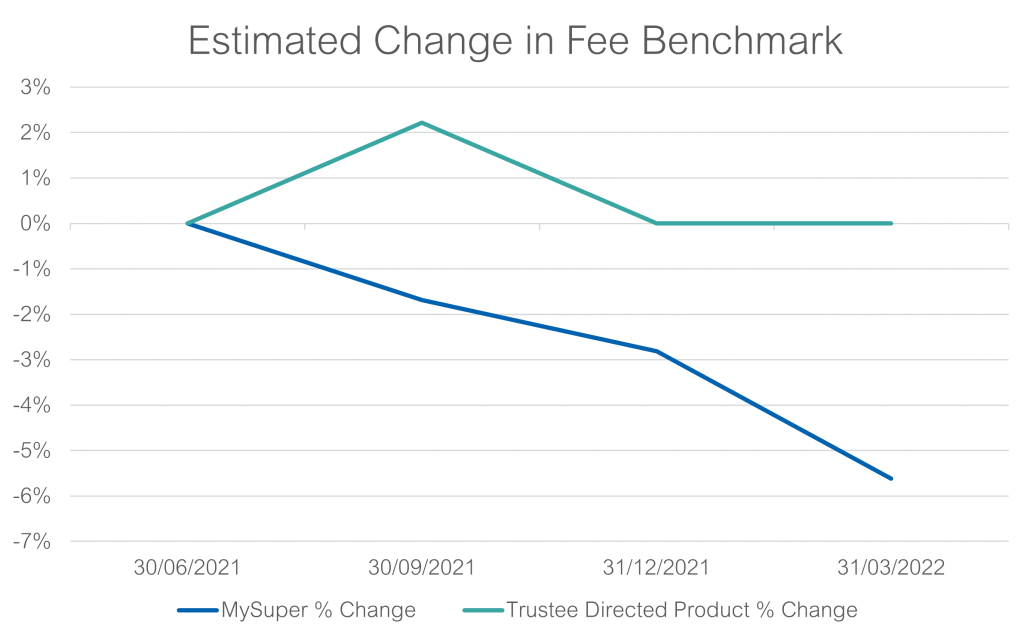
This is an improvement from the 31 March 2022 data which estimated that 20% of the options assessed would have failed the test. The volatile market over the second half of the financial year emphasised the importance of diversification and long-term strategy within superannuation investments, as funds experienced unique conditions relative to earlier periods in the eight-year assessment.

Option Type % Estimated to pass March 2022 % Estimated to pass June 2022
Capital Stable (20-40) 75% 88%
Conservative Balanced (41-59) 80% 91%
Balanced (60-76) 83% 93%
Growth (77-90) 84% 92%
High Growth (91-100) 74% 85%

The shift in the proportion of options passing the test also highlighted the impact a single quarter can have on reported performance test outcomes. Despite the limited ability of funds to improve upon eight-year performance over a short period of time, those who are close to failing the test need to ensure they position themselves as strongly as possible, as the rolling nature of the test means the test result is impacted by both performance today and from the same period eight years ago.

With the newly installed government delaying the expansion of the test beyond MySuper products until the results of the second round of assessments, and the test’s impact on the industry, has been reviewed, funds have some additional time to ensure their broader suite of offerings are in line with the government and regulator’s expectations. Of particular interest to the review should be that two funds which failed the test last year produced returns within the top 10 MySuper products for the 2021/22 financial year.

We expect that some products will likely fail the test a second time when the results are announced in late August, triggering the prevention of new members from joining these products, however with 10 of the 13 MySuper products that failed last year’s test having announced or completed mergers to date, the impact on members is expected to be minimal.

Balanced options shine in APRA’s performance test

Analysis of the SuperRatings SR50 Balanced Index using the newly developed PTiQ tool has found the median fund in the index exceeded the performance test benchmark by 0.95% (which is made up of 0.45% investment outperformance and the 0.50% underperformance threshold). More broadly, analysis of estimated results shows that Balanced options performed the best out of all option types assessed with 93% of Balanced options estimated to pass the test. Further, 69% of these options are estimated to meet or exceed the benchmark return with the remaining 24% being within the 0.5% underperformance range allowed by the test. As most Australians are invested in Balanced options the strong performance of this category should be reassuring for many fund members.

The final quarter saw an improvement in the proportion of options passing the test across all option types, however, high growth options, those with exposure of 91-100% growth assets and capital stable options, those with exposure between 20-40% growth assets remain comparatively more likely to fail the test with high growth options being the most at risk.

SuperRatings investigated the drivers of performance against the performance test and unsurprisingly found that allocations to unlisted property, diversified fixed interest, Australian and international shares had the greatest impact on whether an option passed the test or not.

The expansion of the performance test has been put on hold for 12 months, and changes to the test are likely to be eagerly anticipated; however, we believe that the test in some form is here to stay. We suggest providers remain focused on meeting their long-term strategic objectives in a manner that is consistent with passing the test. Of particular importance will be the impact of historically strong performance, given the rolling nature of the test and the short-term outlook around increased volatility and lower expected returns.

We expect funds will continue to refine their investment approach to cater for both the shifting market and to meet performance test and best financial interests duty outcomes. As the industry awaits the outcome of the performance test review, SuperRatings continues to use its comprehensive database and deep research capability to gain key insights into super fund performance and the future outlook for the industry.

With a huge array of government initiatives reshaping super in recent years, none was more keenly watched than the inaugural performance test of 80 MySuper products.

The regulator found that 13 of the 80 products assessed were deemed to have underperformed the benchmark by more than 50 basis points. Since August when the results were released, 77% of these providers have announced their intentions to either merge or exit the industry.

This year, we expect to see the second round of MySuper results likely causing some MySuper solutions to be prevented from accepting new members. This will be accompanied by the first assessment of Choice options under the test. SuperRatings has conducted analysis of the industry’s performance to 31 March 2022, using its newly developed Performance Test iQ tool. Analysis was completed on over 650 options across Trustee Directed Products, including Retail, Industry, Corporate, and Government funds, excluding MySuper products.

The results from our analysis suggest that approximately 20% of options were estimated to fail the test, which allows for annualised underperformance of the benchmark of up to 50 basis points.

Option Type % Estimated to Fail
Capital Stable (20-40) 25%
Conservative Balanced (41-59) 20%
Balanced (60-76) 17%
Growth (77-90) 16%
High Growth (91-100) 26%

Breaking down the analysis further, SuperRatings found that all option types are facing challenges. In particular, options with growth assets, such as equities, making up between 91-100% of assets held were most likely to fail the test, with 26% of these options estimated as failing based on performance over the 8 years to 31 March 2022. Capital Stable options with between 20-40% growth assets are also facing a challenge to pass the test, with around a quarter of these options estimated as failing.

As the performance test captures investment returns over an eight-year period, funds have limited ability to shift their relative long-term position against the benchmark. However, with the test only accounting for the most recent level of fees charged, funds do have the ability to make fee changes to improve their performance test outcomes.

SuperRatings has been tracking an estimate of the benchmark representative administration fees and expenses (RAFE) based on the performance test calculation. While the test appears to be having an impact in terms of reducing fees for the MySuper products which were tested last year, our analysis shows that the Trustee Directed Product RAFE has remained flat.


We observed a decline in the RAFE for MySuper products each quarter since the start of the financial year, however the Trustee Directed Product RAFE saw an increase in the September quarter, followed by a return to the same RAFE in December 2021 and has remained stable since.

Since the results of the first test were published, we have observed an increase in funds seeking to simplify their investment menus, as well as a faster pace of merger announcements and shorter times for mergers to reach completion. While there are clear cost savings for funds in managing fewer options, the benefits of member choice are real, with highly engaged members particularly valuing additional choice. We suggest funds take a balanced approach when assessing the viability of offering additional options to ensure members achieve the best possible retirement outcomes.

The first performance test has had a significant impact on the future of those products which failed. Having an industry wide benchmark gives funds a clear target with significant potential benefit for members, however ensuring the test is appropriately capturing the nuances of the range of investment options in the industry remains a challenge. The regulator will be releasing the results of its second annual performance test later this year, with the industry closely monitoring potential outcomes. As the industry awaits the results of the second test, SuperRatings continues to use its comprehensive database and deep research capability to gain key insights into super fund performance and the future outlook for the industry.

With half the country in what seems never ending rounds of lockdowns and pandemic fatigue setting in, one of the last things most Australians want to do is look at their Superannuation balances and investment options. That is, however, exactly what SuperRatings is wanting us to do, as neglecting your super or responding to short term market moves can have a detrimental effect on your super balance.

SuperRatings Executive Director Kirby Rappell says, ‘We looked at the impact of switching out of a balanced or growth option and into cash at the start of the pandemic and found that those with a balance of $100,000 in January 2020 and who switched to cash at the end of March would now be around $22-27,000 worse off than if they had not switched.’

This effect of switching into cash as a response to market turmoil is also seen when looking at returns over the past 15 years. In this period, a typical balanced Super option has risen substantially, with a balance of $100,000 in July 2006 accumulating to $247,557, more than doubling in size. Those members investing in a growth option have experienced an even stronger result, with a similar starting balance growing to $254,006. Share focused options have delivered the highest returns, with the median Australian shares option growing to $276,099 and the median international shares option growing to $271,051, though these types of options involve greater risks. Over the same period, a $100,000 balance invested in cash would only be worth $151,158 today.

When considering your Super options, you don’t need to go it alone as many Super funds provide advice and tools to their members. Says Mr Rappell, ‘Most funds will offer scaled advice for free or at a low cost, with members able to get advice on topics such as contributions, investment options, insurance in the fund and the transition to retirement.’ Scaled advice is general in nature so you will need to check if your situation and goals align with the advice.
Continues Mr Rappell, ‘For members who want more tailored advice, some funds will offer comprehensive advice that will also take into account your financial assets outside of superannuation.’ While there will be a cost associated with this comprehensive advice, most funds will allow the cost of the advice to be deducted from the superannuation account, just make sure you check any costs and how they can be paid before agreeing to get the advice.
Looking at more recent returns, balances continued to grow in July. The typical balanced option returned an estimated 1.3% over the month and 18.5% over the year. The typical growth option returned an estimated 1.3% for the month and the median capital stable option also increased 0.9% in the month.

Accumulation returns to July 2021

FYTD 1 yr 3 yrs (p.a.) 5 yrs (p.a.) 7 yrs (p.a.) 10 yrs (p.a.)
SR50 Balanced (60-76) Index 1.3% 18.5% 7.9% 8.4% 8.0% 8.6%
SR50 Capital Stable (20-40) Index 0.9% 7.8% 4.5% 4.5% 4.8% 5.3%
SR50 Growth (77-90) Index 1.3% 22.7% 9.2% 9.5% 8.9% 9.6%

Source: SuperRatings estimates

Pension returns were also positive in July. The median balanced pension option returned an estimated 1.3% over the month and 20.0% over the year. The median pension growth option returned an estimated 1.5% and the median capital stable option also rose an estimated 0.9% in the month.

Pension returns to July 2021

FYTD 1 yr 3 yrs (p.a.) 5 yrs (p.a.) 7 yrs (p.a.) 10 yrs (p.a.)
SRP50 Balanced (60-76) Index 1.3% 20.0% 8.4% 9.1% 8.5% 9.5%
SRP50 Capital Stable (20-40) Index 0.9% 8.6% 5.2% 5.2% 5.2% 5.9%
SRP50 Growth (77-90) Index 1.5% 24.4% 9.7% 10.3% 9.8% 10.6%

Source: SuperRatings estimates

Release ends


Warnings: Past performance is not a reliable indicator of future performance. Any express or implied rating or advice presented in this document is limited to “General Advice” (as defined in the Corporations Act 2001(Cth)) and based solely on consideration of the merits of the superannuation or pension financial product(s) alone, without taking into account the objectives, financial situation or particular needs (‘financial circumstances’) of any particular person. Before making an investment decision based on the rating(s) or advice, the reader must consider whether it is personally appropriate in light of his or her financial circumstances, or should seek independent financial advice on its appropriateness. If SuperRatings advice relates to the acquisition or possible acquisition of particular financial product(s), the reader should obtain and consider the Product Disclosure Statement for each superannuation or pension financial product before making any decision about whether to acquire a financial product. SuperRatings research process relies upon the participation of the superannuation fund or product issuer(s). Should the superannuation fund or product issuer(s) no longer be an active participant in SuperRatings research process, SuperRatings reserves the right to withdraw the rating and document at any time and discontinue future coverage of the superannuation and pension financial product(s).

Copyright © 2021 SuperRatings Pty Ltd (ABN 95 100 192 283 AFSL No. 311880 (SuperRatings)). This media release is subject to the copyright of SuperRatings. Except for the temporary copy held in a computer’s cache and a single permanent copy for your personal reference or other than as permitted under the Copyright Act 1968 (Cth.), no part of this media release may, in any form or by any means (electronic, mechanical, micro-copying, photocopying, recording or otherwise), be reproduced, stored or transmitted without the prior written permission of SuperRatings. This media release may also contain third party supplied material that is subject to copyright. Any such material is the intellectual property of that third party or its content providers. The same restrictions applying above to SuperRatings copyrighted material, applies to such third party content.

Veronica Klaus Head of Lonsec Investment Consulting spoke on a panel at the Professional Planner Researcher Forum in Sydney last week.

Veronica discussed the inconsistency and confusion around asset class definitions, which is one of the biggest issues confronting the industry. The way in which assets are defined as growth, defensive, etc. often lacks transparency and ultimately makes it harder for financial advisers to make the right recommendations for their clients.

However, as Veronica explains, the superannuation funds aren’t necessarily the ones to blame for the problem.


After almost 30 years since the introduction of compulsory superannuation in Australia, many practitioners have called for a review of the superannuation guarantee (SG) system before the legislated increase in employers’ compulsory contributions from 9.5% to 12% by 2025. These increases are:

 Period Super Guarantee (%)
 1 July 2002 – 30 June 2013 9.00
 1 July 2013 – 30 June 2014 9.25
 1 July 2014 – 30 June 2021 9.50
 1 July 2021 – 30 June 2022 10.00
 1 July 2022 – 30 June 2023 10.50
 1 July 2023 – 30 June 2024 11.00
 1 July 2024 – 30 June 2025 11.50
 1 July 2025 – 30 June 2026 onwards 12.00

Source: Australian Tax Office

The case against

The Grattan Institute recently published research showing that higher SG contributions would not be in the interests of many working Australians as many middle-income workers would give up wages of up to 2.5 per cent while working, in exchange for less than a 1 per cent boost to their retirement incomes. Grattan argues almost all the extra income from a higher super balance at retirement would be offset by lower age pension payments, due to the pension assets test. Pension payments themselves would also be lower under a 12 per cent super regime, because they are benchmarked to wages, which would be lower if employers contributed more to super. Grattan calculates that lifting compulsory super from 9.5% of wages to 12% would make the typical worker up to $30,000 poorer over their lifetimes.

Not surprisingly, these findings have sparked fierce debate amongst industry practitioners, with some questioning the assumptions made by the Grattan Institute, contending their calculations are based on people working until age 67 when in fact many retire before this for numerous reasons. The adequacy of the ASFA retirement standards is also a point of difference between protagonists. Grattan contends the ASFA retirement standards would mean many retirees would be significantly better off in retirement and this was not the purpose of super. Grattan’s research showed that most people reaching retirement would achieve 70 per cent of the income they had while they worked, a reasonable outcome given that in retirement most people have lower costs with children having left home and many without mortgages.

The case for

According to the Committee for Sustainable Retirement Incomes analysis, for those not eligible for an age pension (likely to be at least 40% of retirees into the future), maintaining pre-retirement living standards will require contributions of 15-20% (18% is the OECD average); for those eligible for some age pension, the contribution rate required will be lower but, even at typical earnings, would most likely be more than 12%.

Mercer contends Australia’s retirement system is not up to the standard of better systems overseas and still required the SG to move to 12% to provide comfortable retirements. Despite being compulsory, Australia’s super system covers only 75.7% of the population while comparable systems covered 80 to 90% of the population. Mercer also believes Australia’s SG contributions need to rise to 12% to ensure retirement income levels reach OECD averages. International comparisons showed Australia’s pension and retirement system in a positive light, with the Melbourne Mercer Global Pension Index in 2018 listing Australia at No.4 out of 34 countries examined. However, once the net replacement rate of pre-retirement income is factored in Australia does not compare so favourably. The OECD said Australia’s average net replacement rate was 40.7%, while for the OECD it was 65%.

No discussion could be complete without the views of former Prime Minister Paul Keating, the architect of the current SG system whose frustration at the current discourse was evident recently. He heavily criticised Liberal MPs proposing to scrap a plan to raise the SG, saying the suggestion that an increase would stifle wage growth was a ‘great lie’ and likening those against the SG increase to climate change deniers and anti-vaxxers.

What’s next?

There are many critics that suggest a redesigned assets test could help ensure increased savings boost retirement incomes. Grattan’s findings that an increase in savings through the SG would lead to a reduction in lifetime incomes is true of a voluntary increase in savings in any form other than increased investment in the family home. A better designed assets test, perhaps even a merging of the income and assets tests, could help ensure savings are not unduly penalised.

What would be beneficial is if industry practitioners articulated what they consider to be the objective of the retirement incomes system, and focused analysis on whether increasing the SG would or would not help to achieve that objective, and at what cost. A good starting point would be that Australians have secure and adequate incomes at and through retirement. ‘Adequacy’ would seemingly have two components, though there appears to be debate around the send point:

  • sufficient to ensure no aged person lives in poverty (the role of the age pension); and
  • sufficient to maintain pre-retirement living standards (the role of superannuation and other savings)

Only when there is broad agreement on these points can the problem of how to best achieve them can be solved.


With the Reserve Bank of Australia (RBA) cutting the official cash rate to just 1.00% on 2 July, retirees and investors face increased challenges in deriving enough income from their investments to meet their needs. This is an ongoing issue with more interest rate cuts forecast by financial markets. The following chart puts this challenge in perspective.

Key rates are on the way down in the world’s largest economies


Source: Reserve Bank of Australia, June 2019

Lonsec’s Retirement Lifestyle Portfolios are objectives-based portfolios focused on delivering a sustainable level of income in retirement, as well as generating capital growth. Specifically, the portfolios are designed to assist advisers in constructing portfolios to meet retiree essential and discretionary income needs, while generating some capital growth to meet lifestyle goals.

Differences to Lonsec’s core accumulation model portfolios are:

  • Income objective of 4% p.a. for all portfolios
  • Greater bias to AUD denominated assets – historically higher dividends, franking credits
  • Greater focus on absolute rather than relative performance
  • Constructed to manage capital drawdown risk
  • Fixed income allocations have less duration and greater credit exposure
  • Key building blocks are Yield, Capital Growth & Risk Control

With 10 year Australian government bond yields currently less than 1.50% p.a., Lonsec has opted for a diversified approach to meeting this income objective. Income in these portfolios is generated by the following funds:


Equity funds
Legg Mason Martin Currie Real Income Fund


A portfolio of listed companies that own ‘hard’ physical assets, like property, utilities and infrastructure (e.g. A-REITs, airports, toll roads, electricity and gas grids). Real Asset companies like these are an integral part of everyday life and are often monopolistic in nature. Their demand profile is, therefore, relatively inelastic and not pegged to the business cycle, hence these companies have more predictable free cash flow and dividends. The typically long-term nature of their cash flows (underpinned by long term contracts and favourable regulatory structures) also offers protection during market downturns, as well as upside growth potential from population growth. This means Real Asset companies typically have a low beta versus the broader equity market and can provide low-volatility, regular and dependable income streams.
Plato Australian Share Income Fund


A tax effective, income focused, ‘style neutral’ Australian equity portfolio that is broadly diversified (50-120 stocks) and seeks to generate income through investing in fully franked dividend yielding stocks in the run-up period to the ex-dividend dates. The Fund has been specifically designed to be tax effective in the hands of a 0% rate tax payer by capturing franking credits and exhibits a high portfolio turnover (circa 150% p.a.).
IML Equity Income Fund


An equity income strategy that seeks to generate income through investing in dividend yielding stocks and an options strategy. The options strategy generates income through buy-write and covered call option strategies and selling put options.
Grant Samuel Epoch Global Equity Shareholder Yield Fund


A long-only, benchmark unaware product that aims to invest in global companies assessed as generating free cash flow which supports both a sustainable ‘shareholder yield’ and some cash flow growth. Its objective is to generate a target return of 9% p.a. or greater over ‘a full market cycle’, expected to be derived from dividends (4.5%), share buy-backs and debt pay downs (1.5%) and cash flow growth (3%).
Talaria Global Equity Fund


An active long-only, ‘benchmark unaware’ investment product that invests in large cap securities within developed and emerging markets. The Fund is relatively concentrated, targeting 25-40 ‘quality’ companies that are purchased at ‘reasonable’ valuations. Approximately 50-70% of the Fund is committed to equities, with the residual reserved as option cover for put options sold. Stock positions are entered (and exited) via the sale of fully cash backed (covered call/put) stock options. The option premium earned provides an additional source of return beyond capital growth and dividends and creates a ‘buffer’ against losses by reducing the cost of stocks purchased.
Fixed Income Funds
Schroder Fixed Income Fund A Diversified Fixed Interest product normally invested in Australian and global (hedged) government and non-government debt markets and may have material exposure to credit assets, including up to 20% sub-investment grade sectors.
PIMCO Global Bond Fund


A Global Fixed Interest fund normally invested in a mix of bonds paying fixed rate (predominantly) coupons such as those issued by sovereign governments, corporations and other structured securities like mortgage bonds. Lonsec notes that PIMCO’s total return approach implies a degree of indifference as to the source of returns either from income / distributions (e.g. coupons) or growth (e.g. asset price growth).
Janus Henderson Tactical Income Fund


The Fund will normally be invested in a mix of bonds or debt securities paying fixed and/or floating rate coupons issued by Australian governments and corporates, residential mortgage backed securities and hybrid securities. The Fund is designed to actively allocate between Australian cash, Australian fixed interest and Australian credit, providing greater scope than traditional bond funds to protect capital in a rising yield environment.
Macquarie Income Opportunities Fund A relatively conservative credit fund with short duration fund which uses a core/satellite approach and distributes income monthly. The ‘core’ is a portfolio of predominantly ‘investment grade’ floating rate securities and ‘satellites’ exposures of Global High Yield and Emerging Markets Debt.


These funds provide a diverse source of income for retirees, though this does not come without risk. With equities generating a significant portion of the income it is imperative that equity market risk is managed through allocating to more traditional fixed income funds and funds able to play a Risk Control role in the portfolios.

Important information: Any express or implied rating or advice is limited to general advice, it doesn’t consider any personal needs, goals or objectives.  Before making any decision about financial products, consider whether it is personally appropriate for you in light of your personal circumstances. Obtain and consider the Product Disclosure Statement for each financial product and seek professional personal advice before making any decisions regarding a financial product.