The recovery in superannuation continued through August as funds posted their fifth consecutive month of gains amid signs of economic recovery in the September quarter.

Market stability and continued momentum in shares helped to bolster account balances in August. However, while consumers and investors are looking ahead to a ‘COVID normal’ world, the recovery is highly dependent on infection rates and the gradual easing of restrictions across the country.

According to estimates from leading superannuation research house SuperRatings, the median balanced option returned 1.8% in August, taking the financial year to date return to 2.9%. While super has so far performed strongly in the second half of 2020, members should be wary of further market volatility as the global pandemic rolls on.

“Australia has navigated the pandemic incredibly well compared to other countries, which has helped boost confidence locally,” said SuperRatings Executive Director Kirby Rappell. “Two key contributors are the relative success of Australian governments in managing the pandemic, and the stability that superannuation provides to our economy and financial system.”

“The theme for the second half of 2020 will hopefully be one of continued recovery, however this will likely be unevenly spread across markets and regions. The harsher lockdown conditions in Victoria will have a significant impact on long-term growth, and we expect more ups and downs in the market as the outlook evolves.”

According to SuperRatings’ data, the rolling 1-year return for the median balanced option moved back into positive territory, recording an estimated 0.8% to the end of August, but remains down 2.4% on the start of 2020. Both the growth and capital stable options are estimated to have gained 0.7% over the year to August.

Accumulation returns to end of August 2020

  CYTD 1 yr 3 yrs (p.a.) 5 yrs (p.a.) 7 yrs (p.a.) 10 yrs (p.a)
SR50 Growth (77-90) Index -3.0% 0.7% 6.4% 7.1% 7.8% 8.2%
SR50 Balanced (60-76) Index -2.4% 0.8% 5.9% 6.3% 7.1% 7.7%
SR50 Capital Stable (20-40) Index -0.4% 0.7% 3.8% 4.1% 4.7% 5.1%

Source: SuperRatings estimates

Pension returns have fared modestly better over the past year. The median balanced pension option is estimated to have risen 0.9% over the 12 months to August, while the growth option is estimated to have risen 1.0% and the capital stable option 0.9%.

Pension returns to end of August 2020

  CYTD 1 yr 3 yrs (p.a.) 5 yrs (p.a.) 7 yrs (p.a.) 10 yrs (p.a)
SRP50 Growth (77-90) Index -3.2% 1.0% 7.0% 7.9% 8.7% 9.1%
SRP50 Balanced (60-76) Index -2.4% 0.9% 6.3% 7.0% 7.7% 8.4%
SRP50 Capital Stable (20-40) Index -0.6% 0.9% 4.4% 4.6% 5.2% 5.7%

Source: SuperRatings estimates  

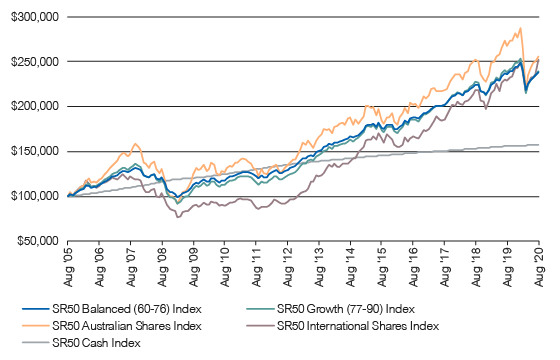
Taking a long-term view, super returns have done an incredible job at accumulating wealth for retirees over a period that includes two major financial and economic crises. According to SuperRatings’ data, since August 2005, a starting balance of $100,000 would now be worth $238,286 for members in a balanced option. For a growth option this would be $239,917. A member with full exposure to Australian shares would have seen their balance growth to $255,883. In contrast, returns on cash would have seen the balance grow to only $157,193.

Growth in $100,000 invested over 15 years to 31 August 2020

Source: SuperRatings estimates

In a financial year that saw a bull market turn into a sharp selloff followed by a recovery, super funds were rocked by a level of volatility not seen since the financial crisis a decade ago.

As funds finalise their reporting for June 2020, the fallout from the Covid-19 crisis is clear, but far from the sea of red that members and commentators may have expected back in March. For members invested in any of the top 15 performing balanced options, the past year has netted a slim but positive return compared to the estimated median return of -1.2%.

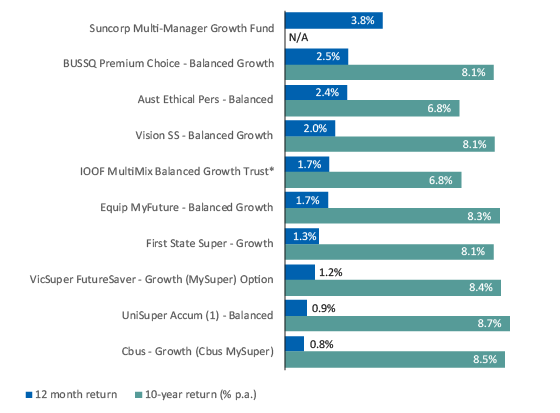
According to data from leading research house SuperRatings, Suncorp was the top returning fund over the 12 months to the end of June, with the Suncorp Multi-Manager Growth Fund returning 3.8%. This was followed by BUSSQ and Australian Ethical Super, whose balanced options returned 2.5% and 2.4% respectively.

Top 10 SR50 Balanced Index options over 12 months

* Interim return
Source: SuperRatings. Returns to end June 2020.

While it is important to acknowledge those funds that have outperformed during the Covid-19 pandemic to date, members should bear in mind that long-term performance is what really counts.

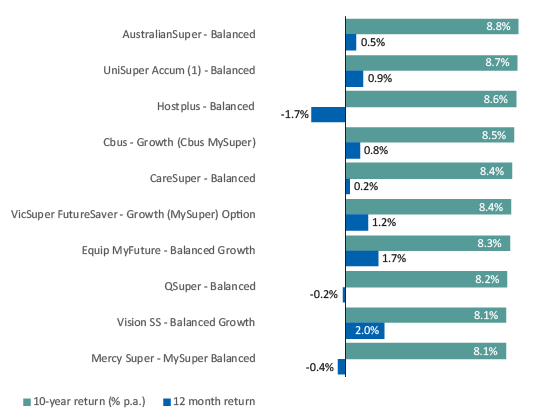
Over 10 years, the top performers are AustralianSuper, whose balanced option has returned 8.8% p.a., followed closely by UniSuper and Hostplus. Performance for the median balanced option continues to hold strong, returning an estimated 7.6% over the decade to 30 June 2020.

Top 10 SR50 Balanced Index options over 10 years

Source: SuperRatings. Returns to end June 2020.

“Importantly, over the long term, returns remain very healthy,” said SuperRatings Executive Director Kirby Rappell. “Super is a long-term game, so members should avoid chasing short-term results and ensure they are invested in a quality fund with the right investment strategy that is well positioned to deliver for their needs over the course of their working life.”

Interestingly, only half of the top performing funds over 12 months were among the top performing funds over 10 years, highlighting the difficulty for investment strategies to perform well in differing market conditions over a longer term.

“It was pleasing to see 15 out of the 50 options in the SR50 Balanced Index generate a positive return in the 2019-20 financial year, which speaks to the quality of funds available to members,” said Mr Rappell.

“Managing risks while delivering a positive return in this environment has been a real challenge, and this is likely to continue through the rest of 2020.”

According to SuperRatings, given the success of super over the past 10 years in accumulating wealth, members will feel the bumps more when markets go down.

“Prior to Covid-19, we saw the industry average account balance rise over $100,000, compared to around $30,000 during the GFC,” said Mr Rappell.

“This means that, on an absolute basis, members will see their balance move around a lot more than they have previously. Funds have done an excellent job of both managing risk and educating their members on these issues, but more can be done in this space.”

QSuper delivered the best return to risk ratio of its peers over the 7 years to 30 June 2020. While CareSuper, Cbus, MTAA, VicSuper and AustralianSuper delivered a higher return over this period, they did so at a slightly higher level of risk.

Top 10 SR50 Balanced Index options over 7 years ranked by risk and return

OptionRankingReturn % p.a.
QSuper – Balanced18.0%
BUSSQ Premium Choice – Balanced Growth27.9%
CareSuper – Balanced38.1%
Cbus – Growth (Cbus MySuper)48.5%
MTAA Super – My AutoSuper58.0%
VicSuper FutureSaver – Growth (MySuper) Option68.2%
Catholic Super – Balanced (MySuper)77.8%
First State Super – Growth88.0%
AustralianSuper – Balanced98.8%
Media Super – Balanced107.7%

Source: SuperRatings. Returns to end June 2020. Risk and return ranking based on Sharpe ratio.


Release ends

We welcome media enquiries regarding our research or information held in our database. We are also able to provide commentary and customised tables or charts for your use.

For more information contact:

Kirby Rappell
Executive Director
Tel: 1300 826 395
Mob: +61 408 250 725
Kirby.Rappell@superratings.com.au

Super funds have proven resilient to the turmoil that hit markets in the wake of the COVID-19 outbreak, extending their recovery through May and early June, and are on track to finish the 2019-20 financial year down but far from out.

According to estimates from leading research house SuperRatings, the median balanced option rose 2.1% in May, driven by a strong rise in share markets on the back of better-than-expected economic news and the beginning of a staged reopening of the economy.

Based on current estimates, the financial year-to-date return for the median balanced option at the end of May is -1.6%. If super funds do end 30 June in the red, it will be the fourth negative financial year for super since its inception in 1992, but also likely the mildest.

“Super members have benefitted from recent gains, but markets are still under pressure and remain vulnerable to negative news, including a potential second wave of COVID-19 infections,” said SuperRatings Executive Director Kirby Rappell.

“Funds were hit hard in February and March, and some saw that as an opportunity to raise questions about the value of super. Since then we’ve had two strong months and the critics have certainly been quieter, but we know there’s a long way to go before super balances return to a more stable footing.”

Since the start of 2020 to the end of May, the median balanced option fell an estimated 5.7%, with the 12-month return holding in positive territory at 0.5%. In contrast, Australian shares, measured by the S&P/ASX 200 Index, fell 13.9% over the calendar year to May and are down 10.0% over 12 months.

The median growth option, which generally has a higher exposure to shares and other risk assets, is down an estimated 6.8% in 2020 and is up 0.5% over 12 months, while the capital stable option fell only 2.1% since the start of 2020 and rose an estimated 1.2% over 12 months.

Accumulation returns to end of May 2020

  CYTD 1 yr 3 yrs (p.a.) 5 yrs (p.a.) 7 yrs (p.a.) 10 yrs (p.a)
SR50 Growth (77-90) Index -6.8% 0.5% 5.1% 5.4% 7.6% 7.7%
SR50 Balanced (60-76) Index -5.7% 0.5% 4.8% 5.3% 7.0% 7.3%
SR50 Capital Stable (20-40) Index -2.1% 1.2% 3.3% 3.5% 4.4% 5.1%

Source: SuperRatings estimates

Pension returns have held up slightly better, with the median balanced pension option down an estimated 6.1% since the start of 2020, the median growth option down 7.4%, and the median capital stable option down 2.3%.

Pension returns to end of May 2020

  CYTD 1 yr 3 yrs (p.a.) 5 yrs (p.a.) 7 yrs (p.a.) 10 yrs (p.a)
SRP50 Growth (77-90) Index -7.4% 0.6% 5.7% 6.0% 8.4% 8.5%
SRP50 Balanced (60-76) Index -6.1% 0.6% 5.1% 5.5% 7.5% 8.0%
SRP50 Capital Stable (20-40) Index -2.3% 1.3% 3.9% 4.0% 5.0% 5.8%

Source: SuperRatings estimates  

Members should expect to see their super balance move around as markets deal with the significant uncertainty surrounding COVID-19, however members in well-diversified options will feel the bumps less.

“Things are changing quickly, but there are certainly some early positive signs with businesses reopening and beginning to scale back up,” said Mr Rappell. “Full recovery may take some time, but funds are well equipped to manage the short-term risks and position themselves for future growth once we start returning to normal.

Super funds ahead of long-term objective despite GFC and COVID-19

Despite the challenge that COVID-19 poses to financial markets, superannuation has proved resilient, much as it did during the Global Financial Crisis (GFC) of 2008 and 2009.

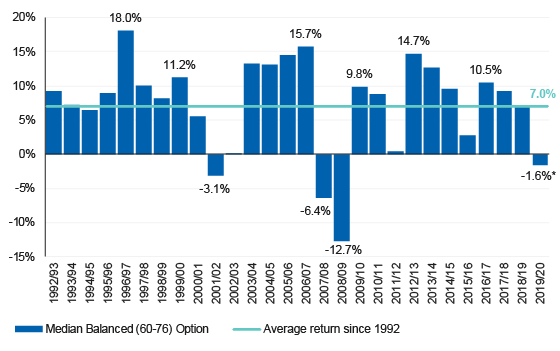
Remarkably, since 1992, the median balanced option has returned an average of 7.0% per annum, which is well above the common long-term objective of CPI plus 3.5% (see chart below).

Median balanced option financial year returns since the introduction of the Super Guarantee


Source: SuperRatings

* FYTD estimate to end May 2020

“Super members may understandably feel disillusioned after watching their balances go down through February and March,” said Mr Rappell. “But super is a long-term game, and members should be cognisant of the steady gains super has delivered over a long period of time and will continue to deliver into the future.”

“What really matters for most members is whether funds are meeting their long-term objective, and by this metric super has been an incredible success. Funds came back strongly after the GFC and there’s good reason to believe they’ll do the same this time around.”

In the wake of the most challenging quarter for financial markets in living memory, super members are scrambling to check their account balances to see what effect the sell-off is having on their retirement savings.

While members are undoubtedly nervous and wondering what the market has in store for them next, leading research house SuperRatings cautioned members against making investment decisions based on an emotional reaction to the current environment.

“Our message for super members, especially those further from retirement, is stay invested if you can,” said SuperRatings Executive Director Kirby Rappell.

“Knee-jerk changes to your portfolio could have a negative effect on your retirement. Switching to cash will lock in losses and mean you miss out on the upside when the market eventually recovers. We suggest members talk to their fund or financial adviser to help ensure any decision is aligned with a long-term strategy.”

Superannuation has been hit hard by the coronavirus and the market’s reaction to extreme measures such as social distancing, lockdowns, and travel bans.

According to estimates from leading research house SuperRatings, the median balanced option fell 8.9% in March and is down 10.0% over the quarter.

The median growth option, which generally has a higher exposure to shares, fell 12.5% in March and 14.1% over the quarter. The median capital stable option fared relatively well amid the market turmoil, falling only 4.1% in March and 3.8% over the quarter.

Accumulation returns to end of March 2020

  CYTD 1 yr 3 yrs (p.a.) 5 yrs (p.a.) 7 yrs (p.a.) 10 yrs (p.a)
SR50 Growth (77-90) Index -14.1% -6.4% 3.1% 3.7% 6.8% 6.5%
SR50 Balanced (60-76) Index -10.0% -3.1% 3.7% 4.3% 6.7% 6.5%
SR50 Capital Stable (20-40) Index -3.8% 0.4% 3.1% 3.2% 4.5% 4.9%

Source: SuperRatings estimates

Pension returns have also been buffeted by the wave of selling. The median balanced pension option fell an estimated 10.2% over the March quarter, while the median growth option fell 14.4%. In contrast, the median capital stable option was down 3.8%.

Pension returns to end of March 2020

  CYTD 1 yr 3 yrs (p.a.) 5 yrs (p.a.) 7 yrs (p.a.) 10 yrs (p.a)
SRP50 Growth (77-90) Index -14.4% -5.9% 3.7% 4.4% 7.8% 7.3%
SRP50 Balanced (60-76) Index -10.2% -2.5% 4.2% 4.6% 7.3% 7.2%
SRP50 Capital Stable (20-40) Index -3.8% 1.0% 3.8% 3.7% 5.1% 5.6%

Source: SuperRatings estimates

The only good news in March seemed to be signs of a relief rally as markets priced in the government’s fiscal stimulus packages and the Reserve Bank of Australia’s bond-buying program, along with similar efforts from governments globally.

While more pain is expected, markets have already sold off heavily in response to the coronavirus and the measures taken to contain it.

How is your super option exposed to market moves?

According to SuperRatings, times of severe market stress can make investors second-guess their long-term investment strategy. For super members, switching to a more conservative investment option in the middle of a crisis can lock in significant losses and mean missing out on the upside when markets inevitably recover.

Older members nearing retirement are likely to be in conservative balanced or capital stable options which have higher allocations to defensive assets, providing protection from share market movements.

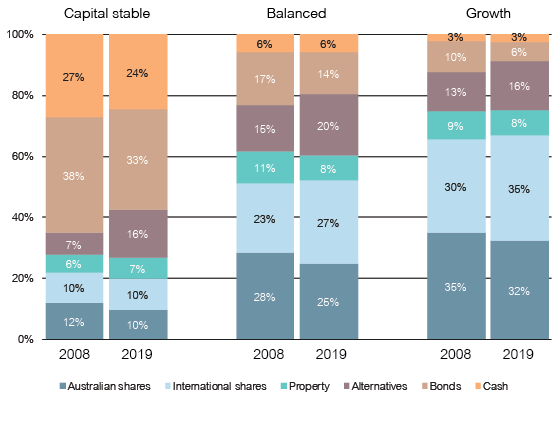
As the chart below shows, Australian and international shares generally make up just over half of the portfolio for a balanced option, with the rest invested in bonds, property, alternative assets, and cash. For growth options, shares typically make up around 67% of the portfolio, meaning members are more exposed to movements in share markets.

In contrast, members in a capital stable option will typically have only a 20% allocation to shares, with much higher allocations to bonds and cash, providing more stability and protection against share market swings.

Over time we have seen funds investing more in Alternative assets such as unlisted property, infrastructure and private equity, with these assets representing around 20% of the average balanced fund’s portfolio in 2019, up from 15% in 2008.

Asset allocation by investment option


Source: SuperRatings indices

Members need to keep the current market conditions in context. For most members, while there may be a fall on paper, the loss only becomes crystallised when members sell out. If you’re in the 20 to 40 age bracket, you have another 30 to 50 years to go before you need to start drawing down on your super. Even members in their 50s will need to rely on their super for drawdowns over the next 20 to 30 years.

According to estimates from leading research house SuperRatings, super funds had a positive start to 2020, with the median balanced option returning 1.9% in January, driven predominately by gains from Australian and International shares.

The start of February was a different story as markets were affected by the outbreak of the Coronavirus, which led to a selloff in global share markets as investors sought out safe-haven assets.

Asian equity markets have borne the brunt of the initial impact, but the effects are likely to be felt across global markets, noting that previous outbreaks over the last two decades have resulted in short–term equity market corrections within a range of 5–15%.

As super funds face the new normal of lower returns and yields, managing volatility is becoming increasingly necessary. However, despite the current swings in the market, SuperRatings said funds remained focused on long-term member outcomes.

“The funds we’ve spoken to are not responding to the current market situation with knee-jerk reactions,” said SuperRatings Executive Director Kirby Rappell.

“They’re watching developments closely, but so far market volatility has been in line with similar risk events experienced in recent years. Fund investment strategies are generally well placed to manage these types of movements.”

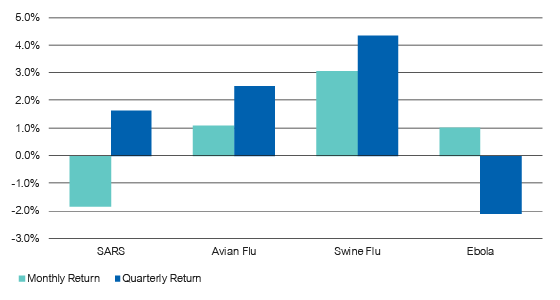
Looking back at previous epidemics, such as the Ebola outbreak in 2018 or the SARS epidemic back in 2003, Australian super funds have proved relatively resilient to short-term market movements. Quarterly returns during each episode have ranged between -2.1% and +4.3%, with markets largely unfazed over longer periods.

Outbreaks and SR50 Balanced Index performance


Source: SuperRatings, Financial Express

Whether the effect of the Coronavirus has a more lasting impact on markets remains to be seen, but funds are unlikely to implement any dramatic changes to their investment strategies without further evidence that the virus will deal more prolonged damage to the global economy.

Con Michalakis, Chief Investment Officer at StateWide Super, said that while there would undoubtedly be some economic fallout, the fund remains focused on long-term member outcomes. “This is a classic case of a black swan, and like all black swans the markets struggle with uncertainty,” said Mr Michalakis.

“What we can be sure about is that the economy in China and Australia will be slower due to the restrictions in place in the first quarter of 2020. However, from a long-term perspective, diversification and strategy based on member age and risk tolerance is more important.”

Suzanne Branton, Chief Investment Officer at CareSuper, said the fund’s investment strategies are designed to provide downside protection during bouts of market turmoil.

“When new influences on the investment outlook emerge, it’s important to analyse and monitor these closely,” said Ms Branton.

“There could be a short-term impact that provides investment opportunities or avenues to adjust positioning. However, there are reasons to expect a more short-term rather than extended large-scale market impact. Our investment approach is structured to deliver downside protection so our investment program resilience to short-term volatility is high.”

Super funds post solid returns in January as share markets powered into 2020

Super funds started the year in positive territory as momentum in local and international share markets carried through into the new year. This was quickly reversed following the outbreak of the Coronavirus and the ensuing drawdown in markets, but over longer periods super fund returns are holding up remarkably well.

Over 12 months to the end of January, the median balanced option returned an estimated 13.8%, while the median growth option return was estimated at an impressive 16.2%. Returns over the past seven years are estimated at 8.8% and 9.8% respectively.

Estimated accumulation returns (% p.a. to end of January 2020)

  1 yr 3 yrs 5 yrs 7 yrs 10 yrs
SR50 Growth (77-90) Index 16.2% 10.2% 8.2% 9.8% 8.8%
SR50 Balanced (60-76) Index 13.8% 9.1% 7.7% 8.8% 8.2%
SR50 Capital Stable (20-40) Index 7.7% 5.3% 4.6% 5.3% 5.6%

Source: SuperRatings

Pensions have delivered even higher returns than accumulation products, with the median balanced pension option returning an estimated 15.4% over the 12 months to the end of January, while the median growth pension option had an estimated return of 18.0%. Over the past seven years each have returned 9.6% and 10.8% respectively.

Estimated pension returns (% p.a. to end of January 2020)

  1 yr 3 yrs 5 yrs 7 yrs 10 yrs
SRP50 Growth (77-90) Index 18.0% 11.4% 9.3% 10.8% 9.7%
SRP50 Balanced (60-76) Index 15.4% 9.8% 8.1% 9.6% 9.0%
SRP50 Capital Stable (20-40) Index 8.9% 6.2% 5.2% 5.9% 6.3%

Source: SuperRatings

“We expect to see volatility appear more frequently over the course of 2020, but overall our outlook for super funds is positive,” said Mr Rappell.

“Long-term returns will continue to hold up despite the challenging return environment we find ourselves in at present. Members should look forward to a solid 2020, but expect some bumpiness along the way.”

Super members have every reason to be optimistic about 2020, but when it comes to a repeat of 2019’s double-digit returns, it would be wise to temper expectations.

According to estimates from leading research house SuperRatings, 2019 was the best year for superannuation funds since 2013, with the median balanced option returning 13.8%. Despite a selloff in Australian shares in December, funds entered the new year in a strong position as markets shrugged off a string of negative economic news and rising geopolitical tension.

However, funds are already battling the new normal of lower yields and returns, which will make a repeat of 2019’s results unlikely in 2020.

Looking back over 2019, the median balanced accumulation option returned 13.8% over the year to the end of December and has returned 7.7% p.a. over the past decade. December saw an estimated fall of 0.9%, ending an otherwise stellar year for Australian shares, on a sour note. Markets were driven predominately by the health care and materials sectors, while the financial services sector, despite delivering a positive result, remains largely beaten down, thanks mostly to the major banks.

The median growth option returned an estimated -1.1% in December and 16.0% over the year, while the capital stable option returned an estimated -1.0% and 7.0% respectively.

Estimated accumulation returns (% p.a. to end of December 2019)

  1 mth 1 yr 3 yrs 5 yrs 7 yrs 10 yrs
SR50 Growth (77-90) Index -1.1% 16.0% 9.0% 8.2% 10.0% 8.2%
SR50 Balanced (60-76) Index -0.9% 13.8% 8.1% 7.4% 8.8% 7.7%
SR50 Capital Stable (20-40) Index -1.0% 7.0% 4.7% 4.5% 5.2% 5.4%

Source: SuperRatings

Pensions performed similarly well in 2019, with the median balanced option returning an estimated 14.9% over 2019, compared to 18.2% for the growth option and 8.0% for the capital stable option.

Estimated pension returns (% p.a. to end of December 2019)

  1 mth 1 yr 3 yrs 5 yrs 7 yrs 10 yrs
SRP50 Growth (77-90) Index -1.2% 18.2% 9.9% 9.3% 11.1% 9.1%
SRP50 Balanced (60-76) Index -1.0% 14.9% 8.8% 8.0% 9.7% 8.5%
SRP50 Capital Stable (20-40) Index -1.0% 8.0% 5.4% 5.2% 5.8% 6.1%

Source: SuperRatings

“We’re anticipating a solid year for super in 2020, but the key challenge for funds will be the low return environment,” said SuperRatings Executive Director Kirby Rappell.

“Even with the possibility of a pickup in economic growth, yields are extremely low and it’s getting harder to find opportunities in the market. Company earnings growth is slowing, and Australian consumers are under pressure, so fundamentally it will be more challenging than 2019. That doesn’t mean it will be a bad year, but super members should not expect to bank another 13 per cent.”

Super’s long-term growth story still a winner

As the chart below shows, 2019’s double-digit return compares favourably to recent years and is significantly higher than the average return (6.4% over the past 20 years). Based on SuperRatings’ estimate of 13.8%, 2019 would represent the highest return since 2013 and the fourth-highest over the past two decades.

Median balanced option calendar year returns 2000-2019

* Estimate

Source: SuperRatings

Following the volatility of 2018, super funds saw steady growth over 2019 with only three down months during the year, with the largest fall in the median balanced option estimated to be -0.9% in December.

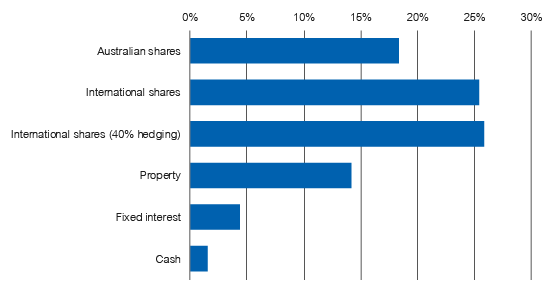
The main drivers of performance typically come from equities, of which Australian shares generally make up the greatest proportion. As the chart below shows, the Australian share market delivered a return of 18.4%, while international shares delivered 25.4% (unhedged) and 25.8% (40% hedged in Australian dollars). Meanwhile, listed property returned 14.2%, fixed interest – another major asset class for funds – returned 4.4%, and cash returned 1.5%. Another important asset class is Alternatives (including private equity), although market-based measures of performance are harder to determine as they are offered within diversified portfolios rather than standalone options.

Asset class returns in 2019

Returns based on the following indices: S&P/ASX 200 Index, MSCI World ex-Australia Index (USD), S&P/ASX 300 A-REIT Index (Industry), Vanguard Australian Fixed Interest Index ETF, Bloomberg AusBond Bank Bill Index (AUD). Hedging based on AUD/USD exchange rate of 0.7058.

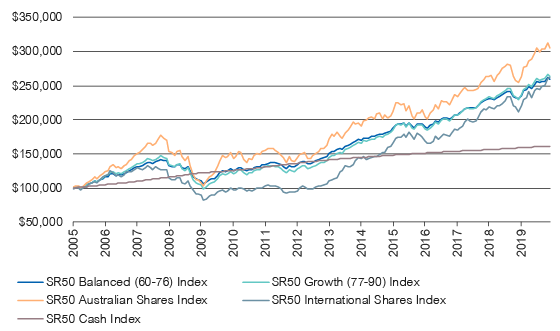
Since the GFC, funds have ridden market turbulence through 2011, 2015 and 2018 to build significant wealth for members. Looking back over the past 15 years to 2005 (before the GFC hit), the median balanced option with a starting balance of $100,000 would have grown to an estimated $259,340 by the end of 2019 (a return of 159.3%). Similarly, the median growth fund would have risen to an estimated $264,208 (a return of 164.2%).

Growth in $100,000 invested over 15 years to 31 December 2019

Source: SuperRatings

Expect further fund consolidation in 2020

Over the course of 2019 there was a number of high-profile mergers, and 2020 is expected to see more funds come together to achieve greater scale. Mergers have typically been based on geographic proximity, similar industry sectors and strategic fits, with funds seeking merger partners that are strong in areas in which they may be weaker.

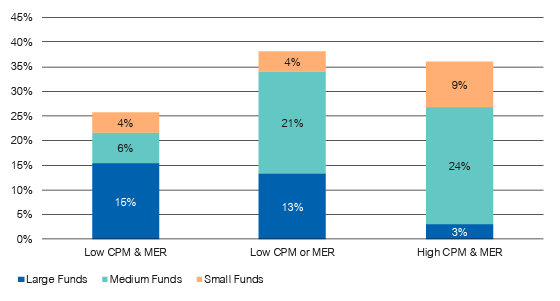
A key driver of mergers will be the sustainability of operating expenses, which as the chart below shows, is a challenge for some funds across all size categories. Though, smaller funds are more likely to have a high cost per member (CPM) and management expense ratio (MER), which measure the operational costs of the fund relative to its size.

Sustainability of cost structures

Source: SuperRatings

“With the increased regulatory scrutiny on the sector, funds are focused on the challenge of increasing scale and driving down fees,” said Mr Rappell. “It’s pleasing to see that there’s a clear focus among providers on their plans to adapt to the changing landscape, which should support continued uplift in member outcomes.”

However, there remains a number of providers who are struggling to deliver sufficient value for money and the industry’s ability to address this is critical. APRA released its MySuper Heatmaps in December 2019 which highlight laggards based on investment returns, fees and sustainability metrics and has emphasised a tougher approach going forward. APRA also now has stronger powers to force underperforming funds to merge, which is likely to further drive consolidation across the industry.

Release ends

We welcome media enquiries regarding our research or information held in our database. We are also able to provide commentary and customised tables or charts for your use.

For more information contact:

Kirby Rappell
Executive Director
Tel: 1300 826 395
Mob: +61 408 250 725
Kirby.Rappell@superratings.com.au

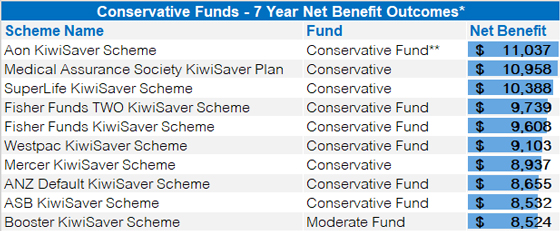
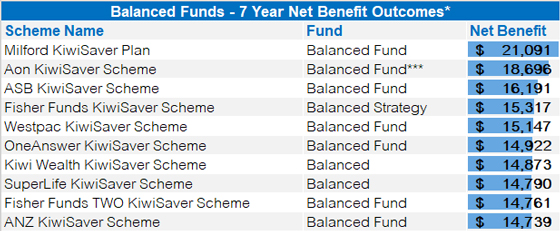
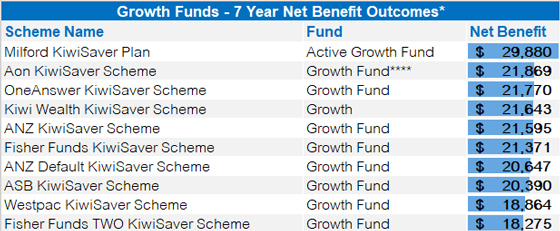
On the back of the 2019 KiwiSaver product ratings, SuperRatings is pleased to provide a list of the top 10 providers on a Net Benefit basis across Conservative, Balanced and Growth funds. The Net Benefit figures have been calculated using investment returns minus fees and taxes for the 7 years to 31 March 2019. This represents the dollar amount credited to a member’s account and is the best approach to assessing the value that a scheme delivers to its members.

We note that the Financial Market Authority’s 2019 KiwiSaver Annual Report indicated a shift in their focus from pure fees towards value for money. SuperRatings welcomes this change and will continue to monitor progress in this area to emphasise the importance of this approach, drawing on our experiences across both the New Zealand and Australian markets.

“Despite a volatile financial year, the median performance for Conservative and Balanced funds improved over the 12 months to 31 March 2019,” said SuperRatings Executive Director Kirby Rappell. “Schemes had to navigate through increased volatility and geopolitical risks, particularly in the final quarter of the 2018 calendar year. Stronger equity markets in the following quarter helped recover losses, though the median 1 year return for Growth funds moderated slightly given the higher allocation to domestic and international shares”.

The median member fee remained at $30, while we observed a slight decrease in the total percentage-based fees for Balanced and Growth funds, though they continue to charge more than the median Conservative fund. “Net Benefit cuts through the issue of having to look at returns and fees separately. Our analysis shows that despite higher fees, Net Benefit outcomes for Growth funds continue to sit above Balanced and Conservative funds”.

Another insight is the relatively narrow range of outcomes being delivered for members investing in Conservative funds. Over 7 years, the difference between the best and worst Net Benefit provider was around $3,500, yet this represents almost 20% of the member’s starting balance. This compares to a difference of over $30,000 in the Australian market, driven by stronger investment earnings and higher contribution rates. “For KiwiSaver members, changing fund type rather than changing provider can have a bigger impact on their retirement savings,” said Rappell. “SuperRatings remains supportive of schemes providing education, advice as well as digital tools to empower members to make an active choice regarding their fund type. Whilst default funds may be appropriate for first home buyers and those nearing retirement, members using KiwiSaver as a long-term savings vehicle should be informed on the options available to them”.

SuperRatings’ Net Benefit methodology models investment returns achieved by each scheme over a seven-year period to 31 March 2019, as well as the fees charged over the period. The analysis uses a scenario of a member that has a salary of $50,000 and a starting balance of $20,000. It then assumes a contribution rate of 3.0% with a contribution tax of 17.5%.

*Net Benefit outcomes are calculated over seven years and assume a contribution rate of 3.00%, contribution tax of 17.50%, salary of $50,000 p.a. and a starting balance of $20,000.
**Russell LifePoints® Conservative Fund.
***Russell LifePoints® Balanced Fund.
****Russell LifePoints® Growth Fund.

The question no-one wants to ask is – Why are APRA collecting, interpreting and then publishing information in the public domain? The answer is simple – They shouldn’t be!

Instead of regulating, APRA are now trying to play the shame game through their just released heatmaps. But there is a real risk that some of those shamed will be the wrong funds. As the founder of SuperRatings, Jeff Bresnahan says, “The problem is that no one in the industry wants to tell the regulator that they have got it wrong.”

Effectively, APRA is putting into circulation data which analyses just parts of a super fund, not the whole. By ignoring things like Governance, Advice, Insurance and Member servicing structures, consumers are not being provided with the whole picture.

As Bresnahan says, “While conflicts of interest were identified as a major issue in superannuation during the Royal Commission, it seems ironic that APRA has deliberately avoided reporting any measurement of a Fund’s Governance structure”.

In an industry which carries inherently conflicted Directors, it would appear that Governance is ignored in favour of more easily assessable information. Whether such omissions create any legal liabilities for APRA in the future remains debatable.

As a result, APRA continues its foray into unchartered territory. This is not the first time APRA have got it wrong. They have been producing performance tables for over a decade. Unfortunately, the performance tables were flawed from a usefulness perspective, in that they don’t reflect the performance of a super fund’s investment options. However, they continue to produce them and in doing so confuse and possibly mislead Australians.

And so it continues with the heatmaps. Having reviewed the heatmap methodology, SuperRatings is of the opinion that their release into the public domain may create more questions than they answer and that consumers could well be influenced into products that are inappropriate for them.

Aside from the bigger question of why APRA is publishing such data, there remain a number of problems with the methodology adopted. Critically, APRA appears to ignore implicit asset fees when measuring net investment performance.  As Bresnahan says, “This methodology can easily overstate the net benefit a member receives. Similarly, a low-cost investment option with high administration fees creates the very real possibility of consumers investing monies in cheap investment options that have no chance of outperforming the relevant index over any time period, whilst getting slugged high administration fees.”

Investment analysis since the onset of the Superannuation Guarantee in 1992 has shown that all implicit fees and performance must be analysed together on an actual net of fees basis. Many leading funds, in terms of balanced option performance, have had higher allocations than the average fund to traditionally more expensive asset classes such as infrastructure, private equity and unlisted property. These asset classes have continually outperformed cheaper alternatives.

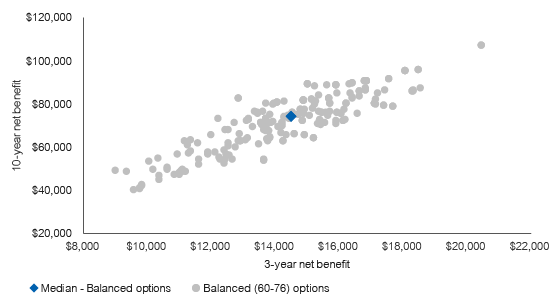
It’s only when all actual fees and returns are combined that the range of results is clearly evident in dollar terms, as the following graph indicates. The graph shows the disparity of net earnings on a $50,000 starting balance (and $50,000 salary) with SGC contributions mapped over both the last 3 and 10 years. Notably, many of the funds that added the most value, over both the short and long term, invested into the more expensive asset classes. Driving people into low-cost options will come at the expense of future earnings, something that taxpayers will ultimately have to bear.

Net benefit trend analysis (over 3 and 10 years)
Source: SuperRatings

And the anomalies continue. The heatmaps are judging funds on short term performance over just 3 and 5 years. Whilst it will be claimed this is necessary due to the limited performance history of MySuper products, it should be noted that most funds have been around for over 25 years and that their default option provides an accurate MySuper proxy.

As Bresnahan said, “Given super is a key plank of Australia’s economic future, it seems counter-intuitive for the Government’s regulator to not measure funds over a more realistic period. Certainly, it is commonly accepted that 7, 10 and 15 year performance analysis is best practice given the long term (60 years plus) nature of superannuation membership.”

Again, a consumer moving funds due to seeing a 3-year performance gap, mid-way through an economic cycle, will no doubt be moving for the wrong reasons.

The way forward

Bresnahan says, “Australians are not stupid, but they remain frustratingly unengaged with their superannuation.” This problem remains the real challenge for much of the industry. APRA’s endeavours are admirable, but questionable at the same time. He goes on to say, “A regulator should set the structure under which funds need to operate. The morphing of this regulatory process into public comparisons leaves it open to being seen as stepping across the line. One wonders what they are actually trying to achieve by moving into this public domain.”

If APRA must continue down this path, then SuperRatings suggests that they need to concentrate on the whole picture, rather than isolated parts therein. This should, aside from earlier mentioned issues, also include:

  1. Regulations to enable consistent fee disclosures, including the inequitable use of tax deductions and transparency to members;
  2. The disclosure of risk within portfolios, both via the assumptions within their growth/defensive disclosures and accepted risk measures;
  3. Compulsory disclosure of major asset holdings;
  4. Moving members into go-forward products and removing legacy structures;
  5. Continued rationalisation of member accounts; and
  6. Increased focus on the decumulation phase and the optimisation of the alignment with retiree objectives.

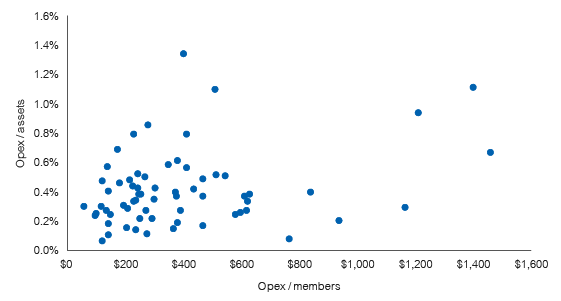
Identifying poorly run funds is not difficult and APRA would be well aware of them. A series of simple measures such as the non-public fee analysis shown below, when combined with other key assessments, quickly shows those funds who have spent the past few decades masking conflicts of interest at the expense of members.

When it costs a fund over $1,200 to run every account (versus a median of $300) or a fund’s operating expenses as a percentage of assets are over two and a half times the median, then those funds bear further scrutiny. Similar work can be done across Investments, Governance, Administration and Insurance, to name a few. By putting together the whole picture, the poor funds are very quickly exposed.

Operating expenses versus size and members
Source: SuperRatings

But it’s not all gloom and doom for the process. Importantly, after 14 years of industry debate, APRA has finally made a call on what constitutes a growth asset and what constitutes a defensive asset. The growth/defensive debate remains loud within the industry but with APRA’s call of Australian Unlisted Property and Australian Unlisted Infrastructure being 25% defensive, at least there is a starting point. SuperRatings suspect this will not however be the final position.

Certainly, APRA’s front foot involvement with data will give cause for reflection for all super funds, as the funds review their results and assess whether it has any implications for their future.

SuperRatings continues to watch the evolution of the market and continues to monitor funds on their effectiveness in responding to key challenges. We look forward to seeing whether the heatmaps evolve over time and remain broadly supportive of APRA’s underlying intentions. However, we underline that this remains only part of the picture and that the risk of making providers look alike is real. In an environment where innovation is needed, regulatory settings to support innovation are vital to ensure a vibrant industry that thrives into the future resulting in better outcomes for members.

Release ends

We welcome media enquiries regarding our research or information held in our database. We are also able to provide commentary and customised tables or charts for your use.
For more information contact:

Jeff Bresnahan
Founder & Chairman
Tel: 1300 826 395
Jeff.Bresnahan@superratings.com.au

Kirby Rappell
Executive Director
Tel: 1300 826 395
Kirby.Rappell@superratings.com.au
Super funds are off to a positive start in the December quarter, regaining momentum following a rocky September and paving the way for double-digit returns for the 2019 calendar year.

While markets have come under pressure in recent months, super funds have once again proved they are up to the task of navigating the significant uncertainty in markets, geopolitics, and the global economy.

Super fund returns held up well in October, despite weakness from Australian shares and signs of softer economic growth globally. The major financials sector has come under pressure due to constrained lending, lower net interest margins, and continued fallout from the Royal Commission. IT shares also suffered a dip as investors questioned the lofty valuations of Australia’s local tech darlings.

According to SuperRatings’ estimates, the median balanced option returned a modest 0.3% in October, but the year-to-date return for 2019 is sitting at a very healthy 12.5%. The median growth option has fared even better, returning 14.4%, while the median capital stable option has delivered a respectable 7.1% to the end of October.

Over the past five years, the median balanced option has returned an estimated 7.6% p.a., compared to 8.3% p.a. from growth and 4.7% p.a. from capital stable (see table below).

Estimated accumulation returns (% p.a. to end of October 2019)

  YTD 1 yr 3 yrs 5 yrs 7 yrs 10 yrs
SR50 Growth (77-90) Index 14.4% 11.9% 10.1% 8.3% 10.1% 8.5%
SR50 Balanced (60-76) Index 12.5% 10.5% 8.9% 7.6% 9.1% 7.9%
SR50 Capital Stable (20-40) Index 7.1% 6.8% 5.0% 4.7% 5.3% 5.6%

Source: SuperRatings

Estimated pension returns (% p.a. to end of October 2019)

  YTD 1 yr 3 yrs 5 yrs 7 yrs 10 yrs
SRP50 Growth (77-90) Index 16.4% 13.3% 11.2% 9.4% 11.4% 9.5%
SRP50 Balanced (60-76) Index 13.8% 11.7% 9.8% 8.3% 9.9% 8.7%
SRP50 Capital Stable (20-40) Index 8.3% 7.7% 5.9% 5.5% 6.0% 6.4%

Source: SuperRatings

“This year has provided further solid evidence of the ability of super funds to deliver for their members through a challenging market environment,” said SuperRatings Executive Director Kirby Rappell.

“Whether it’s the US-China trade conflict, the weaker economic outlook, falling interest rates, or the rolling Brexit saga, there’s been a lot for funds to take in. This has been a real test of their discipline and ability to manage risks on the downside. Growing wealth in this environment while protecting members’ capital is a tall order, but they have managed it well.”

Shifting asset allocation key to managing risk

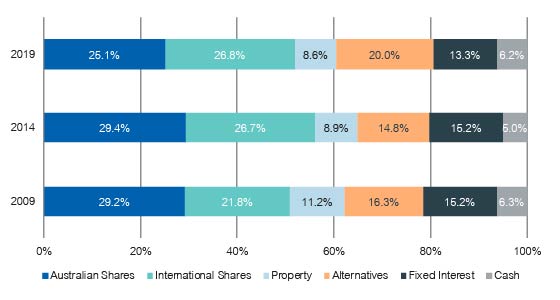
One of the most important trends in the superannuation industry is the broadening of members’ investments across different asset classes. Over the past five years, super funds have shifted away from Australian shares and fixed income and moved a higher proportion of funds into international shares and alternatives (see chart below).

Change in asset allocation (2009 to 2019)

Super fund asset allocations have shifted towards alternatives

Source: SuperRatings

The shift to alternatives is significant and has been the subject of debate within the industry. Alternatives include private market assets and hedge funds, which despite the negative connotations can provide an important source of diversification and downside protection when markets take a turn for the worse.

These assets tend to be less liquid, but they can play an important role for funds looking to generate income while managing risks for their members in a world characterised by low yields and growing uncertainty. However, funds should be clear about their alternatives strategy and the risks they could potentially add to members’ portfolios.

“This shift in asset allocation is in part being driven by the low interest rate environment, which has prompted super funds to reach for yield by allocating to alternatives and other less liquid assets,” said Mr Rappell.

“This isn’t necessarily a bad thing, and it may in fact result in a more robust asset allocation, but it’s something members should be aware of. Alternatives can help protect capital under certain market conditions, but they can also be used to boost returns by taking on some additional risk. We generally think the shift to a broader asset allocation is positive, but funds should not be complacent in ensuring risk is appropriately managed.”

A combination of factors has created fertile ground for market volatility, resulting in a bumpy ride for super members, who have experienced six negative monthly returns over the past year.

According to SuperRatings, the median balanced option return for August was an estimated -0.5%, with the negative result driven by a fall in Australian and international shares. The median growth option, which has a higher exposure to growth assets like shares, fared worse, returning an estimated -0.9%.

In contrast, the median capital stable option, which includes a higher allocation to bonds and other defensive assets, performed more favourably with an estimated return of 0.3% (see table below).

Estimated accumulation returns (% p.a. to end of August 2019)

1 month 1 year 3 years 5 years 7 years 10 years
SR50 Growth (77-90) Index -0.9% 5.2% 8.8% 8.0% 10.2% 8.5%
SR50 Balanced (60-76) Index -0.5% 5.3% 8.0% 7.5% 9.2% 8.0%
SR50 Capital Stable (20-40) Index 0.3% 5.3% 4.8% 4.8% 5.4% 5.7%

Source: SuperRatings

Investors were caught off guard in August as trade negotiations between the US and China broke down, while a range of geopolitical and market risks, including further signs of a slowing global economy, added to uncertainty.

In Australia, a disappointing GDP result for the June quarter revealed a domestic economy in a more fragile state than previously acknowledged. Action from the Reserve Bank to lower interest rates is expected to assist in stabilising markets but could be detrimental for savers and retirees who rely on interest income.

Pension products shared a similar fate in August, with the balanced pension option returning an estimated -0.6% over the month while the growth pension option returned an estimated -1.0% and the capital stable pension option was mostly flat with an estimated return of 0.3%. Long-term returns are still holding up well, with the median balanced option for accumulation members delivering 9.2% p.a. over the past seven years (in excess of the typical CPI + 3.0% target) and the median balanced pension option returning 10.2% p.a.

Estimated pension returns (% p.a. to end of August 2019)

1 month 1 year 3 years 5 years 7 years 10 years
SRP50 Growth (77-90) Index -1.0% 5.9% 9.9% 9.2% 11.5% 9.4%
SRP50 Balanced (60-76) Index -0.6% 6.2% 8.7% 8.0% 10.2% 8.8%
SRP50 Capital Stable (20-40) Index 0.3% 6.2% 5.5% 5.5% 6.3% 6.4%

Source: SuperRatings

“There will always be negative months for super members, but the timing of negative returns can have a real impact on those entering the retirement phase,” said SuperRatings Executive Director Kirby Rappell.

“For members shifting their super savings to a pension product, a number of down months in relatively quick succession will mean they begin drawing down on a smaller pool of savings than they might have anticipated. As members get closer to retirement, it’s important that they review their risk tolerance to make sure they can retire even if the market takes a turn for the worse.”

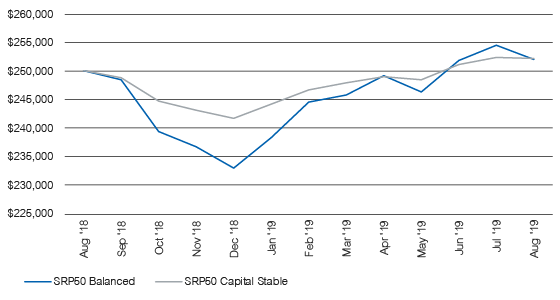
As the chart below shows, down months in the latter part of 2018 took their toll on pension balances, although they were able to recover through 2019 to finish above their starting value by the end of August 2019.

Pension balance over 12 months to end August 2019*

Pension balance over 12 months to end August 2019
Source: SuperRatings
*Assumes a starting balance of $250,000 at the end of August 2018 and annual 5% drawdown applied monthly.

Comparing balanced and capital stable option performance shows that the balanced option suffered a greater drop but was able to bounce back relatively quickly. A starting balance of $250,000 fell to $232,951 over the four months to December 2018, before recovering to $252,091 at the end of August 2019.

In contrast, the capital stable option was able to better withstand the market fall, with a starting balance of $250,000 dropping to only $241,746 in December before rising back to $252,201.

While both performed similarly over the full 12-month period, a member retiring at December 2018 could have been over $8,500 worse off if they were in a balanced option compared to someone in a capital stable option. While a capital stable option is not expected to perform as well over longer periods, it will provide a smoother ride and may be an appropriate choice for those nearing retirement.

“Super fund returns have generally held up well under challenging conditions, but there’s no doubt this has been a challenging year for those entering retirement,” said Mr Rappell.

“Under these market conditions, timing plays a bigger role in determining your retirement outcome. At the same time interest rates are at record lows and moving lower, so the income generated for retirees and savers is less, particularly if someone is relying on interest from a bank account. In the current low rate and low return environment, it’s harder for retirees to generate capital growth and income.”

Important information: Any express or implied rating or advice is limited to general advice, it doesn’t consider any personal needs, goals or objectives.  Before making any decision about financial products, consider whether it is personally appropriate for you in light of your personal circumstances. Obtain and consider the Product Disclosure Statement for each financial product and seek professional personal advice before making any decisions regarding a financial product.