Australia’s small cap shares have rarely failed to capture investors’ imaginations, not least for their ability to generate eye-watering returns when company narratives become reality. Since the start of 2016, sustained growth from small industrials combined with a rallying mining sector have produced remarkable performance for investors willing to move outside Australia’s biggest names.
Now, confronted with a rolling bear market, small cap managers are experiencing a period of pain and possibly some introspection. The past three years have taught us that dreams can be kept alive, even if they don’t always come true. Looking back, it’s fair to say that small cap outperformance was not a broad-based phenomenon. But even in an environment of elevated volatility and with market risks tilted to the downside, this does not necessarily mean that opportunities have dried up.
Taking a look at Lonsec’s peer group of small cap managers, past returns have shown significant dispersion due to a range of different sector and stock exposures. As we now know, the small cap rally was led by a narrow group of shares over the preceding six months to January 2018, and this trend continued through the second half of 2018, albeit with increased volatility.
The range of small cap fund manager returns has been wide
(returns to October 2018)
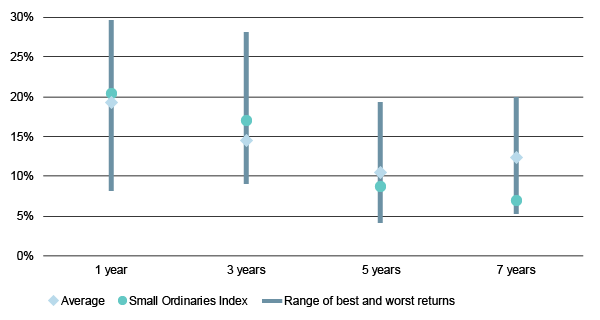
Returns based on Lonsec’s small cap fund manager peer group
Source: Lonsec
For the 2018 financial year the Small Ordinaries Index returned +24% (wouldn’t that be nice!) but this is not representative of the performance of the broad range of small cap stocks. Closer analysis reveals that 20 stocks delivered 60% of these gains, while the median stock in the index returned a more down-to-earth +9% for the year.
These top 20 hot stocks that drove the small cap index over the last 12 months are essentially companies with exposure to three themes which have dominated small cap strategies. That is, stocks exposed to the Chinese ‘Daigou’ distribution channel, resource stocks exposed to the emerging battery technology theme, and emerging technology companies.
Small cap darlings have been driving performance (FY19 P/E ratio)
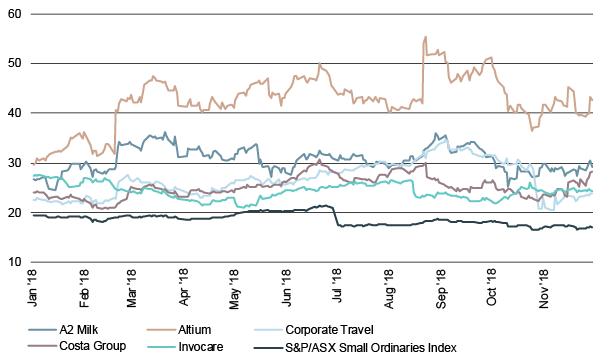
Source: Lonsec, Bloomberg
Looking at the largest 20 shares in the small cap index, eleven had a P/E ratio of over 20x and the average P/E of this group was 30x. Among these were a number of market darlings which have delivered strong returns for investors but due to their popularity saw their valuations pushed ever higher. Prior to the start of Lonsec’s annual review of small cap managers, the FY19 P/E ratio of the ASX Small Ordinaries Index was in excess of 19x versus the historical average of around 13x, indicating a large part of the index gains have come from multiple expansion more so than earnings growth.
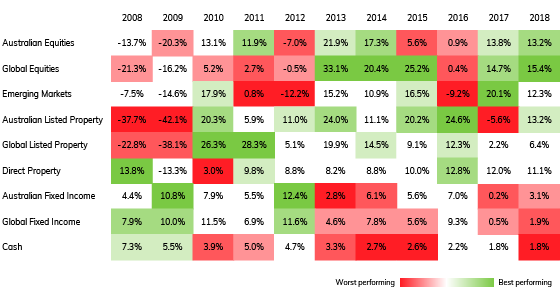
Small cap sectors have seen significant divergence
(period returns to end November 2018)
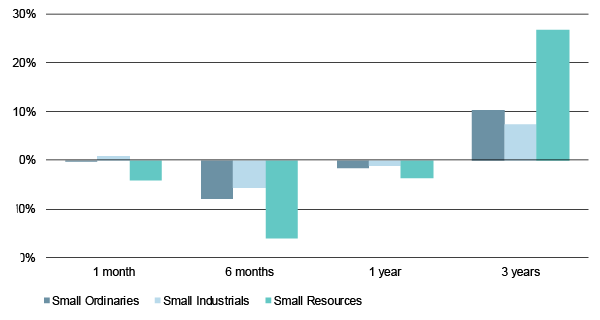
Source: Lonsec, FE
Most recently, those fund managers that have held up better than the peer group average (in the face of significant declines in share markets) have done so due to a significantly higher cash weighting in their portfolios. Managers generally anticipate volatility in equity markets will remain elevated in the medium term. As the price of risk is reassessed, valuations remain lofty and earnings growth remains elusive.
But all is not lost. Managers continue to see a broad range of attractive investments across the smaller company sector, with funds able to provide exposure to a number of niche opportunities and fast growing emerging trends, including the impact of growth in IT spending and the transition to cloud based computing, as well as quality domestic franchises expanding into larger global markets.
Add to this the disruption we have seen in financials as new business models compete with established players, along with the recovery in certain commodity markets from cyclically depressed levels, and there still plenty of themes to capture investors’ attention. The rally in small caps may be over for now, but opportunities remain for those managers who can identify the emerging trends.
To find out more about Lonsec’s Australian equities research, sign up for a free research trial or get in touch with our client services team.

IMPORTANT NOTICE: This document is published by Lonsec Research Pty Ltd ABN 11 151 658 561, AFSL 421 445 (Lonsec).
Please read the following before making any investment decision about any financial product mentioned in this document.
Warnings: Lonsec reserves the right to withdraw this document at any time and assumes no obligation to update this document after the date of publication. Past performance is not a reliable indicator of future performance. Any express or implied recommendation, rating, or advice presented in this document is a “class service” (as defined in the Financial Advisers Act 2008 (NZ)) or limited to “general advice” (as defined in the Corporations Act (C’th)) and based solely on consideration of data or the investment merits of the financial product(s) alone, without taking into account the investment objectives, financial situation and particular needs (“financial circumstances”) of any particular person.
Warnings and Disclosure in relation to particular products: If our general advice relates to the acquisition or possible acquisition or disposal or possible disposal of particular classes of assets or financial product(s), before making any decision the reader should obtain and consider more information, including the Investment Statement or Product Disclosure Statement and, where relevant, refer to Lonsec’s full research report for each financial product, including the disclosure notice. The reader must also consider whether it is personally appropriate in light of his or her financial circumstances or should seek further advice on its appropriateness. It is not a “personalised service” (as defined in the Financial Advisers Act 2008 (NZ)) and does not constitute a recommendation to purchase, hold, redeem or sell any financial product(s), and the reader should seek independent financial advice before investing in any financial product. Lonsec may receive a fee from Fund Manager or Product Issuer (s) for reviewing and rating individual financial product(s), using comprehensive and objective criteria. Lonsec may also receive fees from the Fund Manager or Financial Product Issuer (s) for subscribing to investment research content and services provided by Lonsec.
Disclaimer: This document is for the exclusive use of the person to whom it is provided by Lonsec and must not be used or relied upon by any other person. No representation, warranty or undertaking is given or made in relation to the accuracy or completeness of the information presented in this document, which is drawn from public information not verified by Lonsec. Conclusions, ratings and advice are reasonably held at the time of completion but subject to change without notice. Lonsec assumes no obligation to update this document following publication. Except for any liability which cannot be excluded, Lonsec, its directors, officers, employees and agents disclaim all liability for any error, inaccuracy, misstatement or omission, or any loss suffered through relying on the information.
Copyright © 2018 Lonsec Research Pty Ltd, ABN 11 151 658 561, AFSL 421 445. All rights reserved. Read our Privacy Policy here.