Archive for year: 2019

After almost 30 years since the introduction of compulsory superannuation in Australia, many practitioners have called for a review of the superannuation guarantee (SG) system before the legislated increase in employers’ compulsory contributions from 9.5% to 12% by 2025. These increases are:

 Period Super Guarantee (%)
 1 July 2002 – 30 June 2013 9.00
 1 July 2013 – 30 June 2014 9.25
 1 July 2014 – 30 June 2021 9.50
 1 July 2021 – 30 June 2022 10.00
 1 July 2022 – 30 June 2023 10.50
 1 July 2023 – 30 June 2024 11.00
 1 July 2024 – 30 June 2025 11.50
 1 July 2025 – 30 June 2026 onwards 12.00

Source: Australian Tax Office

The case against

The Grattan Institute recently published research showing that higher SG contributions would not be in the interests of many working Australians as many middle-income workers would give up wages of up to 2.5 per cent while working, in exchange for less than a 1 per cent boost to their retirement incomes. Grattan argues almost all the extra income from a higher super balance at retirement would be offset by lower age pension payments, due to the pension assets test. Pension payments themselves would also be lower under a 12 per cent super regime, because they are benchmarked to wages, which would be lower if employers contributed more to super. Grattan calculates that lifting compulsory super from 9.5% of wages to 12% would make the typical worker up to $30,000 poorer over their lifetimes.

Not surprisingly, these findings have sparked fierce debate amongst industry practitioners, with some questioning the assumptions made by the Grattan Institute, contending their calculations are based on people working until age 67 when in fact many retire before this for numerous reasons. The adequacy of the ASFA retirement standards is also a point of difference between protagonists. Grattan contends the ASFA retirement standards would mean many retirees would be significantly better off in retirement and this was not the purpose of super. Grattan’s research showed that most people reaching retirement would achieve 70 per cent of the income they had while they worked, a reasonable outcome given that in retirement most people have lower costs with children having left home and many without mortgages.

The case for

According to the Committee for Sustainable Retirement Incomes analysis, for those not eligible for an age pension (likely to be at least 40% of retirees into the future), maintaining pre-retirement living standards will require contributions of 15-20% (18% is the OECD average); for those eligible for some age pension, the contribution rate required will be lower but, even at typical earnings, would most likely be more than 12%.

Mercer contends Australia’s retirement system is not up to the standard of better systems overseas and still required the SG to move to 12% to provide comfortable retirements. Despite being compulsory, Australia’s super system covers only 75.7% of the population while comparable systems covered 80 to 90% of the population. Mercer also believes Australia’s SG contributions need to rise to 12% to ensure retirement income levels reach OECD averages. International comparisons showed Australia’s pension and retirement system in a positive light, with the Melbourne Mercer Global Pension Index in 2018 listing Australia at No.4 out of 34 countries examined. However, once the net replacement rate of pre-retirement income is factored in Australia does not compare so favourably. The OECD said Australia’s average net replacement rate was 40.7%, while for the OECD it was 65%.

No discussion could be complete without the views of former Prime Minister Paul Keating, the architect of the current SG system whose frustration at the current discourse was evident recently. He heavily criticised Liberal MPs proposing to scrap a plan to raise the SG, saying the suggestion that an increase would stifle wage growth was a ‘great lie’ and likening those against the SG increase to climate change deniers and anti-vaxxers.

What’s next?

There are many critics that suggest a redesigned assets test could help ensure increased savings boost retirement incomes. Grattan’s findings that an increase in savings through the SG would lead to a reduction in lifetime incomes is true of a voluntary increase in savings in any form other than increased investment in the family home. A better designed assets test, perhaps even a merging of the income and assets tests, could help ensure savings are not unduly penalised.

What would be beneficial is if industry practitioners articulated what they consider to be the objective of the retirement incomes system, and focused analysis on whether increasing the SG would or would not help to achieve that objective, and at what cost. A good starting point would be that Australians have secure and adequate incomes at and through retirement. ‘Adequacy’ would seemingly have two components, though there appears to be debate around the send point:

  • sufficient to ensure no aged person lives in poverty (the role of the age pension); and
  • sufficient to maintain pre-retirement living standards (the role of superannuation and other savings)

Only when there is broad agreement on these points can the problem of how to best achieve them can be solved.


Recent market turmoil is a timely reminder to super members not to allow short-term market movements to impact their investment decisions, according to leading research house SuperRatings.

As investors deal with a renewed bout of volatility and growing uncertainty surrounding the economic outlook, recent data show that members are often better off riding the wave rather than switching out of their current investment option in favour of something safer.

After a promising start to the 2020 financial year, markets took a dive through the first half of August, with super funds likely to feel the pinch. According to SuperRatings, the median balanced option return was a promising 1.3% in July, but this has likely been reversed due to August’s fall in share markets. The return for the median growth option, with two thirds of the portfolio allocated to local and international shares, was 1.6% over the year, while the cash option returned 0.1%.

Median Balanced option returns to 31 July 2019

 Period Accumulation returns Pension returns
 Month of July 2019 1.3% 1.5%
 Financial year return to 31 July 2019 1.3% 1.5%
 Rolling 1-year return to 31 July 2019 7.2% 8.2%
 Rolling 3-year return to 31 July 2019 8.4% 9.0%
 Rolling 5-year return to 31 July 2019 7.8% 8.4%
 Rolling 7-year return to 31 July 2019 9.5% 10.6%
 Rolling 10-year return to 31 July 2019 8.3% 9.3%
 Rolling 15-year return to 31 July 2019 7.6% 8.4%
 Rolling 20-year return to 31 July 2019 7.3% 8.0%

Median Balanced Option refers to ‘Balanced’ options with exposure to growth style assets of between 60% and 76%. Approximately 60% to 70% of Australians in our major funds are invested in their fund’s default investment option, which in most cases is the balanced investment option. Returns are net of investment fees, tax and implicit asset-based administration fees.

AustralianSuper’s balanced option remains on top of the long-term returns chart, delivering 9.6% p.a. over the 10 years to the end of 31 July 2019, followed closely by Hostplus on 9.5% p.a. and UniSuper on 9.4%.

Top 10 performing funds over 10 years to 31 July 2019


Source: SuperRatings

The SR50 Balanced Index took a dive in the December quarter of 2018, only to rebound strongly through to the end of July 2019. Switching to a capital stable option at the end of December would have meant missing out on $4,384 by the end of July (for a starting account balance of $100,000).

Balanced options have bounced back
(Value of $100,000 invested over 11 months to 31 July 2019)


Source: SuperRatings

“The lesson for investors in the current market environment is that switching in response to short-term market movements is not a good idea,” said SuperRatings Executive Director Kirby Rappell.

Historically, the June quarter is the most challenging period for super, so members might be breathing a sigh of relief. Whether the worst of recent volatility is over remains to be seen, but members have reason to be optimistic. As the chart below shows, the September quarter has delivered an average return of 2.4% over the past decade, compared to the average June quarter return of 0.9%. For growth options and options focused on Australian or international shares, the results are even more pronounced. Australian share options returns have averaged 3.9% in the September quarter and -0.6% in the June quarter.

Average quarterly returns


Source: SuperRatings

“There are certainly some significant challenges facing markets at the moment and investors are forced to deal with a constantly shifting narrative,” said Mr Rappell.

“One of the key challenges facing funds and especially retirees at the moment is record low interest rates in Australia and the continual drop in bond yields. Lower interest rates mean retirees receive less income from annuities while investors start looking for riskier assets to add to their portfolio to generate the desired yield.”

Release ends


Warnings: Past performance is not a reliable indicator of future performance. Any express or implied rating or advice presented in this document is limited to “General Advice” (as defined in the Corporations Act 2001(Cth)) and based solely on consideration of the merits of the superannuation or pension financial product(s) alone, without taking into account the objectives, financial situation or particular needs (‘financial circumstances’) of any particular person. Before making an investment decision based on the rating(s) or advice, the reader must consider whether it is personally appropriate in light of his or her financial circumstances, or should seek independent financial advice on its appropriateness. If SuperRatings advice relates to the acquisition or possible acquisition of particular financial product(s), the reader should obtain and consider the Product Disclosure Statement for each superannuation or pension financial product before making any decision about whether to acquire a financial product. SuperRatings research process relies upon the participation of the superannuation fund or product issuer(s). Should the superannuation fund or product issuer(s) no longer be an active participant in SuperRatings research process, SuperRatings reserves the right to withdraw the rating and document at any time and discontinue future coverage of the superannuation and pension financial product(s).

Copyright © 2019 SuperRatings Pty Ltd (ABN 95 100 192 283 AFSL No. 311880 (SuperRatings)). This media release is subject to the copyright of SuperRatings. Except for the temporary copy held in a computer’s cache and a single permanent copy for your personal reference or other than as permitted under the Copyright Act 1968 (Cth.), no part of this media release may, in any form or by any means (electronic, mechanical, micro-copying, photocopying, recording or otherwise), be reproduced, stored or transmitted without the prior written permission of SuperRatings. This media release may also contain third party supplied material that is subject to copyright. Any such material is the intellectual property of that third party or its content providers. The same restrictions applying above to SuperRatings copyrighted material, applies to such third party content.

The ECB’s announcement of further rate cuts was the last thing Europe’s banking sector wanted to hear. Since the depths of the eurozone crisis in 2009 and the sovereign and banking crises that followed, Europe’s banks have struggled to get back onto the right footing. Despite the introduction of new capital requirements and rules to reduce the risk posed by too-big-to-fail institutions, the equity value of banks has been in steady decline.

For Germany, the banking problem is embodied by Deutsche Bank, whose failed attempt to merge with its smaller competitor Commerzbank has forced it to abandon its long-standing dream of becoming a major Wall Street player. Its only choice now is to drastically scale back its operations. The story throughout the rest of Europe is not much better. European bank PE ratios relative to the overall market are at the lowest levels since the early 1990s.

Europe’s banks are under pressure


Source: IBES, Heuristics

The IHS Markit Eurozone Composite PMI suggests that, while the services sector has seen some pickup, manufacturing remains under pressure, and in Germany has fallen into contraction. The survey indicates that GDP in the eurozone is rising at a 0.2% quarterly rate. France and Germany are likely growing at 0.2%, while Spain is slowing to 0.4% (from around 0.7%) and Italy is contracting at a 0.1% rate. Business expectations over the next year have fallen to the lowest level in around four years.

While recent market gains may be predicated on the assumption that more monetary accommodation will help avert slowing economic growth, the situation possibly spells further pain for the banks. Central banks are now in easing mode once again, and while the Fed has yet to cut rates officially, this is the market’s strong expectation – and they don’t see the Fed stopping with just one.

12% of respondents believe the Fed will cut by more that 150 bps by 2021


Source: BofA Merrill Lynch FX and Rates Sentiment Survey

What this means is that investors looking for financial services exposure need to tread carefully. For the banks, lower rates tend to mean more pressure on lending margins, which acts as a headwind to growth. While a beaten down banking sector can spell opportunity for investors, from a portfolio perspective it’s essential to think carefully about what sort of exposure you’re looking for. For those seeking value in the banks, be prepared for a period of pain if the low rate environment continues.

Any value manager will tell you that the past 10 years has been a challenging period. Not only have growth shares outperformed, but the dispersion in price performance between the two styles is currently the widest it’s been over this period. Looking at the performance of the MSCI value and growth indices (see chart below), it’s tempting to conclude that value is all but dead.

Value is beaten down over the past decade

Value vs growth period returns, % p.a.

Source: FE, Lonsec

The reason for this dispersion starts to make sense when you think about what it is the value and growth investing styles represent. Value style investing seeks to identify companies trading below their intrinsic value. Value investors tend to be focused on long-term performance, believing that the companies they invest in will tend towards their intrinsic value over time.

Conversely, growth style investing focuses on companies whose earnings are expected to grow in excess of the market. Growth investors are typically willing to pay a premium for this growth, believing that the earnings trajectory will continue to rise and support equity prices. There are numerous studies suggesting that over the long-term the value approach outperforms growth, with well-known investors and academics such as Ben Graham and Warren Buffett being notable proponents of value style investing. The chart below compares the performance value and growth across the globe over a 20-year period

Value and growth are neck and neck over 20 years

Growth of $10,000

Source: FE, Lonsec

So why has value style investing lagged growth over the past decade? Like all things related to markets the answer is not simple, but there are some things we can point to. Firstly, the low interest rate environment which followed the global financial crisis in 2008 has benefited growth companies. Growth companies that are expected to grow their free cashflow in the future are typically more sensitive to interest rates, in a similar way to a long duration bond. With interest rates at low levels and continuing to fall in some markets, growth stocks have continued to perform well.

Secondly, global equity markets, including the US, have been fuelled by the strength of high growth sectors such as the technology sector with the so called FAANG stocks (Facebook, Apple, Amazon, Netflix and Alphabet), which have until recently driven a significant portion of US market returns. Australia is not to be outdone with its own version of growth darlings – the so-called WAAX stocks (Wisetech Global, Afterpay, Altium, Appen and Xero).

Increasingly, investors are questioning the ‘value’ of value style investing and whether it can deliver for investors in the current environment. The last time similar questions were asked was in the 1990s when markets were dominated by high-growth tech companies trading at high price-to-earnings multiples and investors were fearful of deflation. While the environment is different today (many tech companies are supported by actual earnings and interest rates are at record lows thanks to ‘unconventional monetary policy’), value investing is a long-term investment approach and will inevitably experience extended periods of relative underperformance versus growth.

It’s safe to say value is currently out of favour given the dispersion between value and growth stocks is widening. However, from a portfolio perspective, being over-exposed to a single factor or investment style can be risky if market conditions change. Being aware of your portfolio biases by engaging in deep investment due diligence on individual fund manager teams and investment products is a critical element when building a quality portfolio. Assuming that current market dynamics will continue into perpetuity is dangerous, particularly in a market where volatility is on the rise and the ‘status quo’ can shift rapidly.

Want to find out more?

Get in touch today to find out how we can help you start implementing managed portfolio solutions for your clients.

Call us on 1300 826 395 or email info@lonsec.com.au.

IMPORTANT NOTICE: This document is published by Lonsec Investment Solutions Pty Ltd ACN: 608 837 583 (LIS), a Corporate Authorised Representative (CAR number: 1236821) of Lonsec Research Pty Ltd ABN: 11 151 658 561 AFSL: 421 445 (Lonsec Research).  LIS creates the model portfolios it distributes using the investment research provided by Lonsec Research but LIS has not had any involvement in the investment research process for Lonsec Research. LIS and Lonsec Research are owned by Lonsec Fiscal Holdings Pty Ltd ACN: 151 235 406. Please read the following before making any investment decision about any financial product mentioned in this document.

Disclosure at the date of publication: Lonsec Research receives a fee from the relevant fund manager or product issuer(s) for researching financial products (using objective criteria) which may be referred to in this document. Lonsec Research may also receive a fee from the fund manager or product issuer(s) for subscribing to research content and other Lonsec Research services.  LIS receives a fee for providing the model portfolios to financial services organisations and professionals. LIS’ and Lonsec Research’s fees are not linked to the financial product rating(s) outcome or the inclusion of the financial product(s) in model portfolios. LIS and Lonsec Research may hold any financial product(s) referred to in this document. LIS and Lonsec Research’s representatives and/or their associates may hold any financial product(s) referred to in this document, but details of these holdings are not known to the Lonsec Research analyst(s).

Warnings: Past performance is not a reliable indicator of future performance. Any express or implied rating or advice presented in this document is limited to “general advice” (as defined in the Corporations Act 2001 (Cth)) and based solely on consideration of the investment merits of the financial product(s) alone, without taking into account the investment objectives, financial situation and particular needs (“financial circumstances”) of any particular person. Before making an investment decision based on the rating or advice, the reader must consider whether it is personally appropriate in light of his or her financial circumstances or should seek independent financial advice on its appropriateness.  If the financial advice relates to the acquisition or possible acquisition of a particular financial product, the reader should obtain and consider the Investment Statement or the Product Disclosure Statement for each financial product before making any decision about whether to acquire the financial product.

Disclaimer: This document is not intended for use by a retail client or a member of the public and should not be used or relied upon by any other person. No representation, warranty or undertaking is given or made in relation to the accuracy or completeness of the information presented in this document, which is drawn from public information not verified by LIS.  Financial conclusions, ratings and advice are reasonably held at the time of completion (refer to the date of this document) but subject to change without notice. LIS assumes no obligation to update this document following publication. Except for any liability which cannot be excluded, LIS and Lonsec Research, their directors, officers, employees and agents disclaim all liability for any error or inaccuracy in, misstatement or omission from, this document or any loss or damage suffered by the reader or any other person as a consequence of relying upon it.

Copyright © 2019 Lonsec Investment Solutions Pty Ltd ACN: 608 837 583

Super funds have had a convincing finish to what was a bumpy 2019 financial year, with an improvement in sentiment and a rallying share market in June helping funds over the line with solid returns.

A promising 2.0% gain in the September 2018 quarter seemed to vanish before members’ eyes as funds suffered a 4.7% loss in the December quarter. Funds fought back strongly in the final six months, helped by a solid performance in June, bringing the FY19 result to 6.9%.

According to SuperRatings’ data, the median balanced option returned 2.3% in June, driven predominately by a rebound in Australian and international share markets. By comparison, the top 10 funds achieved an average return of 8.5% for the year. The return for the median growth option, with two thirds of the portfolio allocated to local and international shares, was 7.4% over the year, while the median capital stable option returned 5.3%.

While funds have ridden the wave of market fluctuations since the Global Financial Crisis, the FY19 financial year has nevertheless proved a fitting bookend to super performance over the past decade, during which the superannuation system has amassed an additional $1.3 trillion for members.

Median balanced option financial year returns since introduction
of compulsory SG

* Interim return

Source: SuperRatings

Australia’s leading super funds in 2018-19

UniSuper was the highest returning balanced option over the 12 months to 30 June 2019, delivering a 9.9% gain to members. This was followed by QSuper and Media Super, which returned 9.7% and 8.8% respectively. Both UniSuper and QSuper are among the top returning funds over 10 years, narrowly trailing AustralianSuper, which remains on top of the long-term leader board with a return of 9.8% p.a.

Top 10 returning super funds over 1 year

Source: SuperRatings

Top 10 returning super funds over 10 years

Source: SuperRatings

“UniSuper was a standout performer for the 2019 financial year, and they have also delivered consistently strong outcomes for their members over the past 10 years,” said SuperRatings Executive Director Kirby Rappell. “While year-to-year performance can fluctuate, the ability of the fund to provide solid returns over the long term, while protecting their members’ savings against the ups and downs of the market has been key to their success.”

While superannuation continues to deliver for members, SuperRatings warned that the system could become a victim of its own success, as higher account balances mean members will feel more of the bumps as markets move.

“The 4.7% drop we saw in the December quarter was felt more acutely for someone with a $100,000 balance than one with only $10,000,” said Mr Rappell. “Members should enjoy the strength of returns we’ve seen over the past decade, but as more and more workers enter and exit the system, it’s important that we keep talking about how funds manage market pullbacks and other risks for their members. The uncertainty that many consumers and investors feel at the moment reminds us that super is a long-term game, and members must have an understanding of both risk and return, and the effect they have on their retirement savings.”

High returns are not a free lunch – consumers should understand risk

Most consumers can’t define risk, but they know it when they experience it. For superannuation members, risk can mean the likelihood of running out of money in retirement, or not having enough cash to pay for holidays, car repairs, or an inheritance for their kids.

For a young worker with a relatively low super balance, being exposed to riskier assets is less of a problem – in fact, it can help them accumulate wealth over their working life. However, for members approaching retirement (aged 50 and over), an unexpected pullback in the market can mean the difference between living comfortably and having to cut back in order to get by.

While measuring risk can be tricky, it’s essential to understanding the value that members are getting from their fund. The conversation around risk will become increasingly important as a greater number of people begin transitioning to retirement and drawing down on their super.

Risk can be measured as the degree to which returns fluctuate over time. Members want high returns, but they also want consistent returns. Unfortunately, higher returns often mean taking on more risk, which means returns will be less consistent. The table below shows the top 10 funds ranked according to their risk-adjusted return, which measures how much members are being rewarded for taking on risk.

Top 10 funds ranked by risk and return (over 7 years)

Fund Risk/return ranking1 Return % p.a.
QSuper – Balanced 1 9.5%
CareSuper – Balanced 2 10.4%
Hostplus – Balanced* 3 11.1%
Cbus – Growth (Cbus MySuper)* 4 10.7%
BUSSQ Premium Choice – Balanced Growth 5 9.8%
Sunsuper for Life – Balanced 6 10.5%
Catholic Super – Balanced (MySuper) 7 9.7%
CSC PSSap – MySuper Balanced 8 9.4%
HESTA – Core Pool 9 9.9%
Media Super – Balanced 10 9.9%

1 Risk/return ranking determined by Sharpe ratio

* Interim return

Source: SuperRatings

QSuper’s return of 9.5% p.a. over the past seven years is slightly below the average of 10.1% across the top 10 ranking funds, but it has the best return to risk ratio of its peers, meaning it delivered the best return given the level of risk involved. Funds such as CareSuper and Hostplus were able to deliver higher returns, but for a slightly higher level of risk.

High returns are not a free lunch – consumers should understand risk

Following the introduction of MySuper, which provides a low-cost, ‘set-and-forget’ alternative for members, we have seen lifecycle strategies become increasingly popular. Members starting their working life in a lifecycle product are given a higher allocation to riskier growth assets like shares, which is gradually shifted over to safer assets as they age.

This allows members to benefit from higher risk and return earlier on in their working life, and having more certainty as they get closer to retirement. Approximately one third of MySuper products have some sort of age-based strategy, and tend to be offered by retail master trusts.

The chart below shows how a lifecycle product’s asset allocation changes as members age. For those starting out in the workforce, the allocation to growth assets like equities is high (around 90% for the median fund) and is reduced over time to around 50% by the time the member reaches the age of 60.

Lifecycle vs Single Default GAA

Source: SuperRatings

When assessing the performance of lifecycle products, SuperRatings found there are some retail funds that have improved their position. smartMonday MySuper – Aon MySuper High Growth (11.8% p.a.), ANZ Smart Choice Super – MySuper (10.2% p.a.) and Mercer SmartPath – MySuper (9.9% p.a.) have delivered strong returns over the three years to 30 June 2019 for younger members (in the 1995-1999 cohort), in excess of the not-for-profit median across both single default and lifecycle MySuper products.

With the Reserve Bank of Australia (RBA) cutting the official cash rate to just 1.00% on 2 July, retirees and investors face increased challenges in deriving enough income from their investments to meet their needs. This is an ongoing issue with more interest rate cuts forecast by financial markets. The following chart puts this challenge in perspective.

Key rates are on the way down in the world’s largest economies


Source: Reserve Bank of Australia, June 2019

Lonsec’s Retirement Lifestyle Portfolios are objectives-based portfolios focused on delivering a sustainable level of income in retirement, as well as generating capital growth. Specifically, the portfolios are designed to assist advisers in constructing portfolios to meet retiree essential and discretionary income needs, while generating some capital growth to meet lifestyle goals.

Differences to Lonsec’s core accumulation model portfolios are:

  • Income objective of 4% p.a. for all portfolios
  • Greater bias to AUD denominated assets – historically higher dividends, franking credits
  • Greater focus on absolute rather than relative performance
  • Constructed to manage capital drawdown risk
  • Fixed income allocations have less duration and greater credit exposure
  • Key building blocks are Yield, Capital Growth & Risk Control

With 10 year Australian government bond yields currently less than 1.50% p.a., Lonsec has opted for a diversified approach to meeting this income objective. Income in these portfolios is generated by the following funds:


Equity funds
Legg Mason Martin Currie Real Income Fund


A portfolio of listed companies that own ‘hard’ physical assets, like property, utilities and infrastructure (e.g. A-REITs, airports, toll roads, electricity and gas grids). Real Asset companies like these are an integral part of everyday life and are often monopolistic in nature. Their demand profile is, therefore, relatively inelastic and not pegged to the business cycle, hence these companies have more predictable free cash flow and dividends. The typically long-term nature of their cash flows (underpinned by long term contracts and favourable regulatory structures) also offers protection during market downturns, as well as upside growth potential from population growth. This means Real Asset companies typically have a low beta versus the broader equity market and can provide low-volatility, regular and dependable income streams.
Plato Australian Share Income Fund


A tax effective, income focused, ‘style neutral’ Australian equity portfolio that is broadly diversified (50-120 stocks) and seeks to generate income through investing in fully franked dividend yielding stocks in the run-up period to the ex-dividend dates. The Fund has been specifically designed to be tax effective in the hands of a 0% rate tax payer by capturing franking credits and exhibits a high portfolio turnover (circa 150% p.a.).
IML Equity Income Fund


An equity income strategy that seeks to generate income through investing in dividend yielding stocks and an options strategy. The options strategy generates income through buy-write and covered call option strategies and selling put options.
Grant Samuel Epoch Global Equity Shareholder Yield Fund


A long-only, benchmark unaware product that aims to invest in global companies assessed as generating free cash flow which supports both a sustainable ‘shareholder yield’ and some cash flow growth. Its objective is to generate a target return of 9% p.a. or greater over ‘a full market cycle’, expected to be derived from dividends (4.5%), share buy-backs and debt pay downs (1.5%) and cash flow growth (3%).
Talaria Global Equity Fund


An active long-only, ‘benchmark unaware’ investment product that invests in large cap securities within developed and emerging markets. The Fund is relatively concentrated, targeting 25-40 ‘quality’ companies that are purchased at ‘reasonable’ valuations. Approximately 50-70% of the Fund is committed to equities, with the residual reserved as option cover for put options sold. Stock positions are entered (and exited) via the sale of fully cash backed (covered call/put) stock options. The option premium earned provides an additional source of return beyond capital growth and dividends and creates a ‘buffer’ against losses by reducing the cost of stocks purchased.
Fixed Income Funds
Schroder Fixed Income Fund A Diversified Fixed Interest product normally invested in Australian and global (hedged) government and non-government debt markets and may have material exposure to credit assets, including up to 20% sub-investment grade sectors.
PIMCO Global Bond Fund


A Global Fixed Interest fund normally invested in a mix of bonds paying fixed rate (predominantly) coupons such as those issued by sovereign governments, corporations and other structured securities like mortgage bonds. Lonsec notes that PIMCO’s total return approach implies a degree of indifference as to the source of returns either from income / distributions (e.g. coupons) or growth (e.g. asset price growth).
Janus Henderson Tactical Income Fund


The Fund will normally be invested in a mix of bonds or debt securities paying fixed and/or floating rate coupons issued by Australian governments and corporates, residential mortgage backed securities and hybrid securities. The Fund is designed to actively allocate between Australian cash, Australian fixed interest and Australian credit, providing greater scope than traditional bond funds to protect capital in a rising yield environment.
Macquarie Income Opportunities Fund A relatively conservative credit fund with short duration fund which uses a core/satellite approach and distributes income monthly. The ‘core’ is a portfolio of predominantly ‘investment grade’ floating rate securities and ‘satellites’ exposures of Global High Yield and Emerging Markets Debt.


These funds provide a diverse source of income for retirees, though this does not come without risk. With equities generating a significant portion of the income it is imperative that equity market risk is managed through allocating to more traditional fixed income funds and funds able to play a Risk Control role in the portfolios.

It’s been an eventful month for markets. The Coalition’s Federal election win, the RBA’s rate cuts and a continuation of the US-China trade tensions have all impacted markets during the month of June. Domestic markets reacted positively to the Coalition win with some of the pessimism surrounding the housing market subsiding. The RBA’s rate cut was not unexpected with most analysts having already priced in the cut and potentially another.

Interestingly, the market narrative has turned to the possibility of the RBA undertaking a quantitative easing (QE) program domestically in a similar fashion to what we have seen in Europe and the US, whereby the RBA would buy government and corporate bonds using cash on its balance sheet. This would result in effectively flooding the market with liquidity while keeping rates low. Should rates continue their downward trajectory and QE become a reality, it may force investors into equities providing a tailwind for markets, as we have seen in Europe and the US in recent years. This is particularly relevant for retirees who may be forced into increasing their exposure to Australian equities as a source of income. The trade tensions between the US and China continue to adversely impact markets contributing to bouts of volatility. The longer the ‘trade wars’ the higher the probability that we will see longer-term impact on global growth.

These factors make it a challenging period for investors where factors other than market fundamentals are having a material impact in the trajectory of markets. In such an environment, we believe selective valuation opportunities will present themselves for long-term investors, however ensuring that your portfolio is diversified will be very important in navigating an increasingly volatile market environment.

Balancing the Needs, Challenges and Dilemmas of Retirement Investing

Retirement investing is necessarily complex.

The median super balance when entering retirement can’t support a comfortable lifestyle in the years ahead. In the first part of this series we outline the major investment building blocks and how they’re used to deliver better lifestyle outcomes for retirees.

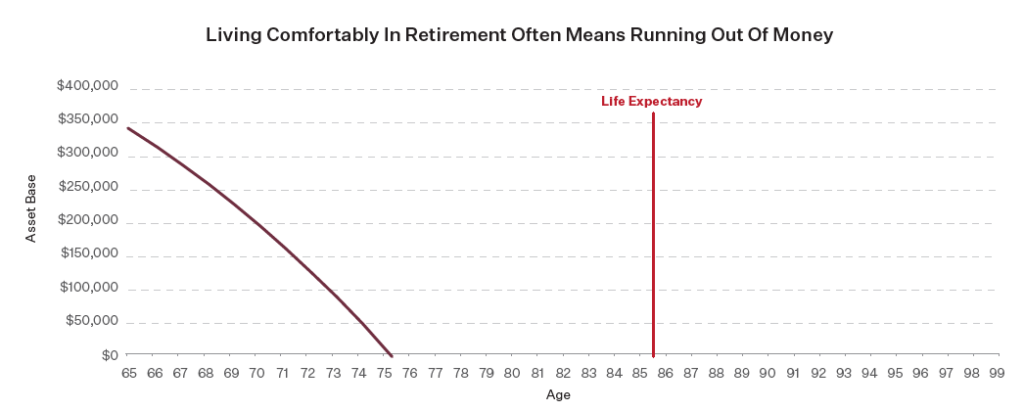
Australians spend 40 years of their working life building an asset base to retire. For the majority1 this asset base on Day 1 of retirement is insufficient to pay for their remaining life costs should they wish to live comfortably2.

Specialised approaches to investing are the only way to breach this shortfall for retirees. Conceptually, growing our asset base in the accumulation phase is easy, we engage the growth investment engine and our risk is defined as opportunity cost.

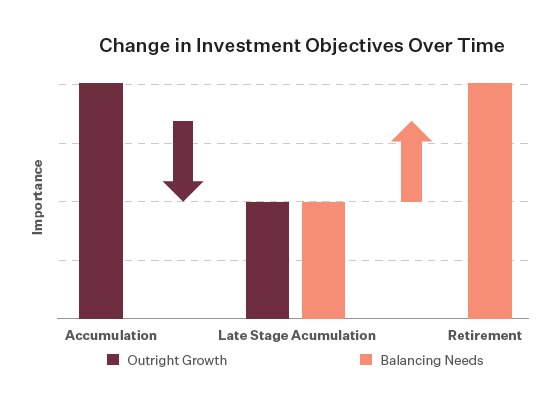
In retirement, the engine of accumulation is still required.

Throughout the accumulation phase the investment engine was set to asset growth. For retirees, that engine must engage new gears, set for the unique combination of investment goals specific to retirement needs.

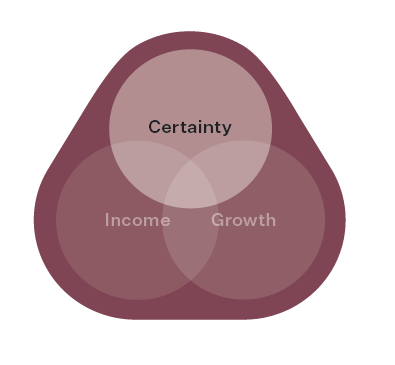
We spend 40+ years working to build an asset base to support us in retirement and in retirement we need that asset base to deliver 3 outcomes:

  • Income generation, but not at the expense of capital loss;
  • Growth of assets, but not risk losing all our savings;
  • Certainty of outcomes…

…and do all this for an unknown number of years.

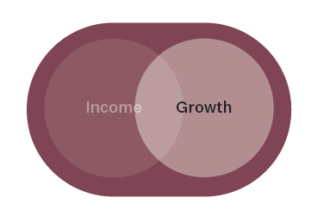
The investment engine now requires three components to successfully drive retirement outcomes:

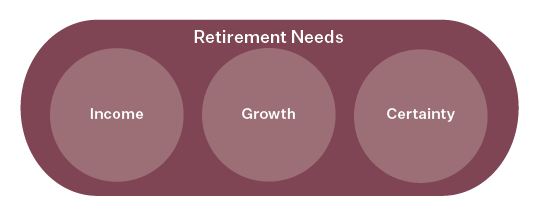
Income, growth and certainty are important individual investment components but paradoxically are not always complementary to each other. However, it is only by combining them that retirees can meet their overall retirement needs – this makes retirement investing complex.

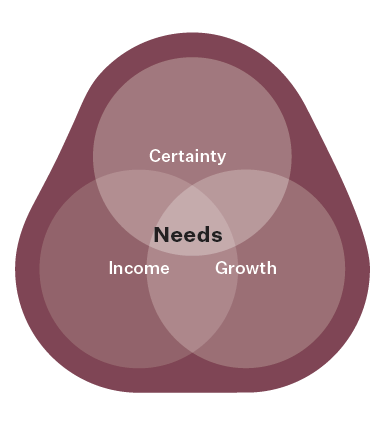
Whilst the sub-components of retirement investing may be complex, the investment framework and discussion of its rationale need not be. Simply put:

  • Retirement investing has three core standalone objectives: Income, Growth, and Certainty which in combination are hard to balance. Each objective solves a specific Need, each Need presents a Challenge, and each Challenge has its own Dilemma

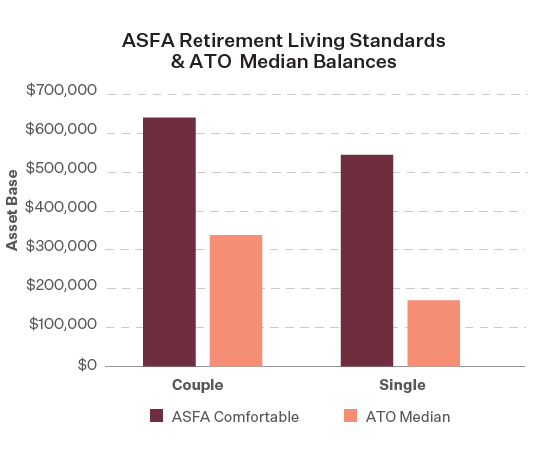
Based on the guidance provided by the ASFA Retirement Standards3, it’s clear that the Median Superannuation Balance4 isn’t enough to support a comfortable retirement.

We also know that the longer we live, the longer we’re expected to live. Thus, increasing the stress / responsibility on our savings to provide for retirement:

Life Expectancy At Age:

Age At Birth 65 75 80 85 90 95 100
Males 80.5 84.7 87.1 88.9 89.3 94.3 98.1 102.1
Females 84.6 87.3 89.1 90.4 89.9 94.9 98.3 102.3

Source: ABS 3302.0.55.001 – Life Tables, States, Territories and Australia, 2015-2017

With these data points in mind, aligning the investment engine to an investment strategy that meets client needs while engaging them in why and how this will help solve their problem isn’t easy, but it doesn’t need to be incomprehensible. Below we present each of the required retirement investment outcomes with their individual Need, Challenge and Dilemma concluding with a robust framework for delivering improved retiree lifestyles in retirement.

Income

Need: Income generation, accounting for inflation, avoiding the risk of capital loss.

Challenge: To generate enough income from retirees’ existing asset base.

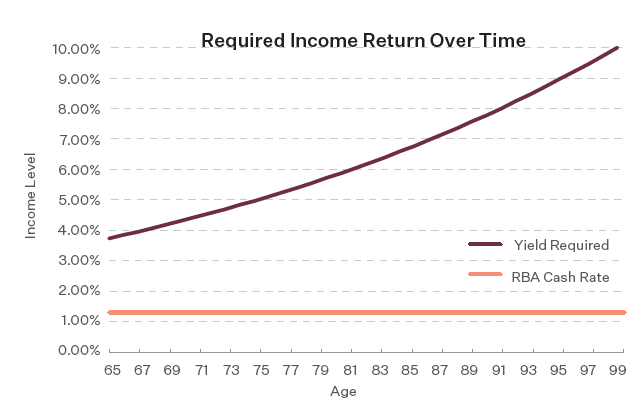
Footnote: Yield required from asset base based on ATO Median 64-69 year old superannuation balance, accounting for pension payment for homeowning couple (Male and Female), using ASFA Comfortable spending requirement, ASFA Inflation assumption of 2.75% p.a.

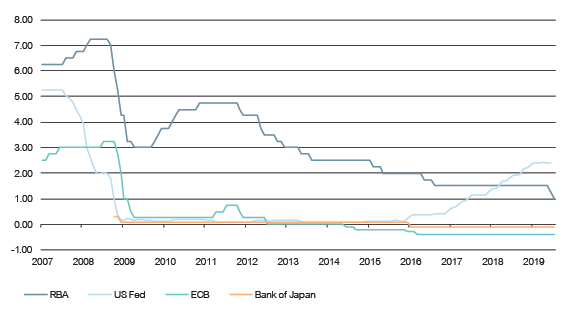
Dilemma: Income generation isn’t as easy as it once was. Today, with income levels either too low (for our needs) or too risky (as standalone investments), focusing solely on generating enough income from our asset base introduces significant risks that our asset base may be eroded while not adequately rewarding for the risk of running out of money and diminishing quality of lifestyle in retirement. Alone, investing for income is not an adequate solution for this unique challenge.

1990 2000 2010 2019
RBA Cash Rate 17.5% 5.0% 3.75% 1.25%
Inflation 7.8% 1.9% 2.1% 1.3%
Real return on cash 9.7% 3.1% 1.65% -0.05%

Source: ABS, Inflation – Consumer price index; All groups, March 2019 (Series ID: GCPIAG)

Growth

Need: Growth of assets, but not at the expense of losing my asset base.

Challenge: Investing for growth is the only way to extend the duration of a comfortable retirement. However it can significantly increase the risk of reducing the extent of a comfortable retirement by eroding retirees’ asset base through poor returns. The ultimate measure of risk in retirement is “will this investment increase my risk of running out of money earlier?”, or in other words “what does this investment do to the range of outcomes for when I’ll run out of money?” To test what this risk is we add equities5 to cash, to build some simplistic scenarios to assess the impact of investing to achieve an expected 6% p.a. return6. This provides a picture of what the real risk of investing for growth to a retiree looks like.

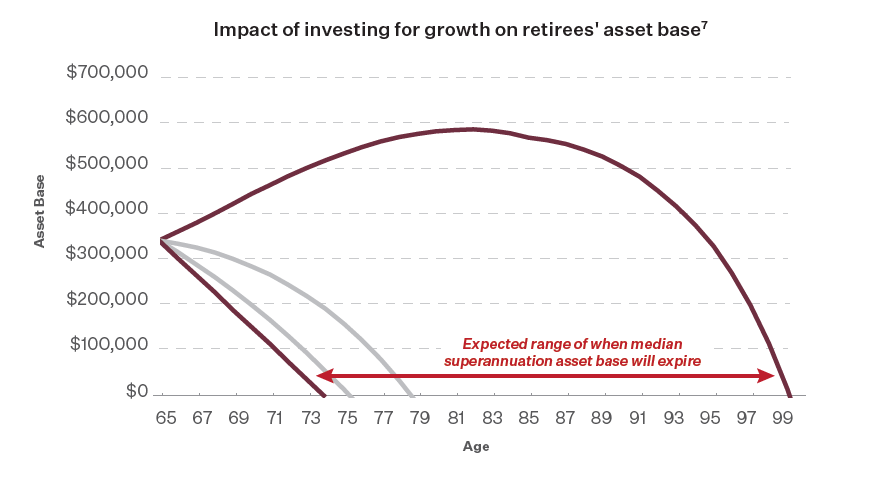
Dilemma: Investing for growth is a prerequisite, but achieving growth and increasing the duration of a comfortable retirement isn’t risk free. Growth investing isn’t a straight-line reward, we all remember the GFC and the impact on invested savings. The risk to our asset base is real, finding the appropriate balance of this risk and appropriate growth assets can only come with a genuine understanding of the possible investments and how each may impact on retiree lifestyles.

Certainty

Need: With only our asset base to support our living standards, providing certainty is critical to maintaining those standards.

Challenge: Investing is uncertain. Retirement requires a level of certainty that traditional approaches may not facilitate. Certainty has an opportunity cost: lower risk necessitates lower expected peak returns.

There’s also a client engagement necessity of certainty. Australians are under-advised, so presenting them with comprehensible solutions and building trust as their partner is critical. It’s not hard to imagine that this trust would never eventuate if we were to introduce too much uncertainty, ultimately losing retirees through the diminished perception of the value of advice.

Being a genuine source of value to retirees throughout the most important part of their financial lives is of significant mutual benefit. This trust is facilitated through the use of solutions that provide increased certainty to investment outcomes.

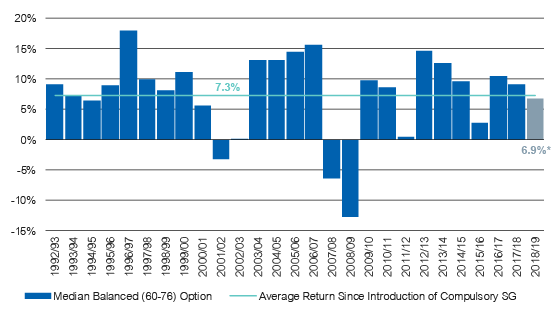
Investment certainty and growth aren’t positively associated so approaches to retirement investing need to take certainty into account far more than in the accumulation phase. As a retiree knowing that my asset base will support a comfortable retirement for as long as possible is, arguably the most important goal to achieve.

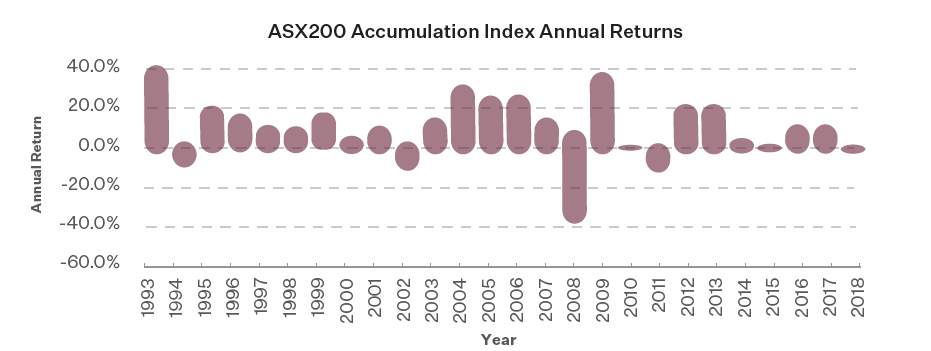
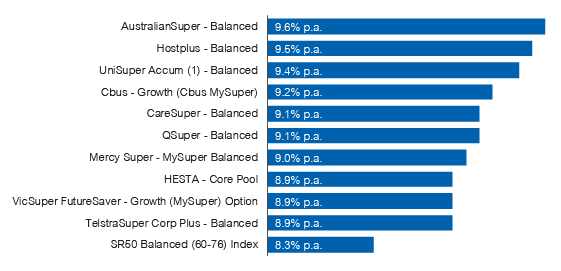
Source: Bloomberg, based on calendar year total returns

Dilemma: People need advice to navigate the most complex of investment problems any of us face. Building trust in what we provide as fiduciaries is critical. The marriage of “complexity of challenge” and “simplicity of solution” isn’t straight forward or always self-evident, but is necessary to earn the trust of retirees.

Conclusion

In retirement, the investment engine of accumulation is still required. The task we set our engine is very different as finding the right mix of strategies providing Income, Growth and Certainty is imperative. Simply put, we have different needs as retirement investors.

Different needs require a different approach. The same strategies we employed in accumulation won’t work in retirement. We know this balance is imperative but equally important is the balance of the message for clients.

What remains constant, if not more important, is the trust we must maintain with retirees. We believe an understanding of the three key pillars of retirement investing, along with the challenges in achieving each and the dilemmas presented is essential. Having retirees’ needs at the centre of this understanding provides the best position to engage in the successful pursuit of a longer, more comfortable retirement.

Life is full of certainties, in retirement it’s no different: doing nothing leads to having nothing.

The solution isn’t easy, it requires; forgetting our investment approach in accumulation, different actions in the consideration of building investment structures and the adoption of unique investment approaches to truly ensure the retirement investment engine is working for retirees.

Specialised approaches to investing are the only way to breach this shortfall for retirees. Growing our asset base through a mix of growth, income and certainty increases the likelihood improving retirees’ retirement lifestyle for longer.

1 ATO Taxation Statistics 2016–17, Median super account balance, by ages 65 – 69, 2016–17 financial year
2 The Association of Superannuation Funds of Australia Limited, Retirement Standard for retirees, March Quarter 2019, Comfortable Lifestyle
3 The Association of Superannuation Funds of Australia Limited, Retirement Standard for retirees, March Quarter 2019, Comfortable Lifestyle
4 ATO Taxation Statistics 2016–17, Median super account balance, by ages 65 – 69, 2016–17 financial year
5 Lonsec Risk Profiles 2018, Step 3: Long term asset class return and risk assumptions, October 2018
6 ASFA, Retirement Standard March 2019, assumed investment earning rate
7 Calculated using Lonsec Risk Profiles, Long Term Asset Class Return and Risk assumptions to generate 6% p.a. expected return and using +/- 1 standard deviation to determine range of outcomes with c.66% confidence

Important Information

This document is intended for licensed financial advisers and institutional clients only and is not intended for use by retail clients. The information in this document is general information only and is not based on the objectives, financial situation or needs of any particular investor. No representation, warranty or undertaking is given or made in relation to the accuracy or completeness of the information presented in this document. Financial conclusions are reasonably held at the time of completion but subject to change without notice.

Talaria Asset Management Pty Ltd ABN 67 130 534 342, AFS Licence No, 333732 assumes no obligation to update this document following publication. Except for any liability which cannot be excluded, Talaria, its directors, officers, employees and agents disclaim all liability for any error or inaccuracy in, misstatement or omission from this document or any loss or damage suffered by the reader or any other person as a consequence of relying upon it.

Back in the 1980s, the administration of the newly-created Australian Football League (AFL) believed that eleven Victorian clubs were unsustainable in a national competition. Victorian clubs, many of which were in a poor financial state, were offered incentive packages of up to $6 million to merge. One of the proposed mergers was to have been between Fitzroy and Footscray in 1989, but Footscray members rallied to raise enough money to retain their Club as a separate identity, and Fitzroy eventually relocated to Queensland in 1996 to transform the Brisbane Bears into the Brisbane Lions.

What does this have to do with Superannuation?

On 4 April 2019, APRA (the Australian Prudential Regulation Authority) issued a media release, quoting Deputy Chair Helen Rowell: ‘In some instances, acting in the best interests of members will require underperforming funds to merge or exit the industry. If trustees and trustee directors are not willing or able to meet their best interests duties to members, they should be prepared to face serious consequences.’.

The catalyst for this media release was the passing of new legislation granting APRA stronger powers to take action against the trustees of underperforming superannuation funds.  The Treasury Laws Amendment legislation requires trustees to conduct an annual Outcomes Assessment against a series of prescribed benchmarks, covering all of their fund’s MySuper and Choice superannuation product options, and enhances APRA’s power to refuse, or to cancel, a MySuper authorisation.

Previously, APRA had been pushing for more super fund mergers, based on the earlier ‘scale test’, which many in the industry argued focused unfairly on ‘sub-scale’ funds, some of which were delivering perfectly satisfactory returns and services to their members.   In her Opening Statement to the House of Representatives Standing Committee on Economics on 10 October 2017, Helen Rowell stated that ‘The metrics considered under the existing scale test are insufficient to indicate whether a trustee is promoting the financial interests of, and providing quality, value-for-money outcomes for, fund members’.

Just as the AFL has made numerous, almost annual changes to the rules governing the world’s oldest major football code, Prudential Standard SPS 515 has gone through multiple revisions in this tumultuous environment, with the latest draft version bearing little resemblance to the original.

In the first version released in December 2017, strategic and business planning and member outcomes were contained in separate prudential standards. The strategic planning requirements sat rather unwieldy as part of the prudential standard on risk management.  The member outcomes requirements appeared to be somewhat more business operations focused, requiring funds to design a member Outcomes Assessment by segmenting its business so that ‘all parts of its business operations… are captured; and the assessment considers the outcomes provided to beneficiaries in each segment’. The way to assess each outcome was also unnecessarily rigid, requiring assessment with reference to both ‘objective benchmarks and targets, both internal and external’ and ‘outcomes provided to beneficiaries of other [funds]’.

It was pleasing to see that the December 2018 version of SPS 515 fixed both of the above issues.  Strategic planning and member outcomes requirements were amalgamated into the same prudential standard. Outcomes Assessments became member cohort-focused and there was no longer an explicit requirement to compare every single outcome metric to other funds. This version of SPS 515 was much more logically structured, and also struck a better balance between being prescriptive and permitting flexibility for funds to determine their own member outcomes assessment framework to suit their particular circumstances.

However, the passage of legislation to require an annual Outcomes Assessment under the SIS Act in early April 2019 necessitated further revisions to SPS 515.  The legislated requirements are more prescriptive, requiring comparison of a fund’s MySuper products to other MySuper products offered by other funds. For Choice products, funds are required to determine comparable Choice products for comparison purposes.

On 30 April, APRA issued the revised SPS 515 for industry consultation. The revised SPS 515 introduced a new ‘business performance review’ requirement that covers both monitoring of business plans and the Outcomes Assessment. The Outcomes Assessment encompasses two parts, the outcomes assessment as required under SIS and outcomes achieved for different cohorts of beneficiaries.

It is not immediately clear what specific outcomes are envisaged to be covered in the latter, nor is it clear whether APRA requires assessment by cohorts to apply to the Outcomes Assessment under SIS. Additionally, APRA requires funds to specify relative weights to different areas in making an overall assessment. As APRA issued only the revised Prudential Standard for consultation without the relevant Prudential Guidance, it is not 100% clear how APRA envisages the new requirements to work.

There is also uncertainty about the timing of the first annual Outcomes Assessment. As the relevant legislation became effective in April 2019, arguably the first annual assessment needs to be completed within a year, so by April 2020.

Meanwhile, the prospective commencement date of 1 January 2020 for SPS 515 draws ever nearer.  The latest legislative and prudential requirements have changed significantly from the earlier versions. Trustees need to review their assessment framework to cater for these changes, including how to determine the comparable Choice products and what summary results of the outcomes assessment to make publicly available as required by the legislation.

Whatever final form the Outcomes Assessment takes, both regulators and trustees need to be flexible enough to recognise that not everything that makes an organisation successful can be captured in calculable metrics.

After Footscray’s members saved their Club from extinction in 1989, they became the Western Bulldogs and stumbled from moderate success to financial crisis over the following 25 years.  However, in 2016 they memorably won the ultimate AFL prize, the premiership flag, paid off a multi-million-dollar debt and consolidated their position as a permanent community focus for Melbourne’s Western suburbs.  Definitely a favourable outcome for their members!

Prepared by Minjie Shen – Manager, Consulting and Bill Buttler – Senior Manager, Consulting

Important information: Any express or implied rating or advice is limited to general advice, it doesn’t consider any personal needs, goals or objectives.  Before making any decision about financial products, consider whether it is personally appropriate for you in light of your personal circumstances. Obtain and consider the Product Disclosure Statement for each financial product and seek professional personal advice before making any decisions regarding a financial product.