The date for Britain’s departure from the European Union is still very much TBC. Prime Minister May went to Brussels to ask for an extension beyond the 29 March deadline, and assuming a deal is finally agreed to by the House of Commons, Britain will have until 22 May to complete the withdrawal. If a deal doesn’t pass, the cliff-edge is moved back to 12 April.

While the British parliament is adamant that a no-deal scenario must be avoided, a ‘hard Brexit’ remains on the cards so long as no deal is forthcoming. Then again, even if a deal is made, it is difficult to know what the ramifications will be for markets and the economy. Given the event risk this represents, Lonsec has surveyed the global equities universe to create an overview of product exposures for the UK and Europe. The UK represents 6.2% of the MSCI World ex Australia Index and the EU countries ex-UK represent 16.3%. In short, at least one fifth of the index is directly exposed to Brexit.

These exposures presented below represent a point-in-time snapshot (December 2018) and are subject to change as these are actively managed strategies. It is worth noting that any adverse outcomes for fund managers who are over- or under-exposed to the UK and Europe could be largely offset by subsequent currency movements.

Several managers have significant UK and EU exposure

The below chart shows global equity funds with greater than 10% exposure to the UK. For comparative purposes, the reference index’s composition includes 6.2% exposure to the UK.

Global equity fund managers’ European exposure (%)

Global equity fund managers’ European exposure (%)
Source: Lonsec

Value managers tend to have the highest Brexit exposure

The below chart demonstrates the propensity for ‘value’ managers to be overweight UK domiciled securities. Value investors typically target stocks which they deem to be trading at below their intrinsic value and are therefore not representative of the company’s long-term fundamentals. Lonsec posits that this could be reflective of the harsh depreciation that UK securities have experienced during the Brexit fiasco, which on this metric could be looking attractive to ‘value’ orientated investors.

Average UK exposure by sub-sector (%)

Value managers tend to have the highest Brexit exposure
Source: Lonsec

Location of fund manager’s HQ can create an investment bias

The below chart illustrates the proclivity for global equity fund managers domiciled in the UK to be overweight domestic equities. This may be reflective of a home bias which is common for fund managers due to the greater familiarity and understanding of their domestic market.

Office locations of managers with >10% UK exposure

10% UK exposure” width=”561″ height=”301″ class=”alignnone size-full wp-image-5666″ style=”margin: 0;” />

Source: Lonsec

Protecting against Brexit chaos

Given the significance of the European and UK markets, the Brexit issue is not one that investors can afford to completely ignore. The challenge, however, is not in the evaluation of the risks associated with different outcomes but in managing the uncertainty involved in determining both the market’s reaction to developments and the short- and medium-term economic impacts. For wealth managers who recommend global exposure for their clients, this creates an extra layer of complexity in determining appropriate investment products and asset allocations.

The Brexit issue, along with other geo-political risks, are actively considered by Lonsec’s investment committees and feed into our model portfolio weights. Addressing these challenges requires a diverse mix of expertise, combining macro-economic, portfolio management, and research capabilities. For those interested in the broader topic of managing uncertainty in a portfolio context, our upcoming Lonsec Symposium is a must-attend event that will draw on the knowledge of Australia’s leading strategists and retirement experts.

IMPORTANT NOTICE: This document is published by Lonsec Research Pty Ltd ABN 11 151 658 561, AFSL 421 445 (Lonsec).

Please read the following before making any investment decision about any financial product mentioned in this document.

Warnings: Lonsec reserves the right to withdraw this document at any time and assumes no obligation to update this document after the date of publication. Past performance is not a reliable indicator of future performance. Any express or implied recommendation, rating, or advice presented in this document is a “class service” (as defined in the Financial Advisers Act 2008 (NZ)) or limited to “general advice” (as defined in the Corporations Act (C’th)) and based solely on consideration of data or the investment merits of the financial product(s) alone, without taking into account the investment objectives, financial situation and particular needs (“financial circumstances”) of any particular person.

Warnings and Disclosure in relation to particular products: If our general advice relates to the acquisition or possible acquisition or disposal or possible disposal of particular classes of assets or financial product(s), before making any decision the reader should obtain and consider more information, including the Investment Statement or Product Disclosure Statement and, where relevant, refer to Lonsec’s full research report for each financial product, including the disclosure notice. The reader must also consider whether it is personally appropriate in light of his or her financial circumstances or should seek further advice on its appropriateness. It is not a “personalised service” (as defined in the Financial Advisers Act 2008 (NZ)) and does not constitute a recommendation to purchase, hold, redeem or sell any financial product(s), and the reader should seek independent financial advice before investing in any financial product. Lonsec may receive a fee from Fund Manager or Product Issuer (s) for reviewing and rating individual financial product(s), using comprehensive and objective criteria. Lonsec may also receive fees from the Fund Manager or Financial Product Issuer (s) for subscribing to investment research content and services provided by Lonsec.

Disclaimer: This document is for the exclusive use of the person to whom it is provided by Lonsec and must not be used or relied upon by any other person. No representation, warranty or undertaking is given or made in relation to the accuracy or completeness of the information presented in this document, which is drawn from public information not verified by Lonsec. Conclusions, ratings and advice are reasonably held at the time of completion but subject to change without notice. Lonsec assumes no obligation to update this document following publication. Except for any liability which cannot be excluded, Lonsec, its directors, officers, employees and agents disclaim all liability for any error, inaccuracy, misstatement or omission, or any loss suffered through relying on the information.

Copyright © 2019 Lonsec Research Pty Ltd, ABN 11 151 658 561, AFSL 421 445. All rights reserved. Read our Privacy Policy here.

Over the past few months Lonsec has seen a noticeable increase in the number of fund managers seeking to bring alternative products to the market. This trend has been largely driven by market factors, with investors anticipating a period of increased volatility, lower returns, and a challenging valuation environment for key asset classes, which have remained at fair to expensive levels for a number of years.

The ability of alternative asset managers to provide diversification to traditional asset classes, as well as achieve positive absolute returns during market downturns, is an attractive proposition, especially for those who believe the market has reached a turning point. Fund managers have been keen to offer their own solutions, ranging from market neutral and risk premia strategies, to global macro and liquid alternatives.

The appeal of alternatives is due in no small part to their track record during the global financial crisis, which saw strategies like managed futures deliver positive returns even as market panic reached its crescendo. As the chart below shows, global managed futures funds like the Winton Global Alpha Fund outperformed global shares, which remained beaten down for around four years after the GFC.

Managed futures outperformed following the GFC

Source: Lonsec

The Winton Global Alpha Fund, which is a managed futures strategy for example generated 25.6% for the year ending 2008 compared to global equities which generated -26% (MSCI AC World ex Australia TR Index AUD). However, as the chart also shows, extrapolating such exceptional performance into the future is dangerous and can lead to a mismatch between expectations and reality.

Diversification does not mean downside protection

While certain alternative strategies performed exceptionally well during the GFC, most financial advisers will tell you that recent performance has been mixed at best. The chart below shows rolling three-year returns for a range of alternative strategies, including multi-asset strategies (Invesco and Aberdeen) and managed futures (AQR and Winton).

Performance has been divergent, highlighting the heterogenous nature of alternative assets even among similar strategies. Some alternatives products have generated negative returns during periods when equity markets were relatively strong and have also struggled to protect capital in down markets.

Managed futures have struggled in recent years

Source: Lonsec

This brings us to the major issue investors must understand when thinking about alternatives: diversification is not downside protection. Alternative assets may provide protection in certain market environments, and certainly there have been periods when this has been the case, with the GFC being the most powerful case study. But when markets are volatile and there is no clear trend, investors should not expect alternatives to rescue their portfolio.

Take managed futures as an example. These strategies seek to identify price trends across a range of asset classes (equities, bonds, commodities and currencies), using futures contracts to take long and short positions. A key contributor to the underperformance of these strategies in recent periods has been the lack of persistent trends within these asset classes. In the case of multi-asset strategies, the lack of market volatility (at least until very recently) has made it challenging to generate alpha through relative value trades.

A better way to incorporate alternatives in your portfolio

Despite some common misconceptions, alternatives can be an invaluable part of your portfolio if you understand what they can and cannot do. Indeed, alternatives are a mainstay of many institutional portfolios, as well as major not-for-profits like some of the big US college endowment funds. We don’t have to look far afield to Australia’s own sovereign wealth fund, which has significant exposure to alternative assets. As at the end of 2018, 14.6% of the Future Fund’s assets were invested alternatives, which does not even include the allocations to private equity, property and infrastructure.

Future Fund asset allocation

As at December 2018

Source: Future Fund, Lonsec

Alternative assets provide a different source of returns to traditional assets, which can be beneficial to portfolios where there is heightened uncertainty and a risk of markets moving up and down. They may offer downside protection in certain environments, but they should not be positioned within a portfolio as an ‘insurance policy’ against down markets. Considering the market outlook over the next 12 months, we believe that markets will be characterised by periods of heightened volatility.

Central bank policy will continue to be a major driver of sentiment, and market reaction to themes such as the US-China trade war and Brexit will continue to contribute to volatility. If this is the case, then it will likely continue to be a challenging period for managed futures. Lonsec’s preference is to allocate to diversified multi-asset strategies that are in a position to take advantage of the increased volatility.

However, given the heavy reliance on manager skill in the sector, manager selection becomes a very important factor, and understanding exactly what individual strategies bring to a portfolio and how they may perform in different market environments is critical. This is the foundation of Lonsec’s research-driven approach to portfolio construction. Alternatives can be valuable source of alpha and diversification, but choosing the right products means understanding which individual strategies are likely to achieve your portfolio’s objectives.

This article has been prepared for licensed financial advisers only. It is not intended for use by retail clients (as defined in the Corporations Act 2001) or any other persons. This information is directed to and prepared for Australian residents only. This information may constitute general advice. It has been prepared without taking account of an investor’s objectives, financial situation or needs and because of that an investor should, before acting on the advice, consider the appropriateness of the advice having regard to their personal objectives, financial situation and needs.

The Australian equity market reacted positively to the February reporting season, providing a relief rally after beating the market’s pessimistic expectations. But while results were not as weak as feared, it has generally been a tough environment for earnings, with more company downgrades than upgrades. In absolute terms, earnings expectations for FY19 have been tracking lower and overall market earnings are now expected to grow at around 4% in FY19, down from 7% in FY18.

Positive results for the Resources sector

Results from the Resources sector were the highlight, with earnings expected to grow by 13% in FY19, driven by ongoing strength in commodity prices and the strong balance sheets in the sector. The short-term outlook remains positive for the sector if spot prices remain around current levels, which could lead to material earnings upgrades for the likes of BHP and RIO over the next 12 months. This is in contrast to the Industrials and Financials sectors where earnings growth expectations remain in a downtrend, which is expected to continue through FY20.

Companies are still paying dividends

We saw a number of companies (including BHP, RIO, WES, WOW, FMG, CTX and MFG) lifting their dividend payout ratios and announcing special dividends or share buyback plans. This was driven in part by management looking to return excess capital and franking credits to shareholders ahead of potential policy changes following this year’s federal election.

Looking ahead at 2019

The ongoing slowdown in the housing market, policy uncertainty ahead of the federal election, and the outcome of the US-China trade negotiations remain the key headwinds for equity markets over 2019. These factors are increasingly reflected in outlook commentaries across our investment universe. In Lonsec’s view, the recent contraction in the growth rate of corporate profits will need to be reversed to justify current valuation levels, particularly given the momentum of the market rally to date during this calendar year.

How has earnings season affected Lonsec’s portfolios?

Looking specifically at the impact to our portfolios, the stocks in the Lonsec SMA—Core portfolio had a relatively strong reporting period in February, with CSL, CPU, WPL, QUB and REA delivering strong double-digit earnings growth. Meanwhile CBA, RHC, COL, and CGF reported broadly flat or negative earnings growth over the half. Looking ahead, earnings across the portfolio are expected to grow by around 5% over FY19, driven by the overweight position in Healthcare and underweight exposures to Financials and Materials.

This document has been prepared by Lonsec Investment Solutions Pty Ltd ACN 608 837 583, a Corporate Authorised Representative (CAR 1236821) (LIS) of Lonsec Research Pty Ltd ABN 11 151 658 561 Australian Financial Services Licence (AFSL 421 445) (Lonsec Research). LIS creates the model portfolios it distributes using the investment research provided by Lonsec Research but LIS has not had any involvement in the investment research process for Lonsec Research. LIS and Lonsec Research are owned by Lonsec Holdings Pty Ltd ACN: 151 235 406. We can be contacted on 1300 826 395, by email to info@lonsec.com.au, or by writing to L7, 90 Collins Street, Melbourne, Victoria, 3000. You can also visit our website at www.lonsec.com.au.

This document has been prepared for the exclusive use by financial advisers, institutions and wholesale clients and is not intended for use by members of the public or retail customers and should not be relied upon by any other person.

This document contains general information only and does not take into account your individual objectives, taxation position, financial situation or needs. You should assess whether the information is appropriate for you and consider obtaining independent taxation, legal, financial or other professional advice before making an investment decision. The views contained in this document are those of the author and are based on information known at the time of publication. That information may change. LIS assumes no obligation to update this document following publication. You should not rely on this document in making an investment decision about any security, but should make your own independent enquiries.

LIS is authorised under its AFSL to provide financial product advice, but is not authorised to issue financial products. Investors wishing to invest in Lonsec managed portfolios may only do so via another licensed product issuer. A Product Disclosure Statement (PDS) or Investor Directed Portfolios Services (IDPS) Guide is available from the relevant product issuer for any Lonsec portfolio referred to in this document. You should read the PDS or IDPS Guide and consider whether a product is appropriate for you before making a decision to invest. If you invest in a Lonsec portfolio, Lonsec may receive fees in relation to that investment. Investments in the portfolios managed by Lonsec are subject to investment risks including possible delays in repayment and loss of income and principal invested. Neither Lonsec Research, nor any other member of the Lonsec Group, guarantee the return of capital or the performance of any of the portfolios.

LIS has taken all due care in the preparation of this document. To the maximum extent permitted by law, Lonsec Group, its related bodies corporate, directors or employees make no representations or warranties as to the accuracy or completeness of this document including, without limitation, any forecasts and disclaim all liability for any loss or damage of any kind (whether foreseeable or not) that may arise from any person acting on any statements contained in this document. Past performance is not a reliable indicator of future performance. Future returns may be affected by a range of factors including economic and market influences.

Copyright of this document is owned by Lonsec. You may only reproduce, circulate and use this document (or any part of it) with the consent of Lonsec.

The market made its view clear at the end of last year: no more rate hikes. As the US Fed threw its tightening rhetoric into reverse, markets dramatically shifted their expectations for the next interest rate move, with a cut to the funds rate firming as a distinct possibility. As the chart below shows, the probability of a rate cut based on the pricing of December 2019 Fed futures rose to 38% in March, while the probability of a rate increase is effectively zero.

Probability of a Fed funds rate move (December 2019 meeting)


Source: Bloomberg, CME, Lonsec

All that was left was for markets to see if the Fed’s FOMC members had arrived at the party on time. This week’s meeting coincided with the release of the Fed’s updated growth and inflation forecasts, as well the notorious ‘dot plot’, which indicated where individual voting members believe the target rate should move to based on current economic data and their view of monetary policy. As expected, members’ views have changed significantly compared to the last dot plot released in December 2018, as the chart below shows.

Fed dot plot versus previous quarter


Source: Lonsec, FOMC

In particular, the majority of members believe the funds rate should remain where it is at a target range of 2.25–2.50% for the rest of 2019, compared to the previous quarter when only two members saw rates staying where they were. Looking forward to 2020, the dot plot shows the median view is for rates to again remain on hold, although most see rates rising by at least 25 basis points. Even out to 2021, there is a firmer bias towards either no change or a more modest rise.

Interestingly, though, there is nothing pointing to a rate cut, which implies there is still a disconnect between what the Fed is thinking and what markets are hoping for. Over the long run nothing much has changed, although as a famous economist once said, in the long run we’re all dead.

This article has been prepared for licensed financial advisers only. It is not intended for use by retail clients (as defined in the Corporations Act 2001) or any other persons. This information is directed to and prepared for Australian residents only. This information may constitute general advice. It has been prepared without taking account of an investor’s objectives, financial situation or needs and because of that an investor should, before acting on the advice, consider the appropriateness of the advice having regard to their personal objectives, financial situation and needs.

Nominees for the Lonsec Money Management Fund Manager of the Year have been announced, with the winners to be announced at the 2019 Fund Manager of the Year Awards on 16 May. Congratulations to all who have received a nomination! A full list of nominees is available below:

Australian Large Cap Equities
Platypus Australian Equities Fund
AB Managed Volatility Equities Fund
Bennelong Australian Equities Fund

Australian Small Cap Equities
Fidelity Future Leaders Fund
Eley Griffiths Group Emerging Companies Fund
Perennial Value Microcap Opportunities Trust

Long/Short Equities
Solaris Australian Equity Long Short Fund
Antipodes Global Fund
Platinum International Healthcare Fund

Responsible Investments
Alphinity Sustainable Share Fund
Pengana WHEB Sustainable Impact Fund
Australian Ethical Australian Shares Fund (Wholesale)

Global Equities
Generation Wholesale Global Share Fund
Ironbark Royal London Concentrated Global Share Fund
AB Global Equities Fund

Global Emerging Market Equities
Fidelity China Fund
Colonial First State Asian Growth Fund
Robeco Emerging Conservative Equity Fund

Australian Property Securities
Pendal Property Securities Fund
Legg Mason Martin Currie Real Income Fund
Charter Hall Maxim Property Securities Fund

Global Property Securities
Principal Global Property Securities Fund
SGH LaSalle Global Property-Rich Fund
Quay Global Real Estate Fund

Direct and Hybrid Property
Aust Unity Retail Property Fund
Aust Unity Diversified Property Fund
Charter Hall Direct Office Fund

Infrastructure Securities
Colonial First State Global Listed Infrastructure Securities Fund
Magellan Infrastructure Fund
RARE Emerging Markets Fund

Australian Fixed Income
Legg Mason Western Asset Australian Bond Fund
Macquarie Australian Fixed Interest Fund
Janus Henderson Australian Fixed Interest Fund

Global Fixed Income
Colchester Global Government Bond Fund
PIMCO Global Bond Fund
Legg Mason Western Asset Global Bond Fund

Alternative Strategies
P/E Global FX Alpha Fund
Winton Global Alpha Fund
Partners Group Global Value Fund (AUD)

Multi Asset
Cbus Industry Growth
BMO Pyrford Global Absolute Return Fund
MLC Wholesale Inflation Plus Moderate Portfolio

Retirement and Income
Pendal Monthly Income Plus Fund
Legg Mason Martin Currie Real Income Fund Class A Units
Challenger Annuities

Emerging Manager
Lennox Australian Small Companies Fund
Daintree Core Income Trust
Quay Global Real Estate Fund

Listed Investment Companies & Trusts
Australian Foundation Investment Company Limited
Mirrabooka Investments Limited
MCP Master Income Trust

Separately Managed Accounts
Quest Australian Equities Concentrated Portfolio
iShares Enhanced Strategic Growth
AB Concentrated Global Growth Equities Portfolio

ETF Provider of the Year
BetaShares
Vanguard
Van Eck 

February was another positive month for equity markets as they continued their upward trajectory, boosted by the Federal Reserve’s decision to place rate hikes on hold.
This article is intended for licensed financial advisers only and is not intended for use by retail investors.

February was another positive month for equity markets as they continued their upward trajectory, boosted by the Federal Reserve’s decision to place rate hikes on hold. But how long can markets remain placated? Despite the reprieve, key market risks remain, including a reduction in liquidity as central banks cease their quantitative easing programs, and tighter credit conditions, which have had a significant impact on those parts of the market supported by cheap debt and ample liquidity.

In uncertain market environments such as the one we find ourselves in, diversification becomes ever more critical to managing portfolio risk. Diversification across asset classes is key, but diversification across different investment strategies – such as absolute return and long-short equity strategies – is also essential.

There has been a lot of debate around whether bonds, which are traditionally seen as diversifiers to equities, can continue to deliver meaningful diversification benefits given the relatively low-yield world we are in. The chart below shows the rolling one-year correlation between global equities and global bonds. It shows that the correlation is not static: there are periods of negative correlation but also periods of significant positive correlation. Equity and bond correlations are influenced by a variety of factors. Rapid changes in real rates and inflation have tended to result in a positive correlation, an example being the ‘taper tantrum’ in 2013, which saw a surge in Treasury yields and a sell-off in equity markets. Conversely, growth shocks have tended to result in a negative correlation between equities and bonds as investors generally seek safe haven assets such as treasuries.

Equities and bonds are not always negatively correlated

Equities and bonds are not always negatively correlated
Source: Lonsec, FE
Global equity returns based on the MSCI AC World ex Australia TR Index AUD. Global bond returns based on the Bloomberg Barclays Global Aggregate TR Index AUD Hedged.

So, do bonds still have a role to play in portfolio diversification? In our view bonds continue to play a key diversification role despite the low yield environment, and indeed we have seen bonds act as a diversifier to equities in recent periods where there has been a flight to safety. However, it is important to recognise that correlations between asset classes can change, and under certain conditions they may become correlated when you don’t want them to. This is why Lonsec’s managed portfolios are constructed to provide not only asset class diversification but diversification across a range of investment manager strategies and styles, which will perform differently as market conditions change. Given the current market uncertainty, this is an essential means of managing portfolio risks and delivering superior investment performance through the market cycle.

This article has been prepared for licensed financial advisers only. It is not intended for use by retail clients (as defined in the Corporations Act 2001) or any other persons. This information is directed to and prepared for Australian residents only. This information may constitute general advice. It has been prepared without taking account of an investor’s objectives, financial situation or needs and because of that an investor should, before acting on the advice, consider the appropriateness of the advice having regard to their personal objectives, financial situation and needs.

Is the world a more uncertain place today than it was yesterday? And if so, how much more uncertain is it? If these questions only lead to more uncertainty, then the Atlanta Fed might have some answers. The central bank calculates two indices – one for economic policy uncertainty and one for market uncertainty – that are designed to reflect the degree of unpredictability in the world.

The first index is based on the proportion of news stories that refer to uncertainty, major policy changes, and disagreement among forecasters. The second index does something similar but relates to stories about the economy and share markets. While not exactly a hard science, both provide an indication of how much the world disagrees on what will happen next.

While the practical utility of such measures might be a little dubious (unless you enjoy staying awake at night), it’s interesting to see if our own experience of the world correlates with what the media and other commentators are saying. Of course, the challenge is in differentiating real risks and uncertainty from the feedback loop of fear – in other words, these charts should be used responsibly!

Is the world more uncertain? It depends how you look at it

Is the world more uncertain? It depends how you look at it.

Source: Atlanta Fed

So, what are these indices telling us right now? The economic policy uncertainty index for the US shot higher at the start of 2019, reaching its highest level since the start of the Global Financial Crisis. This would certainly fit with the current geopolitical climate, including the US-China trade dispute, ongoing debate on tax reform, and of course the political deadlock over congressional funding for a border wall.

Interestingly, however, the index relating to market uncertainty dropped, and historically the two series have not always moved tightly together. Does this mean markets have entered a state of delusion, or is the uncertainty surrounding geopolitics overblown?

This is the critical question for wealth managers, and one we’ll be investigating with some of Australia’s leading strategists at the upcoming Lonsec Symposium. If you’re interested in how portfolio managers and financial advisers can manage uncertainty and the risks of regulatory change, then you can’t afford to miss out.

This article is intended for licensed financial advisers only and is not intended for use by retail investors.

Equity markets have continued their recovery through February, with the S&P 500 and S&P/ASX 300 both rising 5.2% in Australian dollar terms in the first three weeks of the month. This comes on the back of January’s gains of 4.5% and 2.6% respectively. In price terms, the US index has recovered from a sharp fall in December, while the ASX has clawed back nearly all losses suffered in the final quarter of 2018.

US markets have led the comeback, buoyed by the Federal Reserve’s pivot to a more dovish stance on monetary policy after announcing that it will keep rates on hold until further notice. This was coupled with strong earnings results from companies such as Facebook (+23.5% since the start of 2019) and General Electric (+34.4%), with both beating revenue and earnings expectations and addressing investor concerns head-on. Over the last 12 months we have also seen an increase in market volatility, with risk measures such as the VIX spiking in December. But as the chart below shows, volatility eased following the Fed’s revised expectations, with the VIX dropping to a four-month low.


Source: CBOE, Bloomberg

Does this mean that we’ve seen an end to volatility? Our view is that volatility will remain at a heightened level – or, arguably, at more normal levels – over the course of 2019. While we may see a pause in rate rises in the US, we continue to believe that we are at the late stage of the cycle. The winding back of central bank liquidity support via quantitative easing, tighter access to credit, and the possible flow on effects of a slow-down in the Australian housing market, remain the key issues for investors, while shorter-term indicators such as price momentum have turned negative. Furthermore, geopolitical risks associated with the Brexit negotiations and the ongoing trade discussions between the US and China remain potential sources of volatility.

So, what does this mean for Lonsec’s managed portfolios? We are starting to see pockets of value appearing on a sector level. An example of this is within emerging markets, which sold off over 2018 and have since showed signs of stabilising. We are also seeing more investment opportunities on a stock level where the increase in market volatility is providing an opportunity to invest in quality companies at a reasonable price. However, value measures take a long-term view of the market, and assets can remain ‘cheap’ or ‘expensive’ for extended periods, hence it is also important to look at business cycle and other medium-term indicators.

We remain neutral on equities, with our main active asset allocation position being a positive tilt towards alternative assets. The outlook for markets is far from clear, and in our portfolio communications we are emphasising the need for portfolio diversification across asset classes and investment strategies. Given our view that we should continue to expect bouts of volatility, we believe that such an environment will be conducive to an active approach to investing, both at the asset allocation and security level.

This article has been prepared for licensed financial advisers only. It is not intended for use by retail clients (as defined in the Corporations Act 2001) or any other persons. This information is directed to and prepared for Australian residents only. This information may constitute general advice. It has been prepared without taking account of an investor’s objectives, financial situation or needs and because of that an investor should, before acting on the advice, consider the appropriateness of the advice having regard to their personal objectives, financial situation and needs.

Last year marked the ten-year anniversary since the Global Financial Crisis (GFC), and while the global economy and our financial institutions have recovered, the same cannot be said for our democratic institutions. In a post-GFC world, liberal democracies have encountered a popular revolt from disenchanted voters expressing their resentment towards the economic systems and cultures that have left them behind. The surge in right-wing populism across the world has been symptomatic of globalisation, deregulation and the financialization of the economy at the expense of the working class.

Naturally, the resultant wage stagnation and off-shoring of domestic jobs has benefited the ‘wealthy elites’ who embrace a world of open borders and an abundance of labour. However, the growing inequality divide has stoked resentment and resulted in an insurgency against the so-called elite.

The rise of right-wing populism has had far-reaching implications for global equity markets and economic growth through increased geopolitical risks and heightened volatility. The two primary beneficiaries in modern history of this populist uprising have been US President Donald Trump and the Brexit campaign. While there are a myriad of other examples which could be drawn upon, such as the right-wing coalition government in Italy or Brazil’s recently elected populist leader Jair Bolsonaro (known as the ‘Tropical Trump’), it has been the Trump presidency and the Brexit fiasco which have had the biggest implications for global markets.

Donald Trump

Although a political novice and a bombastic provocateur, Trump unexpectedly rode into the White House by leveraging the collective anxieties of his rustbelt base. Trump was able to garner the enthusiasm of energetic, anti-establishment voters by vowing to “drain the swamp” and “make America great again”. Trump successfully portrayed himself as the voice of the downtrodden, committed to his own form of populist nationalism (despite being a billionaire himself).

The primary target of Trump’s rancor has been China, and the recent trade war has shaken equity markets both at home and abroad. Trump’s key gripe with China stems from the burgeoning trade deficit, which was US $375 billion in 2017 and which he claims has resulted in the destruction of the American manufacturing industry. America has seen a return to protectionism, with tariffs applied to a wide range of Chinese products in an effort to reduce the trade gap – even if the policy might be at odds with the traditionally pro-free market Republican party.

Predictably, China responded with its own tariffs, and global equity markets have been whipsawing erratically since. Fortunately for China, the yuan depreciated significantly against the US dollar during this period, which worked to partially offset the negative impact of the tariffs. This further fanned the flames between the two countries as Trump has frequently accused the People’s Bank of China for manipulating its currency to gain a competitive economic advantage. In addition to the trade deficit, Trump has been steadfast in his demands regarding the appropriation of foreign intellectual property in China.

While concessions might be made to reduce the trade imbalance, it is unlikely that Chinese President Xi Jinping will acquiesce to Trump’s demands regarding intellectual property theft given the ambitious ‘Belt and Road’ initiative and the ‘Made in China 2025’ policies. Consequently, equity market participants eagerly await the outcome of the negotiations when the ceasefire is set to expire on 1 March 2019.

As the table below shows, the US-China trade dispute has had an undeniable impact on China’s equity market returns in calendar year 2018, with the Shanghai Shenzhen CSI 300 PR Index (RMB) falling 25.3%. Unfortunately, the concerns surrounding the trade frictions were not contained in Asia, with a contagion effect spreading across the globe, placing downward pressure on all equity markets. Thus far, it has been a war of attrition, with both sides resolute in their demands.

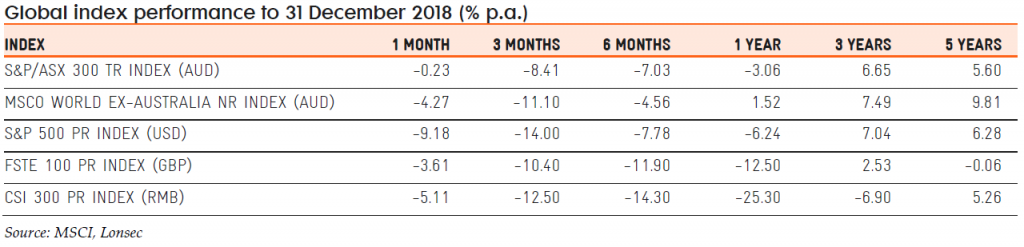
China’s questionable growth trajectory and the ensuing impact on their global trading partners has further compounded investor concerns. Of importance is China’s trading relationship with Australia, and given China is our largest export market, we are particularly susceptible to a slowdown in Chinese growth and consumption. Consequently, Trump’s populist policies have impacted our domestic equity market with what the pundits have termed ‘the Trump dump’, which saw the S&P/ASX 300 TR Index return a crushing -8.4% for the 2018 December quarter.

Economic ailment and a fear of the fraying of the American social fabric contributed to the formulation of a key plank of the Trump campaign: the wall. The centerpiece of Trump’s foreign policy platform with Mexico is his proposed wall on the US southern border (which Mexico will pay for, of course). However, political gridlock in Congress and the president’s unwillingness to compromise led to the longest government shutdown on record and culminated in a heavy selloff in equity markets in December 2018.

Notwithstanding Trump’s best efforts, his brand of economic nationalism is yet to bear fruit, and there has been little reprieve for the jaded working class who voted for him. While NAFTA has been renegotiated it is unclear whether the ‘wins’ match the campaign rhetoric. Moreover, the trade war is yet to reap any benefits for the forgotten manufacturing workers. Rather, it has weakened global capital markets and hurt American farmers. The wall remains stuck in the ‘swamp’ and the economic impact of the month-long government shutdown is still being tallied. Subsequently, the president has controversially declared a national emergency to release the capital to fund its construction.

Trump’s incendiary personality and Tweets aside, he has been able to successfully legislate meaningful tax reform in America and reinvigorated Regan-era trickle-down economics. Lower individual tax rates have been negotiated, however these were dwarfed by the corporate tax cuts, which were slashed from 35% to 21%. These policies have proved successful with his aspirational base while additionally providing buoyancy to one of the longest-running bull markets on record.

Brexit

The success of the Brexit vote hinged primarily on issues pertaining to sovereignty and migration, and the leaders of the ‘leave’ movement were able to successfully galvanize a support base of Eurosceptics. However, the implications for the corporate sector and the broader equity markets have been considerable. Unsurprisingly, the result of the referendum has upended the domestic share market in the UK and left global markets on tenterhooks.

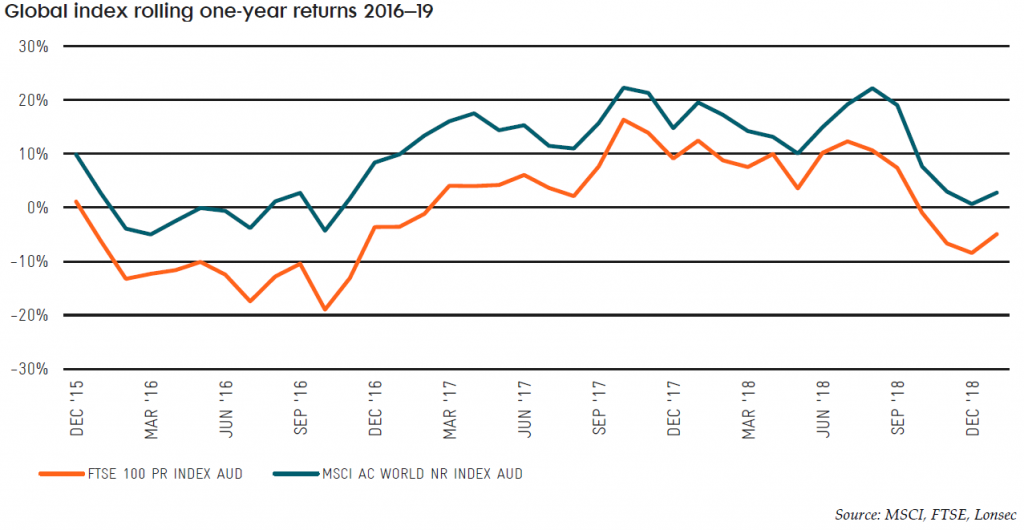
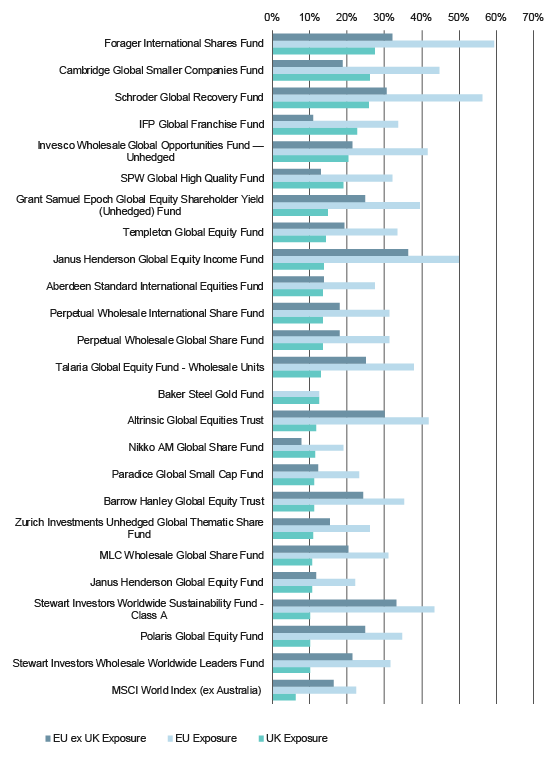
The below chart illustrates the perilous position of FTSE 100 investors since the 2016 Brexit referendum, with the index significantly underperforming the broader global equity market over this period. Similarly, the value of the pound has been on a near linear downward trajectory as investors seek protection from the uncertainty surrounding the final outcome.

There has been mounting speculation as to the longer-term economic impacts that Brexit will have on the economy and businesses domiciled in the UK. Many economists have warned that leaving the European Union would reduce per-capita income levels for UK citizens while simultaneously crimping corporate sector activity. With regards to a ‘no-deal’ Brexit, the outcome could potentially be disastrous for the UK economy and corporate sector. The consensus among economists points to a likely economic contraction due to diminished foreign direct investment, additional trade barriers and reduced immigration. This could pose significant headwinds for GDP, as immigration typically boosts growth by increasing aggregate demand.

The corporate sector has similarly been thrust into turmoil, with companies restructuring their affairs in preparation for a disorderly exit. The industries most exposed will likely be those operating in highly regulated industries such as financial services and air travel, which face additional post-Brexit uncertainty. Typically, companies at risk have sought to establish subsidiaries in neighboring countries within the European Union or to redomicile their headquarters completely. Naturally, this process is expensive and will impact profit margins. For companies operating in the retail or consumer staples sectors, a corporate restructure is not a realistic option. Consequently, these companies will most likely be mired with supply chain disruptions and adverse currency movements impacting their bottom lines. More broadly, the issue of labour shortages has come to the fore, with a reduction in access to skilled labour creating a key business risk.

Brexit is likely to continue to pose an ongoing threat to the UK economy and corporate sector, and could potentially require significant adaptation and adjustment for local businesses—at material cost. Therefore, the ongoing stability and health of capital markets both domestically and abroad is directly at risk. As can be seen, nationalist sentiment heightens geopolitical risks in a globally connected world economy and turbocharges volatility, so investors beware.

Implications for portfolio construction

Trump’s policies are based on conflicting viewpoints. He is advocating for protectionism and championing the working class through a return of the American manufacturing industry—at the expense of China. At the same time, he has overhauled corporate regulations and slashed taxes, which should hardly appeal to the anxieties of frustrated voters. A similar wave of anti-globalist and nationalistic sentiment has likewise gripped the UK and propelled right-wing populism to the fore. These are not likely to be isolated incidents, and rather are representative of a global trend to renounce the political elite in favor of populists.

This article has highlighted the relationship between an upsurge in right-wing populism, and the resultant impact on global markets. The hostile rhetoric employed by populist leaders has become all too predictable, albeit successful, in galvanizing a disenfranchised support base. With the regressive left pitched against the radical right, there are no clear winners.

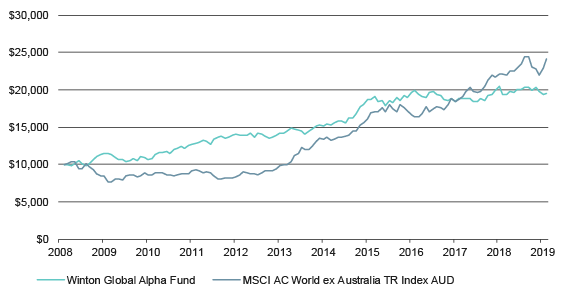
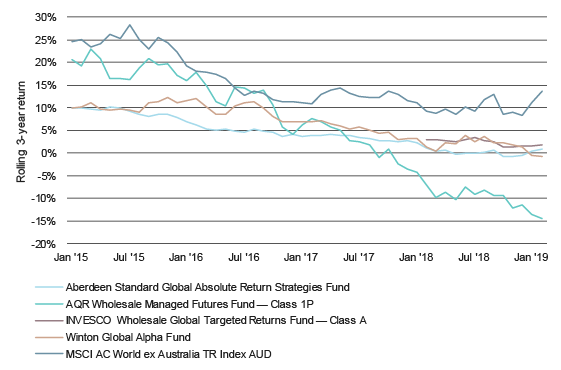
The reaction across stock markets has been varied, with indiscriminate selloffs often followed by relief rallies. Consequently, as we enter periods of growing political unrest and market volatility, the role of active management within a diversified portfolio becomes more critical. Times of increased volatility create mispricing opportunities for active fund managers to exploit, and can potentially deliver alpha to patient investors. As such, prudent investors should seek to capitalize on market inefficiencies during bouts of extreme volatility. As the legendary Oracle of Omaha (Warren Buffet) put it, “Be greedy when others are fearful.”

With respect to portfolio construction:

1. Challenging macroeconomic conditions provide opportunities for skilled investors. The proliferation of passive investment products has led to price distortions and programmatic trading, which during periods of heightened volatility can suffer without clear trends. However, increased volatility provides opportunities for active managers to protect capital on the downside through a range of options depending on their mandates (e.g. by increasing cash allocations or shorting). Similarly, volatility can expose mispricing that can be exploited by active managers.

2. Populism tends to be intertwined with economic rationalism which can favour small-cap stocks, as these domestically focused companies should, prima facie, perform proportionally better than larger and more globally exposed peers.

IMPORTANT NOTICE: This document is published by Lonsec Research Pty Ltd ABN 11 151 658 561, AFSL 421 445 (Lonsec).

Please read the following before making any investment decision about any financial product mentioned in this document.

Warnings: Lonsec reserves the right to withdraw this document at any time and assumes no obligation to update this document after the date of publication. Past performance is not a reliable indicator of future performance. Any express or implied recommendation, rating, or advice presented in this document is a “class service” (as defined in the Financial Advisers Act 2008 (NZ)) or limited to “general advice” (as defined in the Corporations Act (C’th)) and based solely on consideration of data or the investment merits of the financial product(s) alone, without taking into account the investment objectives, financial situation and particular needs (“financial circumstances”) of any particular person.

Warnings and Disclosure in relation to particular products: If our general advice relates to the acquisition or possible acquisition or disposal or possible disposal of particular classes of assets or financial product(s), before making any decision the reader should obtain and consider more information, including the Investment Statement or Product Disclosure Statement and, where relevant, refer to Lonsec’s full research report for each financial product, including the disclosure notice. The reader must also consider whether it is personally appropriate in light of his or her financial circumstances or should seek further advice on its appropriateness. It is not a “personalised service” (as defined in the Financial Advisers Act 2008 (NZ)) and does not constitute a recommendation to purchase, hold, redeem or sell any financial product(s), and the reader should seek independent financial advice before investing in any financial product. Lonsec may receive a fee from Fund Manager or Product Issuer (s) for reviewing and rating individual financial product(s), using comprehensive and objective criteria. Lonsec may also receive fees from the Fund Manager or Financial Product Issuer (s) for subscribing to investment research content and services provided by Lonsec.

Disclaimer: This document is for the exclusive use of the person to whom it is provided by Lonsec and must not be used or relied upon by any other person. No representation, warranty or undertaking is given or made in relation to the accuracy or completeness of the information presented in this document, which is drawn from public information not verified by Lonsec. Conclusions, ratings and advice are reasonably held at the time of completion but subject to change without notice. Lonsec assumes no obligation to update this document following publication. Except for any liability which cannot be excluded, Lonsec, its directors, officers, employees and agents disclaim all liability for any error, inaccuracy, misstatement or omission, or any loss suffered through relying on the information.

Copyright © 2019 Lonsec Research Pty Ltd, ABN 11 151 658 561, AFSL 421 445. All rights reserved. Read our Privacy Policy here.

Labor’s proposed changes to franking credits will result in a meaningful reduction in income for zero or low tax rate retirees invested in equity funds, according to analysis by leading research house Lonsec.

The research shows that the changes would have the biggest impact on dividend focused funds and Listed Investment Companies (LICs), which generally seek to maximise the value of franking credits to boost income for investors.

The charts below show the average yield and franking benefit for dividend focused funds and LICs researched by Lonsec. For a hypothetical investor paying no tax, the average franking benefit for both product groups is 2.0% on an annual basis, while the distribution yield is around 7.5% for dividend-focused funds and 4.7% for LICs. This compares favourably to the broader Australian equity market, which currently delivers a franking benefit of 1.6% and a distribution yield of 4.3%.

Average franking benefit & distribution yield for dividend focused funds (FY14 to FY17)


Source: Lonsec

Average franking benefit & distribution yield for LICs (FY14 to FY17)


Source: Lonsec

Labor’s proposal is designed to create a broader tax mix, and the removal of dividend refunds would help address distortions such as Australia’s significant home country bias. However, an Australian zero-percent taxpayer invested in an income-focused share fund would be at risk of losing a substantial boost to their after-tax investment income if the changes are implemented.

Most at risk are products with a higher than average franking benefit such as Plato Australian Shares Income Fund, Betashares Australian Top 20 Income Maximiser Fund, Perennial Value Share for Income Trust, Djerriwarrh Investments, and Mirrabooka Investments.

The changes would abolish cash refunds of franking credits for all Australian investors other than charities, endowments and some welfare recipients. Under the proposed changes, the system of dividend imputation will not change, but investors will no longer be able to claim cash refunds on excess imputation credits.

Important information: Any express or implied rating or advice is limited to general advice, it doesn’t consider any personal needs, goals or objectives.  Before making any decision about financial products, consider whether it is personally appropriate for you in light of your personal circumstances. Obtain and consider the Product Disclosure Statement for each financial product and seek professional personal advice before making any decisions regarding a financial product.