Investors are constantly warned of an impending crisis in financial markets with the resultant damage to asset prices. Yet while a crisis can have a severe impact on markets, investors who avoid herd-like selling can often ride out the slumps. For active and contrarian fund managers, such periods of disruption can also present opportunities.

The below chart reveals the impact on financial markets of eight memorable political and market crises over the last twenty years. The chart shows the impact each event had on the performance of US shares, measured by the Dow Jones Industrial Average, on the day of the crisis and over the subsequent 150 trading days.

Dow Jones Industrial Index performance following a crisis


Source: Lonsec, Bloomberg, FE

In all but one case—the Global Financial Crisis which began in 2008—the Dow Jones had rebounded by the 150-day mark and in many instances had produced gains that exceeded the initial loss. Lonsec does not recommend a strategy that seeks to time the market but the analysis highlights that in general major crises have an only short-term impact on markets.

Release ends

The managed account model is at the centre of a nascent revolution in financial advice. As pressures build on traditional advice businesses, the efficiencies offered by managed accounts have led advisers to rethink how they deliver advice and manage investments on behalf of clients. But while there are clear opportunities, the drive to shift to a managed account offering can result in rushed implementation, poorly aligned business practices and, critically, sub-optimal investment outcomes.

A well marketed but misconceived view is that the accessibility of managed account technology will inevitably lead to a win-win for businesses and clients. While the headline is correct, unfortunately this outcome is not guaranteed by the technology itself. For advisers to unlock the full benefits of the managed account model, as well as meet their clients’ best interests, they need to be able to provide quality portfolios backed by the right governance and compliance structures.

The implementation dilemma — adapting to the new world of financial advice

Successful implementation of managed accounts requires a whole of business transformation, and this naturally presents a range of commercial and operating risks. A number of advice practices have opted to go it alone by offering a private label managed account solution, acting as both adviser and model manager. Putting aside ASIC’s concerns regarding vertically integrated advice, the real risk for advisers is in underestimating the resources and skills required in the development of the model portfolios, as well as ongoing analysis and reporting of a public offer document.

The development of an institutional grade solution involves proof of concept with the construction and management of the portfolios, as well as time-consuming monitoring and reporting on investment performance. Naturally, this requires an investment committee with the right mix of skills and knowledge, a clear investment philosophy and process, and the capacity to filter and analyse the investment product universe. Advisers embarking on the managed account journey with minimal research, outdated traditional models, or poorly funded governance and compliance structures may end up facing higher costs in the long run. It will also place them clearly within the regulatory eyesight of ASIC.

What this means is that managed accounts, while presenting an opportunity for advisers, also present a very real dilemma. There are significant risks involved in implementation, but it is impossible for advisers to ignore the benefits of managed accounts. For ethical advisers who care about their clients, there is a need to balance a responsive and scalable investment solution with regulatory requirements and the costs of implementation. For many advisers, ASIC’s requirement for all discretionary account providers to be licensed, which came into effect this month, will make separately managed accounts (SMAs) an even more attractive solution.

As the wealth industry confronts the revelations from the Royal Commission into Financial Services, it awaits to be seen what recommendations will flow from the hearings and how the federal government will respond. While financial advice is unlikely to be radically impacted, advisers are still adapting to ongoing regulatory change, the most significant of which is FASEA’s education and training requirements. Nearly all advisers will be required to undertake further study, and many practices will need to recruit additional qualified advisers. Add to this the supervision of ethical standards compliance and advisers are facing increasing costs at a time when the demand for qualified advice is rising. In this environment, the ability to scale financial advice and the investment process is critical.

Scale and quality — the role of professional portfolio construction

One of the first steps to success for advisers is ensuring that they have the right research capabilities in place. The second step is to leverage this research with the right investment knowledge. This is where the help of external experts can be invaluable. By partnering with an investment research provider, advisers can expand the depth and breadth of their research and keep their clients informed of events impacting their portfolio as and when they occur.

Increasingly, however, advisers are taking this a step further and drawing directly on the expertise of their portfolio manager. This can be in the form of prepackaged model portfolios designed to cater to an array of risk profiles, or through a tailored, white label solution that reflects the adviser’s investment philosophy and client needs.

When considering an in-house managed account solution, the adviser should ensure they are of sufficient size to achieve scale benefits and that their in-house investment committee is equipped to deliver reliable investment outcomes on par with a dedicated team of research and portfolio construction professionals. From a client interest perspective, they should also ensure that their suite of model portfolio solutions is broad enough to cater to a range of risk profiles, or specialized enough to cater to particular retirement goals. Naturally, a small- to medium-sized client base makes this very difficult.

The future role of managed accounts, when coupled with excellent governance and sourcing of financially secure external experts, is a positive step for the advice profession and their clients. The key to success for participants is determining where the advice skill set is best used and where the cost of governance starts and ends in the new world.

Emerging market returns have been a cause for concern over recent weeks but by taking a broader perspective, investors may be able to take advantage of the volatility that is inherent in this sector.

Recent analysis by research house Lonsec reveals that while emerging markets experience strong bouts of volatility they have also produced significant real returns over the long term. The below chart compares the MSCI Emerging Market Index, which tracks a basket of emerging market indices, with the standard MSCI World Ex Australia Index, which tracks developed market indices.

The chart reveals that while the emerging market index has experienced more volatility it has also produced higher returns over the past 20 years.

Emerging versus developed—growth of $10,000 over 20 years

Source: Lonsec, Bloomberg

Performance to 31 August 2018

It is important to remember that the phrase ‘emerging markets’ captures a large number of diverse countries. While Turkey and Argentina have suffered from trade related uncertainty, political risks and a rising US dollar, other emerging economies are powering ahead.

For example, India is still the fastest growing major economy in the world. The relationship between GDP growth and share market performance is imperfect with rising GDP not necessarily translating to strong investment returns. However, in India’s case share market performance has been reasonably correlated with GDP growth, indicating that it is relatively sustainable.

As a result, the broader emerging market index often has countries that are outperforming, and therefore balancing, laggards. This may produce more volatility but not necessarily lower returns.

Indian equities performance versus GDP growth

Source: Lonsec, Bloomberg

Release ends

IMPORTANT NOTICE: This document is published by Lonsec Research Pty Ltd ABN 11 151 658 561, AFSL 421 445 (Lonsec).

Please read the following before making any investment decision about any financial product mentioned in this document.

Warnings: Lonsec reserves the right to withdraw this document at any time and assumes no obligation to update this document after the date of publication. Past performance is not a reliable indicator of future performance. Any express or implied recommendation, rating, or advice presented in this document is a “class service” (as defined in the Financial Advisers Act 2008 (NZ)) or limited to “general advice” (as defined in the Corporations Act (C’th)) and based solely on consideration of data or the investment merits of the financial product(s) alone, without taking into account the investment objectives, financial situation and particular needs (“financial circumstances”) of any particular person.

Warnings and Disclosure in relation to particular products: If our general advice relates to the acquisition or possible acquisition or disposal or possible disposal of particular classes of assets or financial product(s), before making any decision the reader should obtain and consider more information, including the Investment Statement or Product Disclosure Statement and, where relevant, refer to Lonsec’s full research report for each financial product, including the disclosure notice. The reader must also consider whether it is personally appropriate in light of his or her financial circumstances or should seek further advice on its appropriateness. It is not a “personalised service” (as defined in the Financial Advisers Act 2008 (NZ)) and does not constitute a recommendation to purchase, hold, redeem or sell any financial product(s), and the reader should seek independent financial advice before investing in any financial product. Lonsec may receive a fee from Fund Manager or Product Issuer (s) for reviewing and rating individual financial product(s), using comprehensive and objective criteria. Lonsec may also receive fees from the Fund Manager or Financial Product Issuer (s) for subscribing to investment research content and services provided by Lonsec.

Disclaimer: This document is for the exclusive use of the person to whom it is provided by Lonsec and must not be used or relied upon by any other person. No representation, warranty or undertaking is given or made in relation to the accuracy or completeness of the information presented in this document, which is drawn from public information not verified by Lonsec. Conclusions, ratings and advice are reasonably held at the time of completion but subject to change without notice. Lonsec assumes no obligation to update this document following publication. Except for any liability which cannot be excluded, Lonsec, its directors, officers, employees and agents disclaim all liability for any error, inaccuracy, misstatement or omission, or any loss suffered through relying on the information.

Copyright © 2018 Lonsec Research Pty Ltd, ABN 11 151 658 561 AFSL 421 445. All rights reserved. Read our Privacy Policy here.

Ten years since the collapse of US investment bank Lehman Brothers, Australia’s superannuation funds have accumulated over $1 trillion in retirement savings, providing a windfall for members prepared to take a long-term view.

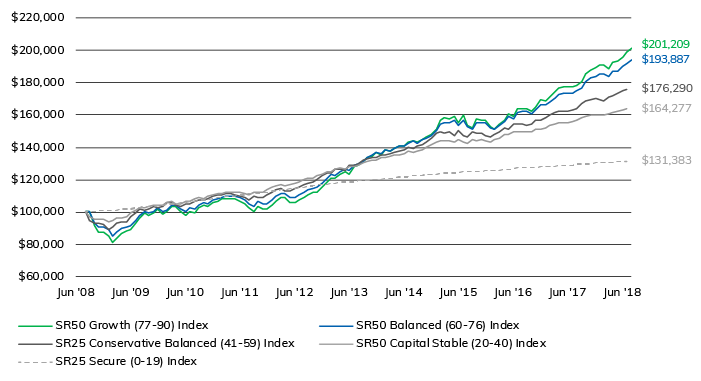
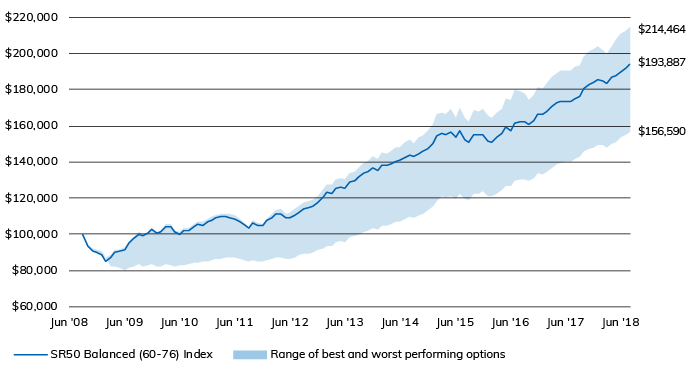
According to data from leading superannuation research house SuperRatings, members with a balance of $100,000 at the end of August 2008, just days before the Global Financial Crisis (GFC) hit, would today have a nest egg worth $193,887 if they remained in a balanced option. In contrast, members who panicked and shifted their savings to a capital stable option would have a far smaller balance of $164,277 (see chart below).

Growth of $100,000 invested over 10 years to 31 August 2018*

Select index

SR50 Balanced (60-76) Index
SR50 Growth (77-90) Index
SR25 Conservative Balanced (41-59) Index
SR50 Capital Stable (20-40) Index
SR25 Secure (0-19) Index

Source: SuperRatings

Interim results only

Source: SuperRatings

*Interim results

Investors who had stuck it out with their growth option would have fared even better, with $100,000 growing to $201,209 over the decade. The results show the importance of taking a long-term view, even in the face of severe crises such as the GFC.

“The failure of Lehman Brothers ushered in a period of intense crisis for the global financial markets, including in Australia,” said SuperRatings Executive Director Kirby Rappell. “We hoped then that the market crash would prove cyclical and that we would see a relatively quick recovery, but of course that did not happen.”

“But even in the face of the Great Recession, Australia’s superannuation funds have shown us that taking a long-term view and sticking with your investment strategy pays off. Super funds held their nerve and refrained from making rash decisions, and members continue to reap the benefits. After 10 years the GFC looks more like a speed hump.”

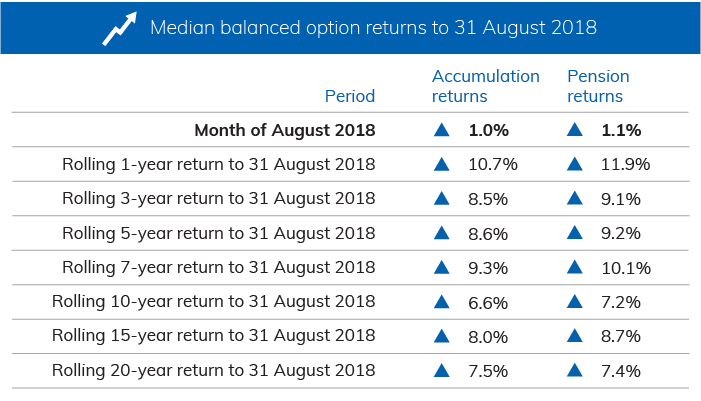
Interim results only. Median Balanced Option refers to ‘Balanced’ options with exposure to growth style assets of between 60% and 76%. Approximately 60% to 70% of Australians in our major funds are invested in their fund’s default investment option, which in most cases is the balanced investment option. Returns are net of investment fees, tax and implicit asset-based administration fees

According to SuperRatings’ data, the median balanced option grew at an estimated 1.0% in August, while the median growth option delivered 1.3%. Over ten years, results remain diminished by the GFC, with the median balanced option returning only 6.6% p.a. However, over the past seven years the median balanced option has returned a very healthy 9.3% p.a., with super funds riding the global share market rally which began in 2009.

“The lesson of the GFC is useful to bear in mind when confronting the risks and uncertainties in today’s market,” said Mr Rappell. “There are some significant risks, including the threat of tariffs on global trade and investment, central bank tightening, and the currency and bond crisis that has engulfed emerging markets. Funds need to maintain discipline and stick to their long-term return objectives in the interest of their members.”

Best and worst performing options over 10 years to 31 August 2018*

Source: SuperRatings

*Interim results

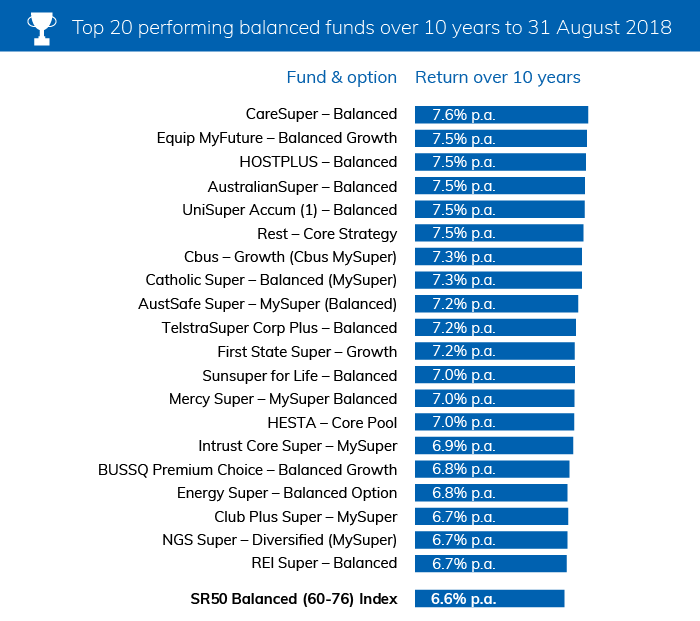
Australia’s top super funds take a long-term view

While the GFC continues to cast a shadow over long-term returns, Australia’s top performing funds have nevertheless delivered some impressive results. A comparison of balanced option returns shows that CareSuper remains ahead of the pack with an annual return of 7.6% over the past decade, followed closely by Equip MyFuture and HOSTPLUS.

Source: SuperRatings

*Interim results.

Source: SuperRatings

# IOOF Employer Super Core – IOOF MultiMix Balanced Growth Trust

*Interim results

Release ends

Warnings: Past performance is not a reliable indicator of future performance. Any express or implied rating or advice presented in this document is limited to “General Advice” (as defined in the Corporations Act 2001(Cth)) and based solely on consideration of the merits of the superannuation or pension financial product(s) alone, without taking into account the objectives, financial situation or particular needs (‘financial circumstances’) of any particular person. Before making an investment decision based on the rating(s) or advice, the reader must consider whether it is personally appropriate in light of his or her financial circumstances, or should seek independent financial advice on its appropriateness. If SuperRatings advice relates to the acquisition or possible acquisition of particular financial product(s), the reader should obtain and consider the Product Disclosure Statement for each superannuation or pension financial product before making any decision about whether to acquire a financial product. SuperRatings research process relies upon the participation of the superannuation fund or product issuer(s). Should the superannuation fund or product issuer(s) no longer be an active participant in SuperRatings research process, SuperRatings reserves the right to withdraw the rating and document at any time and discontinue future coverage of the superannuation and pension financial product(s). Copyright © 2018 SuperRatings Pty Ltd (ABN 95 100 192 283 AFSL No. 311880 (SuperRatings)). This media release is subject to the copyright of SuperRatings. Except for the temporary copy held in a computer’s cache and a single permanent copy for your personal reference or other than as permitted under the Copyright Act 1968 (Cth.), no part of this media release may, in any form or by any means (electronic, mechanical, micro-copying, photocopying, recording or otherwise), be reproduced, stored or transmitted without the prior written permission of SuperRatings. This media release may also contain third party supplied material that is subject to copyright. Any such material is the intellectual property of that third party or its content providers. The same restrictions applying above to SuperRatings copyrighted material, applies to such third party content.

// GLOBAL PARAMETERS

var chartHeight = 376;
var chartWidth = 700;
var startAmt = 100000;
var numAxes = 8;

// DATA

// SR50 Balanced (60-76) Index

var balancedPrices = [
100000,
93352.9,
90449.62481,
90338.1908722341,
88669.7348250148,
85423.9791817451,
87337.4763154162,
90005.6362168522,
90914.6931426424,
91396.5410162984,
94705.0958010884,
97655.1595352923,
100145.366103442,
99093.1387417934,
100391.258859311,
102592.337209801,
100366.083492349,
101206.047245096,
104141.022615204,
104055.418694614,
101429.892370112,
100179.667516758,
102184.1624841,
101782.885278025,
104062.821908253,
105455.078402564,
105268.001093478,
107042.714323912,
108102.437195719,
109280.753761153,
109652.30832394,
109811.30417101,
109531.285345374,
108808.378862095,
107304.320641084,
105333.998705472,
103425.767984924,
106297.798136097,
105222.914801345,
105108.221824212,
107509.839584673,
109439.641205218,
111072.371212359,
111405.588325996,
108960.90409577,
109234.069082338,
110408.335324973,
112219.032024303,
113877.180441494,
114846.389124231,
115459.094610209,
117670.829026562,
120684.849641249,
123038.204209253,
122809.722264036,
125288.513698214,
126153.004442731,
125390.787989888,
129204.298025025,
129774.088979315,
131505.14555221,
133828.315453536,
134878.867729846,
136821.123425156,
135663.479899855,
138501.69556284,
138010.014543592,
139007.274908684,
140471.994564397,
140724.844154613,
142441.687253299,
143675.802031662,
142817.626466127,
144567.999296096,
145646.332002845,
147346.024697318,
150189.360935903,
154641.424162126,
155570.973762764,
155103.016273686,
156605.188986296,
153441.764168773,
157001.613097489,
152421.091035369,
150902.367284293,
155411.631823482,
154909.030606165,
155160.60287187,
151661.731277109,
150911.005707287,
153491.28208287,
155594.41962997,
159149.752118515,
157558.25459733,
161735.754159723,
162199.774038407,
162272.763936725,
161039.490930806,
162917.37243455,
166420.095941892,
166237.033836356,
168065.641208556,
170569.819262564,
172943.81000706,
173762.698947444,
173797.451487233,
173884.350212977,
174922.265899398,
176557.789085557,
180563.53220433,
182827.618334641,
183906.301282815,
185451.114213591,
185092.266307587,
183759.601990173,
186736.507542413,
187423.884626677,
189935.364680675,
191929.686009822,
193887.368807122
];

// SR50 Growth (77-90) Index

var growthPrices = [
100000,
91467.9,
87758.876655,
87399.0652607145,
85267.3146599404,
81293.8577967872,
83676.6620626689,
86973.522547938,
88265.0793577749,
89103.5976116738,
93041.9766261098,
96428.7045753001,
99234.7798784414,
97715.6938680622,
99147.2287832293,
101814.289237498,
98983.8519966957,
99960.5256643471,
103639.073008795,
103421.430955477,
99863.7337306082,
98116.1183903226,
100500.340067207,
99706.3873806765,
102383.503881848,
103987.853387676,
103748.681324885,
105737.232299839,
106889.768131907,
108204.512279929,
108496.664463085,
108540.06312887,
107975.6548006,
106939.088514514,
104933.980604867,
102296.150200422,
100011.058797245,
103564.951771605,
102045.653929116,
101802.887318418,
104521.02440982,
106726.418024867,
108617.716878686,
108834.952312443,
105492.957431785,
105762.386445066,
107065.590570842,
109014.184319231,
110758.411268339,
111815.821820718,
112491.972095268,
114955.546284154,
118580.324569586,
121165.375645203,
120807.93778705,
123655.743304504,
124635.962381679,
123676.26547134,
128294.213547774,
128862.043736937,
130885.048961563,
133555.103960379,
134789.954451596,
136919.635731932,
135303.984030295,
138668.994113128,
137934.048444329,
139037.520831883,
140658.281212221,
140735.643266887,
142826.83419019,
144131.98580102,
143087.893695877,
144975.938453194,
146237.664045553,
148297.421543634,
151518.441539562,
157068.259016273,
158041.925153915,
157520.544842832,
159372.828929639,
155456.082285864,
159762.215765183,
153920.670107944,
151996.661731595,
157386.159363274,
156794.859562546,
157026.131980401,
152516.184443792,
151326.55820513,
154306.93476898,
156808.558795455,
161078.612660014,
158775.188498976,
163828.050097767,
164174.054939574,
164131.698033399,
162359.075694639,
164891.877275475,
169483.95116572,
169009.396102456,
171189.617312177,
174082.721844753,
176799.456801862,
177555.981677517,
177413.936892175,
177344.745456787,
178490.392512438,
180457.535128318,
185340.35511382,
188141.2185603,
189495.835333934,
191211.530627048,
190663.900803332,
188528.465114334,
192449.857188713,
193315.881546062,
196058.260641674,
198626.62385608,
201208.769966209
];

// SR25 Conservative Balanced (41-59) Index

var australianPrices = [
100000,
94930,
92794.075,
92929.36876135,
91913.6507607884,
89271.1333014158,
90756.8727729512,
92821.5916285359,
93582.7286798899,
94200.3746891771,
96922.7655176944,
99547.143239617,
101556.800967338,
100845.903360567,
102065.130332196,
103626.726826279,
102424.656795094,
103155.559145984,
105509.981627932,
105642.396654875,
103782.139692179,
103089.497691874,
104649.241791952,
104795.75073046,
106432.450765369,
107553.716634182,
107294.189515943,
108543.308470288,
109465.926592286,
110516.799487571,
110848.349886034,
111191.979770681,
111193.536458398,
110648.688129752,
109871.823690393,
108730.035698602,
107232.170726818,
109466.460236082,
108820.608120689,
109001.032688953,
110886.750554472,
112405.788150318,
113820.97702313,
114242.114638116,
112859.67080888,
113198.249821307,
114240.352909162,
115725.477496981,
117113.95177599,
118031.071132347,
118537.660489647,
120158.662996843,
122370.904141278,
124181.993522569,
124107.484326456,
126341.915474269,
126733.575412239,
125760.515020224,
128581.323372128,
128847.229548861,
130048.858811634,
131848.865066446,
132527.754872673,
133880.598194413,
133336.775204548,
135439.496149523,
135073.80950992,
136006.088943157,
137243.74435254,
137611.145856171,
138810.7022146,
139902.170766113,
139219.448172775,
140668.722628253,
141737.804920228,
143189.483518221,
145529.056489425,
148526.955053107,
149239.587383452,
148657.552992657,
149580.121766529,
147306.503915678,
150215.807368012,
147303.273078954,
146187.598088654,
149286.775168133,
148759.942138565,
148878.950092276,
146844.072602415,
146256.696312005,
147807.017292912,
149203.941413348,
151815.010388081,
151179.664569607,
154211.723922215,
154515.675230066,
154490.952722029,
153548.557910425,
154439.139546305,
156925.609693001,
156800.069205246,
158273.989855776,
159983.348946218,
161747.325351699,
162476.158799734,
162313.682640934,
162318.065110365,
163064.565891808,
164048.497482399,
166894.738913719,
168563.686302856,
169128.37465197,
170117.944772059,
169790.637846318,
168924.705593301,
171061.603119057,
171708.044917244,
173330.685941711,
174735.011159211,
176290.152758528
];

// SR50 Capital Stable (20-40) Index

var internationalPrices = [
100000,
96633.6,
95482.3072896,
95701.9165963661,
95292.1209895004,
93600.6858419368,
94570.5761486309,
95931.1630276813,
96463.5809824849,
97090.5942588711,
99037.1635831672,
100894.110400352,
102435.671513159,
102189.825901527,
103197.724154394,
104229.701395938,
103781.513679935,
104396.522930002,
105868.513903315,
106196.494559388,
105324.408946066,
105250.681859804,
106349.393727738,
106907.728044809,
107893.310389654,
108659.352893421,
108535.589890475,
109403.874609599,
110235.344056632,
111040.062068245,
111450.910297898,
111885.56884806,
112204.442719277,
112041.746277334,
111827.634500198,
111477.725831847,
110871.06404787,
112279.126561278,
112071.410177139,
112507.704176959,
113959.053560842,
115098.64409645,
116105.757232294,
116745.383848887,
116292.645250321,
116649.082208013,
117626.601516916,
118690.651754238,
119818.212945903,
120561.085866168,
121012.828254908,
122209.161075037,
123633.753265688,
124898.65019535,
125044.282021477,
126707.370972363,
127030.474768342,
126297.00080703,
128146.620383849,
128304.368873542,
129229.956590595,
130422.749089927,
130918.355536468,
131985.732889157,
131960.391628442,
133345.975740541,
133345.975740541,
134119.382399836,
135125.277767835,
135564.164670025,
136445.33174038,
137251.041424307,
136959.931965446,
137968.367944508,
138803.076570572,
139843.128023315,
141529.216617892,
143435.473636519,
144067.737204308,
143788.245794132,
144333.490822183,
143063.356102948,
144839.916859035,
143246.677773585,
142705.92156499,
144668.841516116,
144379.503833084,
144534.567420201,
143652.906558938,
143574.184766143,
144860.753035833,
145909.400027059,
147628.358668778,
147730.074607901,
149680.850243098,
149980.211943584,
149990.860538632,
149420.895268585,
149719.737059123,
151276.822324538,
151428.099146862,
152351.810551658,
153433.508406575,
154586.254355233,
155281.583327323,
155272.421713907,
155398.813465182,
155934.473175196,
156473.850517909,
158255.305306056,
159374.012059264,
159654.350946477,
160276.364297764,
160200.713853816,
160016.803434311,
161074.194471405,
161513.604873923,
162562.958764789,
163395.118550706,
164277.45219088
];

// SR25 Secure (0-19) Index

var cashPrices = [
100000,
99940,
100319.772,
100712.423587608,
100903.777192424,
100918.509143895,
101126.401272731,
101328.654075276,
101514.592155505,
101778.530095109,
102171.496999806,
102590.400137505,
102949.466537987,
103162.160135854,
103496.096048214,
103734.137069125,
104024.592652918,
104368.081857858,
104691.622911617,
105010.618286629,
105285.011032212,
105623.502342681,
105993.18460088,
106413.553571007,
106743.435587077,
107117.037611632,
107405.825145033,
107737.172115605,
108178.894521279,
108579.156431008,
109013.473056732,
109446.256544767,
109873.096945292,
110147.779687655,
110455.532584103,
110748.23974545,
111030.204763842,
111407.374369425,
111697.033542786,
112061.94775137,
112484.757480236,
112862.143841582,
113297.904578954,
113649.128083149,
113993.257642985,
114317.112487949,
114676.411172498,
115080.53084547,
115506.328809598,
115910.600960432,
116232.716520501,
116633.254461631,
116957.728175543,
117261.818268799,
117536.679970821,
117881.062443136,
118146.294833633,
118237.031188065,
118554.852327899,
118783.663192892,
119089.887476603,
119399.521184042,
119593.784205008,
119868.012752191,
120130.643568131,
120370.904855267,
120613.69297036,
120875.424684106,
121141.350618411,
121414.039798653,
121733.844379482,
122017.971172264,
122172.201887826,
122431.695644636,
122703.12671388,
122975.159545804,
123296.124712219,
123548.881767879,
123792.643711607,
123954.069319007,
124160.328890354,
124223.774818417,
124467.129193286,
124546.290287453,
124616.036210014,
124891.936114183,
125019.200997083,
125157.222194984,
125319.926583838,
125474.947333022,
125725.897227688,
125980.869347265,
126245.303192025,
126525.567765112,
126816.576570971,
127043.451426457,
127199.58782826,
127326.787416088,
127385.103084725,
127597.836206876,
127814.752528428,
128032.037607726,
128236.888867899,
128451.813893641,
128670.181977261,
128790.359927227,
128991.272888714,
129197.658925336,
129332.928874231,
129645.138564533,
129862.294171629,
130007.869803395,
130171.939735087,
130243.92481776,
130348.119957615,
130553.418246548,
130719.090534303,
130934.384876413,
131160.508559094,
131383.481423645
];

// Dates

var dates = [“Sep 2008″,”Oct 2008″,”Nov 2008″,”Dec 2008″,”Jan 2009″,”Feb 2009″,”Mar 2009″,”Apr 2009″,”May 2009″,”Jun 2009″,”Jul 2009″,”Aug 2009″,”Sep 2009″,”Oct 2009″,”Nov 2009″,”Dec 2009″,”Jan 2010″,”Feb 2010″,”Mar 2010″,”Apr 2010″,”May 2010″,”Jun 2010″,”Jul 2010″,”Aug 2010″,”Sep 2010″,”Oct 2010″,”Nov 2010″,”Dec 2010″,”Jan 2011″,”Feb 2011″,”Mar 2011″,”Apr 2011″,”May 2011″,”Jun 2011″,”Jul 2011″,”Aug 2011″,”Sep 2011″,”Oct 2011″,”Nov 2011″,”Dec 2011″,”Jan 2012″,”Feb 2012″,”Mar 2012″,”Apr 2012″,”May 2012″,”Jun 2012″,”Jul 2012″,”Aug 2012″,”Sep 2012″,”Oct 2012″,”Nov 2012″,”Dec 2012″,”Jan 2013″,”Feb 2013″,”Mar 2013″,”Apr 2013″,”May 2013″,”Jun 2013″,”Jul 2013″,”Aug 2013″,”Sep 2013″,”Oct 2013″,”Nov 2013″,”Dec 2013″,”Jan 2014″,”Feb 2014″,”Mar 2014″,”Apr 2014″,”May 2014″,”Jun 2014″,”Jul 2014″,”Aug 2014″,”Sep 2014″,”Oct 2014″,”Nov 2014″,”Dec 2014″,”Jan 2015″,”Feb 2015″,”Mar 2015″,”Apr 2015″,”May 2015″,”Jun 2015″,”Jul 2015″,”Aug 2015″,”Sep 2015″,”Oct 2015″,”Nov 2015″,”Dec 2015″,”Jan 2016″,”Feb 2016″,”Mar 2016″,”Apr 2016″,”May 2016″,”Jun 2016″,”Jul 2016″,”Aug 2016″,”Sep 2016″,”Oct 2016″,”Nov 2016″,”Dec 2016″,”Jan 2017″,”Feb 2017″,”Mar 2017″,”Apr 2017″,”May 2017″,”Jun 2017″,”Jul 2017″,”Aug 2017″,”Sep 2017″,”Oct 2017″,”Nov 2017″,”Dec 2017″,”Jan 2018″,”Feb 2018″,”Mar 2018″,”Apr 2018″,”May 2018″,”Jun 2018″,”Jul 2018″,”Aug 2018”];

// All prices

var allPrices = balancedPrices.concat(growthPrices, australianPrices, internationalPrices, cashPrices);

// FUNCTIONS

var balancedPoints = calcpoints(balancedPrices, chartHeight, chartWidth);
createchart(balancedPoints, balancedPrices);
createaxes(balancedPrices);

function removeChart(){
var lines = document.getElementsByClassName(“line”);
while(lines.length > 0){
lines[0].parentNode.removeChild(lines[0]);
};
var labels = document.getElementsByClassName(“price-label”);
while(labels.length > 0){
labels[0].parentNode.removeChild(labels[0]);
};
var polyline = document.getElementById(“polyline-id”);
polyline.setAttribute(“points”, “”);
var polylineFill = document.getElementById(“polyline-fill”);
polylineFill.setAttribute(“points”, “”);
};

function report(portfolio){
if(portfolio == “balanced”){
removeChart();
createaxes(balancedPrices);
var balancedPoints = calcpoints(balancedPrices, chartHeight, chartWidth);
createchart(balancedPoints, balancedPrices);
} else if(portfolio == “growth”){
removeChart();
createaxes(growthPrices);
var growthPoints = calcpoints(growthPrices, chartHeight, chartWidth);
createchart(growthPoints, growthPrices);
} else if(portfolio == “australian”){
removeChart();
createaxes(australianPrices);
var australianPoints = calcpoints(australianPrices, chartHeight, chartWidth);
createchart(australianPoints, australianPrices);
} else if(portfolio == “international”){
removeChart();
createaxes(internationalPrices);
var internationalPoints = calcpoints(internationalPrices, chartHeight, chartWidth);
createchart(internationalPoints, internationalPrices);
} else if(portfolio == “cash”){
removeChart();
createaxes(cashPrices);
var cashPoints = calcpoints(cashPrices, chartHeight, chartWidth);
createchart(cashPoints, cashPrices);
};
};

function numberWithCommas(num){
var parts = num.toString().split(“.”);
parts[0] = parts[0].replace(/B(?=(d{3})+(?!d))/g, “,”);
return parts.join(“.”);
};

function dataconvert(prices, dates){
var data = [];
for(var i = 0; i < prices.length; i++){
var datum = {
price: prices[i],
date: dates[i]
};
data.push(datum);
};
return data;
};

function calcdollar(data, startAmt){
var oneData = [];
for(var i = 0; i < data.length; i++){
oneData.push(data[i] + 1);
};
var dollarAmts = [];
var start = startAmt;
var accum = start;
for(var i = 0; i < oneData.length; i++){
accum = oneData[i] * accum;
dollarAmts.push(accum);
};
return dollarAmts;
};

function calcpoints(prices, chartHeight, chartWidth){
var points = [];
var xPoint = 0;
var step = chartWidth / prices.length;
var max = Math.max.apply(null, allPrices);
var min = Math.min.apply(null, allPrices);
var range = max – min;
var firstInterval = range / numAxes;
var interval = 20000;

var minAxis = 60000 // startAmt – (interval * Math.ceil((startAmt – min) / interval));
var maxAxis = 220000 // minAxis + (numAxes * interval);
var axisRange = maxAxis – minAxis;

for(var i = 0; i < prices.length; i++){
if(prices[i] === maxAxis){
var yPoint = 0;
} else if(prices[i] === minAxis){
var yPoint = chartHeight;
} else {
var yPoint = ((maxAxis – prices[i]) / axisRange) * chartHeight;
}
var xandy = {
x: xPoint,
y: yPoint
};
points.push(xandy);
var xPoint = xPoint + step;
};
return points;
};

function createaxes(prices){
var max = Math.max.apply(null, allPrices);
var min = Math.min.apply(null, allPrices);
var range = max – min;
var firstInterval = range / numAxes;
var interval = 20000;

var minAxis = 60000 // startAmt – (interval * Math.ceil((startAmt – min) / interval));
var maxAxis = 220000 // minAxis + (numAxes * interval);
var axisRange = maxAxis – minAxis;

var step = chartHeight / numAxes;
var accum = step;
var d = “”;

// DRAW AXES

for(var i = 1; i minAxis; i = i – interval){
accum = accum + step;
var div = document.createElement(“div”);
div.style.position = “absolute”;
div.className = “price-label”;
div.style.left = chartWidth + 5 + “px”;
div.style.top = accum – 12 + “px”;
var commaNum = numberWithCommas(priceLabel);
div.innerHTML = “$” + commaNum;
document.getElementById(“main-chart”).appendChild(div);
priceLabel = priceLabel – interval;
};
};

function createchart(points, prices){

// DRAW CHART LINE

var pairs = [];
for(var i = 0; i < points.length; i++){
var xPoint = points[i].x;
var yPoint = points[i].y;
pairs.push(xPoint);
pairs.push(yPoint);

var chart = document.getElementById(“chart”);
var point = chart.createSVGPoint();
point.x = xPoint;
point.y = yPoint;
var polyline = document.getElementById(“polyline-id”);
polyline.points.appendItem(point);
};

// DRAW CHART FILL

for(var i = 0; i < points.length; i++){
var xPoint = points[i].x;
var yPoint = points[i].y;
pairs.push(xPoint);
pairs.push(yPoint);

var chart = document.getElementById(“chart”);
var point = chart.createSVGPoint();
point.x = xPoint;
point.y = yPoint;
var polyline = document.getElementById(“polyline-fill”);
polyline.points.appendItem(point);
};

var num = points.length – 1;

var chart = document.getElementById(“chart”);
var point = chart.createSVGPoint();
point.x = points[num].x;
point.y = chartHeight;
var polyline = document.getElementById(“polyline-fill”);
polyline.points.appendItem(point);

var chart = document.getElementById(“chart”);
var point = chart.createSVGPoint();
point.x = 0;
point.y = chartHeight;
var polyline = document.getElementById(“polyline-fill”);
polyline.points.appendItem(point);

var chart = document.getElementById(“chart”);
var point = chart.createSVGPoint();
point.x = 0;
point.y = points[0].y;
var polyline = document.getElementById(“polyline-fill”);
polyline.points.appendItem(point);

var left = 0;
var step = chartWidth / points.length;

// CREATE INTERACTIVE ELEMENTS

for(var i = 0; i < points.length; i++){
var top = points[i].y;
var div = document.createElement(“div”);
div.id = left;
div.className = “line”;
div.style.position = “absolute”;
div.style.height = chartHeight + “px”;
div.style.width = step + “px”;
div.style.left = left – (step / 2) + “px”;
div.style.top = “0px”;
document.getElementById(“chart-container”).appendChild(div);

var div = document.createElement(“div”);
div.className = “cursor”;
div.style.height = chartHeight – points[i].y + “px”;
div.style.top = chartHeight – (chartHeight – points[i].y) + “px”;
div.style.left = “2px”;
div.style.position = “absolute”;
div.style.zIndex = “2”;
document.getElementById(left).appendChild(div);

var div = document.createElement(“div”);
div.className = “dot”;
div.style.position = “absolute”;
div.style.top = points[i].y – 7 + “px”;
div.style.left = 0 – (step / 2) + “px”;
div.style.zIndex = “3”;
document.getElementById(left).appendChild(div);

var div = document.createElement(“div”);
div.className = “label-chart”;
div.style.position = “absolute”;
div.style.top = chartHeight + “px”;
div.style.left = “-50px”;
div.style.zIndex = “3”;
var num = Math.round(prices[i]);
var commaNum = numberWithCommas(num);
div.innerHTML = dates[i] + “: $” + commaNum;
document.getElementById(left).appendChild(div);

var left = left + step;
};
};

Exchange Traded Funds (ETFs) have become a popular way for investors to gain exposure not only to passive indices but to a range of market factors.

Smart beta ETFs, which follow rule-based strategies to provide factor exposure, are increasingly recommended by financial advisers because they provide a relatively cheap and effective way of meeting specific investment objectives or creating greater diversification.

But while the smart beta concept might seem easily commoditised, there can be significant differences in investment outcomes even among those investment products that appear to offer something very similar.

For example, the below chart shows the performance of three well-known dividend-focused ETFs, each of which seeks to generate above market income. Over the past three years, these ETFs have exhibited markedly different performance despite sharing the same income objective.

Growth of $10,000 over three years


Source: Lonsec
IHD: iShares S&P/ASX Dividend Opportunities ETF
SYI: SPDR MSCI Australia Select High Dividend Yield Fund
ZYAU: ETFS S&P/ASX 300 High Yield Plus ETF

In order to understand these diverging results, investors need to get under the hood to see how individual ETFs determine their index construction rules. Differences in how fund managers determine things like the quality, liquidity, and weights of certain stocks can result in funds with very different allocations. The chart below shows the sector breakdown of each fund’s top 10 stock holdings, revealing very different compositions.

Top 10 holdings—sector breakdown


Source: Lonsec
IHD and ZYAU holdings as at 15 August 2018. SYI holding as at 31 July 2018

Both the ETFS and iShares products have similar exposure to Financials and Materials, but the ETFS fund has a greater allocation to defensive REITs and Utilities, while the iShares fund has diversified more across other sectors. Its top 10 holdings represent only 62% of its total portfolio value, compared to 75% for the ETFS fund. Meanwhile, the SPDR fund’s top 10 holdings are dominated by Financials, with smaller allocations across Consumer Staples and Materials, and no exposure to REITs or Utilities.

What this means is that financial advisers need to do more than simply ‘read the packet’ when selecting investment products. Financial advisers should have a thorough understanding of how individual smart beta products operate to ensure they deliver outcomes in line with their clients’ investment objectives.

Thank you for joining in the conversation

Thank you for attending this year’s Retirement Symposium and joining in the conversation. We hope you found the insights into why “Not All Income is Created Equal” and an improved understanding of the real-life income needs of retirees will be of benefit in your practice and when building retirement portfolios for your clients. If you want to take another look at what our speakers had to say, you can download the presentation slides here.

Not All Income is Created Equal

It is easy to become complacent when volatility is low and markets continue to rise. However, in an environment of heightened geopolitical uncertainty, a return of volatility is a real risk for retirement portfolios. A cohesive investment strategy, is important. Lonsec believes retirement portfolios should be designed to focus specifically on the retirees’ primary objectives and key risks, namely, Yield, Growth and Risk Control.

To keep the conversation going, we have shared some additional insights with you to draw out some of the themes covered by our speakers.

We hope you enjoyed this year’s Retirement Symposium and we look forward to seeing you at our next event soon.

Insights from our Partners

Alliance Bernstein: The Rise of Populism: Strategic Implications
Challenger: Corporate Bonds – More Risk for Less Return
Invesco: Invesco Senior Secured Loans Strategy
Investors Mutual: Equity Income Fund Factsheet
Lazard: The dangers of drawdown
Pendal: Income & Fixed Interest 
Robeco: Guide to factor investing in equity markets

You can also access the latest retirement insights from our partners here.

Best regards,

Veronica Klaus
Head of Investment Consulting
Lonsec Research

lonsecresearch.com.au
lonsecretire.com.au


Following an extensive market search, Lonsec is pleased to announce the appointment of Libby Newman to the role of Executive Director of Lonsec Research.

Ms Newman has more than 25 years of experience in investment management and funds research, including most recently as Lonsec’s Head of Manager Research in Melbourne. Since joining Lonsec in 2007, Ms Newman has held several senior research roles covering fixed income and multi-asset funds, and has been a key member of Lonsec’s Investment Committee and Manager Selection Committee, which manage Lonsec’s model portfolios.

Prior to joining Lonsec, Ms Newman spent 10 years as part of the fixed income team managing Suncorp’s insurance mandates, and has experience in operations, investment performance systems and risk management at Suncorp, Abbey National, DST International, and boutique credit arbitrage manager Artesian.

As Executive Director, Libby will lead Lonsec Research’s investment analyst and data analytics teams, supported by the diverse knowledge and experience of Lonsec’s leadership team.

“We are very excited to announce Libby as our new Executive Director of Lonsec Research,” said Lonsec CEO Charlie Haynes. “Libby has developed an intimate understanding of the research needs of financial advisers and is widely respected throughout the industry for her sheer depth of investment product knowledge.”

Ms Newman will step into the new role at a time of growth for the Lonsec Group, which includes superannuation research house SuperRatings. Lonsec’s iRate platform remains number one among financial advisers and dealer groups, while Lonsec’s investment consulting team continues to expand, with a focus on providing bespoke investment solutions.

“The quality of our investment research forms the basis of everything we do at Lonsec,” said Ms Newman. “We are continually evolving our tools to meet the new challenges and opportunities within the financial services industry, and I am excited to be playing a part in that.”

Release ends

IMPORTANT NOTICE: This document is published by Lonsec Research Pty Ltd ABN 11 151 658 561, AFSL 421 445 (Lonsec).

Please read the following before making any investment decision about any financial product mentioned in this document.

Warnings: Lonsec reserves the right to withdraw this document at any time and assumes no obligation to update this document after the date of publication. Past performance is not a reliable indicator of future performance. Any express or implied recommendation, rating, or advice presented in this document is a “class service” (as defined in the Financial Advisers Act 2008 (NZ)) or limited to “general advice” (as defined in the Corporations Act (C’th)) and based solely on consideration of data or the investment merits of the financial product(s) alone, without taking into account the investment objectives, financial situation and particular needs (“financial circumstances”) of any particular person.

Warnings and Disclosure in relation to particular products: If our general advice relates to the acquisition or possible acquisition or disposal or possible disposal of particular classes of assets or financial product(s), before making any decision the reader should obtain and consider more information, including the Investment Statement or Product Disclosure Statement and, where relevant, refer to Lonsec’s full research report for each financial product, including the disclosure notice. The reader must also consider whether it is personally appropriate in light of his or her financial circumstances or should seek further advice on its appropriateness. It is not a “personalised service” (as defined in the Financial Advisers Act 2008 (NZ)) and does not constitute a recommendation to purchase, hold, redeem or sell any financial product(s), and the reader should seek independent financial advice before investing in any financial product. Lonsec may receive a fee from Fund Manager or Product Issuer (s) for reviewing and rating individual financial product(s), using comprehensive and objective criteria. Lonsec may also receive fees from the Fund Manager or Financial Product Issuer (s) for subscribing to investment research content and services provided by Lonsec.

Disclaimer: This document is for the exclusive use of the person to whom it is provided by Lonsec and must not be used or relied upon by any other person. No representation, warranty or undertaking is given or made in relation to the accuracy or completeness of the information presented in this document, which is drawn from public information not verified by Lonsec. Conclusions, ratings and advice are reasonably held at the time of completion but subject to change without notice. Lonsec assumes no obligation to update this document following publication. Except for any liability which cannot be excluded, Lonsec, its directors, officers, employees and agents disclaim all liability for any error, inaccuracy, misstatement or omission, or any loss suffered through relying on the information.

Copyright © 2018 Lonsec Research Pty Ltd, ABN 11 151 658 561 AFSL 421 445. All rights reserved. Read our Privacy Policy here.

Volatility has died down since the dramatic spike witnessed in February 2018, but a return to near-historic lows should raise eyebrows among investors. The S&P/ASX 200 VIX Index, a measure of implied volatility in the Australian share market, closed last week at 9.79 points, falling back below double-digits and a far cry from February’s high of 22.16.

S&P/ASX 200 VIX Index


Source: Lonsec, Bloomberg

While fundamentals still provide some support for a low volatility environment, with interest rates at ultra-low levels and earnings growth generally living up to expectations, investors should be prepared for more heightened volatility in the second half of 2018.

As the chart below shows, over the past 10 years the August and September period has seen the biggest average moves in the volatility index, and this is true of both the Australian and US markets.

Average daily change in volatility index, 2008-2018


Source: Lonsec, Bloomberg

While volatility is not always a bad thing, shares are particularly vulnerable when a low-volatility environment comes to a grinding halt.

With the US Fed due to hike rates again in September, and the UK grasping for a Brexit deal ahead of the October European Summit, there are reasons to be nervous. And the fears are not only confined to developed economies: Turkey’s currency has plunged to record lows and is having knock-on effects in other emerging markets.

On the trade front, while the US-China tariff war is yet to hit developed markets hard, the negative impact is starting to creep into measures of manufacturing activity and export volumes in the US and Asia.

In other words, this is no time to be ignoring history.

Release ends

In the wake of Facebook’s plummeting share price, there has been much talk of the so-called FAANG shares and their earnings performance. But investors should not be misled by the market’s bucket mentality, which has a tendency to group together certain stocks, often for superficial reasons.

The recent round of earnings announcements shows that the five FAANG shares—Facebook, Apple, Amazon, Netflix and Google (which trades as Alphabet)—are hitting or exceeding their earnings per share (EPS) estimates, but have experienced wildly divergent share price reactions.

FAANG earnings per share (EPS) and share price reactions

 
Source: Lonsec, Bloomberg, company reports

While the FAANG shares have largely risen together in recent months, Facebook’s violent decoupling from the FAANG growth trajectory shows it is a mistake to think of these shares as behaving as a group. While Facebook met the market’s EPS target, it undershot the consensus revenue estimate and suffered the consequences.

In contrast, Amazon reported strong EPS growth and slightly down-beat revenue versus consensus, leading to only a moderate fall in price. Netflix reported lower than expected revenue and subscriber growth and saw a small bump in its price.

While the FAANG shares may have much in common—they are all technology-related shares—they are fundamentally different businesses. What they have most in common is that they are, with the exception of Netflix, among the highest value shares in the index. When they move in the same direction they can move the market with them, but when they diverge it can leave investors wondering how meaningful the FAANG label is.

FAANG market cap (US $trillion)

FAANG market cap (US $trillion)
Source: Lonsec, Bloomberg

Release ends

Investors sticking to the traditionally high quality, conservative part of global bond markets may be surprised to learn that they are more exposed to riskier credit now than prior to the GFC.

Unlike high quality AAA-rated bonds, a BBB bond is only one or two downgrades away from ‘high-yield’ or ‘junk’ status. When the economy turns sour, these companies can quickly find themselves relegated.

At the start of 2000, the BBB-rated market was worth around US$400 billion, or one third of the total investment grade market. By the end of June 2018, this had grown to $2.3 trillion, compared to a total market value of $5 trillion (see chart below).

The value of the US BBB-rated corporate bond market is growing

Chart - US corporate bond market value vs US BBB-rated Corporate Bond market value

Source: Lonsec, Bloomberg

Bloomberg Barclays US Corporate Bond Index

Globally, companies are increasingly prepared to push their debt ratios higher to fund expansion, and they have found an audience of investors keen to squeeze extra yield from their portfolios. This demand is reflected in US spreads on BBB bonds, which have moved lower and converged with AAA spreads over the past two years (see chart below).

AAA and BBB spreads have converged

Graph - Spread of AAA-rated bonds vs Spread of BBB-rated bonds

Source: Lonsec, FRED

ICE BofAML US Corporate Option-Adjusted Spread

Firms have also sought to lock in access to cheap finance for as long as they can, meaning investors are not only exposed to lower quality credit, but may also be exposed to bonds that are more sensitive to moves in both underlying yields and a widening in credit spreads. In contrast to the global landscape, Australia’s investment grade bond market is dominated by financials, meaning exposure to BBB bonds is comparatively lower.

Investment managers at the conservative end of the risk spectrum, such as pension funds and insurers, rely on the investment grade market for stable and predictable returns. But the ‘risking-in’ trend means that even the safest parts of an investor’s portfolio might not be as safe as they think, and could be exposed to ‘glittering junk’ – companies that appear to offer safe yields but are at risk of being crushed by debt when their equity value falls.

Release ends

Important information: Any express or implied rating or advice is limited to general advice, it doesn’t consider any personal needs, goals or objectives.  Before making any decision about financial products, consider whether it is personally appropriate for you in light of your personal circumstances. Obtain and consider the Product Disclosure Statement for each financial product and seek professional personal advice before making any decisions regarding a financial product.