November was the strongest month for superannuation in 2020 and the 8th consecutive month of positive returns for members.

As COVID-19 restrictions ease nation-wide and investors look forward to the approval and distribution of a vaccine, share markets globally have pushed to record highs, delivering windfall gains for super members.

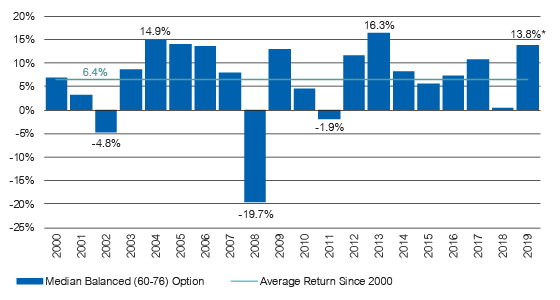
According to estimates from leading superannuation research house SuperRatings, the median balanced option returned 4.9% in November as members enjoyed an early Christmas gift that has put them back into the black over the course of a volatile and uncertain year.

Since the start of 2020 the median balanced option has delivered 2.3% and is on track to finish the year in positive territory. Super has bounced back strongly in the second half of the year, returning 7.5% from the start of July to the end of November, reversing the large falls back in February and March.

According to SuperRatings data, the median growth option returned an estimated 6.2% in November and 2.4% over the calendar year, while the median capital stable option returned an estimated 2.0% in November and 1.7% over the calendar year.

“We’ve had a watershed month for super and hopefully this strong performance can continue through to the new year,” said SuperRatings Executive Director Kirby Rappell.

“Given the world is battling a pandemic that has resulted in large sections of the economy being placed in lockdown, the results are remarkable. This is the year super proved its worth once again and reminded us why it is so critical to our economic success.”

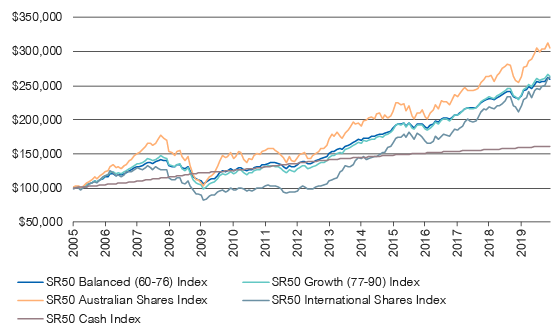
Accumulation returns to end of November 2020

CYTD 1 yr 3 yrs (p.a.) 5 yrs (p.a.) 7 yrs (p.a.) 10 yrs (p.a)
SR50 Growth (77-90) Index 2.4% 2.4% 6.6% 7.9% 8.0% 8.4%
SR50 Balanced (60-76) Index 2.3% 2.2% 5.8% 7.1% 7.3% 7.9%
SR50 Capital Stable (20-40) Index 1.7% 1.5% 3.8% 4.3% 4.6% 5.1%

Source: SuperRatings estimates

Pension returns had a similarly strong month. The median balanced pension option rose an estimated 5.4% in November and 2.6% over the calendar year. The median pension growth option rose an estimated 6.8% in November and 2.6% over the calendar year, and the median capital stable pension option returned an estimated 2.3% in November and 2.0% over the calendar year.

Pension returns to end of November 2020

CYTD 1 yr 3 yrs (p.a.) 5 yrs (p.a.) 7 yrs (p.a.) 10 yrs (p.a)
SRP50 Growth (77-90) Index 2.6% 2.6% 7.3% 8.7% 8.9% 9.3%
SRP50 Balanced (60-76) Index 2.6% 2.4% 6.6% 7.8% 7.9% 8.5%
SRP50 Capital Stable (20-40) Index 2.0% 1.7% 4.4% 5.0% 5.2% 5.9%

Source: SuperRatings estimates  

The global recovery is underway and is looking sufficiently V-shaped, but recent economic news has been mixed. Infection rates have risen in the US and Europe, causing a loss of momentum, but news of successful vaccine trials have boosted confidence.

The UK has begun rolling out the Pfizer-BioNTech vaccine, while Australia and the US are preparing to do the same once the vaccine is approved. Meanwhile, China has ramped up its trade conflict with Australia, putting tariffs of up to 200% on Australian wine and suspending the importation of Australian beef, barley and timber.

“Australia’s success in containing the coronavirus has put us in an enviable position, but there are still significant risks at play. The pandemic is not yet defeated and there are geopolitical issues weighing on the outlook. Members should be optimistic but prepare themselves for potential surprises as we head into 2021.”

Release ends


Warnings: Past performance is not a reliable indicator of future performance. Any express or implied rating or advice presented in this document is limited to “General Advice” (as defined in the Corporations Act 2001(Cth)) and based solely on consideration of the merits of the superannuation or pension financial product(s) alone, without taking into account the objectives, financial situation or particular needs (‘financial circumstances’) of any particular person. Before making an investment decision based on the rating(s) or advice, the reader must consider whether it is personally appropriate in light of his or her financial circumstances, or should seek independent financial advice on its appropriateness. If SuperRatings advice relates to the acquisition or possible acquisition of particular financial product(s), the reader should obtain and consider the Product Disclosure Statement for each superannuation or pension financial product before making any decision about whether to acquire a financial product. SuperRatings research process relies upon the participation of the superannuation fund or product issuer(s). Should the superannuation fund or product issuer(s) no longer be an active participant in SuperRatings research process, SuperRatings reserves the right to withdraw the rating and document at any time and discontinue future coverage of the superannuation and pension financial product(s).

Copyright © 2020 SuperRatings Pty Ltd (ABN 95 100 192 283 AFSL No. 311880 (SuperRatings)). This media release is subject to the copyright of SuperRatings. Except for the temporary copy held in a computer’s cache and a single permanent copy for your personal reference or other than as permitted under the Copyright Act 1968 (Cth.), no part of this media release may, in any form or by any means (electronic, mechanical, micro-copying, photocopying, recording or otherwise), be reproduced, stored or transmitted without the prior written permission of SuperRatings. This media release may also contain third party supplied material that is subject to copyright. Any such material is the intellectual property of that third party or its content providers. The same restrictions applying above to SuperRatings copyrighted material, applies to such third party content.

SuperRatings and Lonsec have announced the winners of this year’s Fund of the Year Awards, which was held virtually for the first time in the event’s 18-year history.

The Fund of the Year Award went to QSuper, which also took home the Pension of the Year Award and the Smooth Ride Award. UniSuper claimed the MySuper of the Year Award, and Sunsuper clinched the MyChoice Super of the Year Award.

The winners were announced at a virtual awards event on 29 October, broadcast live from the Museum of Contemporary Art, Sydney.

“It’s important to recognise the significant work that all funds have done to support their members through a very challenging year,” said SuperRatings Executive Director Kirby Rappell.
“In a highly competitive field, we decided that QSuper was the fund that performed most strongly across the key criteria of investment performance, fees, member services, financial advice and insurance, and fund governance.”

“Congratulations to the team at QSuper on a fantastic effort. It was a strong field this year and we note the high calibre of all award winners, with the quality of their offerings shining through the pandemic.”

“A lot has changed in super, and there are even more changes to come. We should always be focused on improvement, but we shouldn’t lose sight of the incredible outcomes being produced by a large number of funds, both for their members and the retirement system as a whole. Despite the uncertainty, there is every reason to be positive about super.”


Congratulations to all of the finalists for this year’s SuperRatings and Lonsec Fund of the Year Awards Dinner. A full list of the awards is available below.

SuperRatings Fund of the Year Award

Winner

QSuper


SuperRatings MySuper of the Year Award

Awarded to the fund that has provided the Best Value for Money Default Offering.

Winner
UniSuper

Finalists
AustralianSuper
BUSSQ
CareSuper
Cbus
Equip
HESTA
QSuper
Sunsuper
TelstraSuper
UniSuper

SuperRatings MyChoice Super of the Year Award

Awarded to the fund with the Best Value for Money Offering for Engaged Members.

Winner
Sunsuper

Finalists
AustralianSuper
Aware Super
Hostplus
Mercer Super Trust
NGS Super
QSuper
Statewide Super
Sunsuper
Tasplan
UniSuper

SuperRatings Pension of the Year Award

Awarded to the fund with the Best Value for Money Pension Offering.

Winner
QSuper

Finalists
AustralianSuper
Aware Super
BUSSQ
Cbus
HESTA
Hostplus
QSuper
Sunsuper
TelstraSuper
UniSuper

SuperRatings Career Fund of the Year Award

Awarded to the fund with the offering that is best tailored to its industry sector.

Winner
Cbus

Finalists
BUSSQ
Cbus
HESTA
Mercy Super
TelstraSuper
Hostplus

SuperRatings Momentum Award

Awarded to the fund that has demonstrated significant progress in executing key projects that will enhance its strategic positioning in coming years.

Winner
Aware Super

Finalists
Aware Super
Cbus
Equip
HESTA
Mercer Super Trust
Sunsuper

SuperRatings Net Benefit Award

Awarded to the fund with the best Net Benefit outcomes delivered to members over the short and long term.

Winner
AustralianSuper & HESTA

Finalists
AustralianSuper
Cbus
HESTA
Hostplus
QSuper
UniSuper

SuperRatings Smooth Ride Award

Awarded to the fund that has best weathered the ups and downs of the market, while also delivering strong outcomes.

Winner
QSuper

Finalists
AustralianSuper
Aware Super
BUSSQ
CareSuper
Cbus
QSuper

Infinity Award

Awarded to the fund most committed to addressing its environmental and ethical responsibilities.

Winner
Local Government Super

Finalists
Australian Ethical Super
CareSuper
Christian Super
Future Super
HESTA
Local Government Super

Lonsec Investment Option Award

Seeks to recognise and highlight the work of asset managers and key players incorporating ESG.

Winner
CareSuper – Sustainable Balanced

Finalists
CareSuper – Sustainable Balanced
Cbus – Growth (Cbus MySuper)
Suncorp Multi-Manager Growth
Sunsuper for Life – Balanced


Release ends

A lack of clarity around environmental, social and governance (ESG) approaches to investing is creating confusion and making it harder for end investors to choose an investment product that fits their objectives and values.

Leading investment research house Lonsec said that investors relying on pure ESG product scores or labels risk being misled about the true sustainability of the product’s underlying investments.

According to Lonsec analysis, funds that score well on a pure ESG basis do not necessarily score well based on sustainability measures that consider the specific industries and activities the fund is exposed to.

“The traditional ESG approach tends to be more about process and less about outcomes,” said Tony Adams, Lonsec’s Head of Sustainable Investment Research.

“ESG fund managers tend to look at sustainability factors in terms of the risks they pose to a company’s business model. Academic research supports the assertion that companies that follow strong ESG standards are more likely to outperform those that don’t.”

Adams said that while ESG analysis is an important element of a fund manager’s investment approach, it can create confusion for investors looking for investment products that explicitly align with their values.

“In some cases, you can end up with a portfolio that looks very similar to the broader market when it comes to exposure to things like fossil fuels, gambling, tobacco, or deforestation. For many investors, ESG integration might sound good, but in practice it will often fail to meet their expectations.”

Lonsec analysis highlights gap between ESG and sustainability

Data from Lonsec show that 19% of Australian equity managers rated by Lonsec score highly for ESG awareness but score poorly for sustainability. Likewise, 18% of managers fare relatively poorly in ESG awareness, but end up performing well in terms of the sustainability of the fund’s underlying investments.

Relationship between Lonsec’s ESG and Sustainability Scores

Source: Lonsec

Lonsec’s analysis covers 159 Australian equity funds, which are scored separately based on their ESG integration and the underlying ‘goodness’ of their portfolio.

Lonsec’s ESG score is based on the policy and reporting framework of each manager, and how deeply integrated its ESG process is with their investment decision making.

In contrast, Lonsec’s Sustainability Score looks through to the fund’s underlying investments and assesses how well they align with the United Nation’s Sustainable Development Goals (SDGs), as well as how much exposure the fund has—directly and indirectly—to ten controversial industries.

“Most investors, if you asked them, would assume there was a strong correlation between ESG and sustainability,” said Adams.

“That there is such a significant discrepancy demonstrates that we need better communication and better tools to help investors make informed decisions about where they put their money.”

ESG funds must ensure they meet investors’ expectations

If ESG funds wish to be viewed as sustainable, they need to be transparent about the composition of their portfolio and the size of their exposure to unsustainable industries.

“Whether it’s a company or a managed fund, what the investor really wants to know is: what industries and activities am I ultimately investing in and supporting?” said Adams.

“While investors care about a manager’s investment process they are often more concerned about the impact their investment has on society, the planet, and future generations.”

Lonsec’s Sustainability Score helps funds become more transparent by giving financial advisers and end-investors the information they need to build a genuine values-based portfolio.

For fund managers who agree to have their fund scored, Lonsec provides a Sustainability Report detailing the relative success of the fund in supporting the SDGs and minimising exposure to controversial industries. Lonsec’s sustainability research assesses the exposures of individual companies across the entire supply chain, allowing individual investors to make their own decisions about how and where to invest.

Finally, Lonsec’s Sustainability Score reflects the net impact of these measures, which is peer ranked and results in a score between 1 and 5 bees.

“We chose bees to represent our Sustainability Score because bees are a symbolic reminder of the importance of biodiversity in maintaining the health of the planet,” said Adams.

“When advisers and investors see 5 bees next to a fund’s name, we want them to associate that fund with the most sustainable investment outcomes in the market.”

Sustainability issues not always black and white

Sustainable investing is about balance. Avoiding every company with a positive carbon footprint is not necessarily good for our portfolios or humanity. The purpose of Lonsec’s sustainability research is to create transparency so investors can make informed decisions.

“We can all identify contentious activities, but whether or not to exclude them completely from our portfolio is a different matter,” said Adams.

“For example, a company like Woolworths is primarily involved in food production and distribution, but it also sells alcohol and tobacco products. Investors will have different views, but we can make sure they know which businesses are exposed to which industries, and how big their exposure is.”

Lonsec’s Sustainability Score exposes the truth about a fund manager’s holdings, helping investors build better portfolios without an ESG black box. As advisers and investors become more educated on the differences between sustainable investing methodologies, fund managers will need to take the lead on transparency and an honest conversation or be left behind.

Release ends

In a financial year that saw a bull market turn into a sharp selloff followed by a recovery, super funds were rocked by a level of volatility not seen since the financial crisis a decade ago.

As funds finalise their reporting for June 2020, the fallout from the Covid-19 crisis is clear, but far from the sea of red that members and commentators may have expected back in March. For members invested in any of the top 15 performing balanced options, the past year has netted a slim but positive return compared to the estimated median return of -1.2%.

According to data from leading research house SuperRatings, Suncorp was the top returning fund over the 12 months to the end of June, with the Suncorp Multi-Manager Growth Fund returning 3.8%. This was followed by BUSSQ and Australian Ethical Super, whose balanced options returned 2.5% and 2.4% respectively.

Top 10 SR50 Balanced Index options over 12 months

* Interim return
Source: SuperRatings. Returns to end June 2020.

While it is important to acknowledge those funds that have outperformed during the Covid-19 pandemic to date, members should bear in mind that long-term performance is what really counts.

Over 10 years, the top performers are AustralianSuper, whose balanced option has returned 8.8% p.a., followed closely by UniSuper and Hostplus. Performance for the median balanced option continues to hold strong, returning an estimated 7.6% over the decade to 30 June 2020.

Top 10 SR50 Balanced Index options over 10 years

Source: SuperRatings. Returns to end June 2020.

“Importantly, over the long term, returns remain very healthy,” said SuperRatings Executive Director Kirby Rappell. “Super is a long-term game, so members should avoid chasing short-term results and ensure they are invested in a quality fund with the right investment strategy that is well positioned to deliver for their needs over the course of their working life.”

Interestingly, only half of the top performing funds over 12 months were among the top performing funds over 10 years, highlighting the difficulty for investment strategies to perform well in differing market conditions over a longer term.

“It was pleasing to see 15 out of the 50 options in the SR50 Balanced Index generate a positive return in the 2019-20 financial year, which speaks to the quality of funds available to members,” said Mr Rappell.

“Managing risks while delivering a positive return in this environment has been a real challenge, and this is likely to continue through the rest of 2020.”

According to SuperRatings, given the success of super over the past 10 years in accumulating wealth, members will feel the bumps more when markets go down.

“Prior to Covid-19, we saw the industry average account balance rise over $100,000, compared to around $30,000 during the GFC,” said Mr Rappell.

“This means that, on an absolute basis, members will see their balance move around a lot more than they have previously. Funds have done an excellent job of both managing risk and educating their members on these issues, but more can be done in this space.”

QSuper delivered the best return to risk ratio of its peers over the 7 years to 30 June 2020. While CareSuper, Cbus, MTAA, VicSuper and AustralianSuper delivered a higher return over this period, they did so at a slightly higher level of risk.

Top 10 SR50 Balanced Index options over 7 years ranked by risk and return

OptionRankingReturn % p.a.
QSuper – Balanced18.0%
BUSSQ Premium Choice – Balanced Growth27.9%
CareSuper – Balanced38.1%
Cbus – Growth (Cbus MySuper)48.5%
MTAA Super – My AutoSuper58.0%
VicSuper FutureSaver – Growth (MySuper) Option68.2%
Catholic Super – Balanced (MySuper)77.8%
First State Super – Growth88.0%
AustralianSuper – Balanced98.8%
Media Super – Balanced107.7%

Source: SuperRatings. Returns to end June 2020. Risk and return ranking based on Sharpe ratio.


Release ends

We welcome media enquiries regarding our research or information held in our database. We are also able to provide commentary and customised tables or charts for your use.

For more information contact:

Kirby Rappell
Executive Director
Tel: 1300 826 395
Mob: +61 408 250 725
Kirby.Rappell@superratings.com.au

Lonsec has partnered with BT Financial Group to make its suite of Listed and Retirement Managed Portfolios available on the BT Panorama platform.

BT Panorama users now have access to all three of Lonsec’s Managed Portfolios, with the Multi-Asset Managed Portfolios already available on the platform.

“We’re very pleased to partner with BT to enable their users to leverage Lonsec’s investment knowledge and resources by utilising our full suite of Managed Portfolios,” said Lonsec CIO Lukasz de Pourbaix.

“This has been the most challenging market we’ve seen in a generation. For financial advisers and their clients, it really emphasises the need for professionally managed investment solutions that can manage risks and take advantage of opportunities as they arise.”

Lonsec’s full suite of Managed Portfolios are also available on the Netwealth, HUB24 and Macquarie platforms. Lonsec’s Listed Managed Portfolios are available on Praemium’s platform, along with Lonsec’s Core and Income Separately Managed Accounts (SMAs).

Lonsec’s portfolios harness the depth and breadth of Australia’s leading research house, incorporating dynamic asset allocation combined with an active approach to investment selection. They are also underpinned by Lonsec’s minimum quality criteria, which selects from a pool of funds rated ‘Recommended’ or higher by Lonsec’s investment research team.

Lonsec’s Listed Managed Portfolios provide investors with capital growth and income by investing in exchange-traded securities and individual stocks across a range of asset classes. Lonsec’s Retirement Managed Portfolios are objectives-based and focused on delivering an attractive and sustainable level of income.

Lonsec’s Multi-Asset portfolios are designed for investors seeking a diversified portfolio aimed at generating growth. They invest across a diversified range of Australian equities, global equities, property, infrastructure, fixed interest, and alternatives.

Release ends

Lonsec has partnered with AMP to make its Retirement Managed Portfolios available via MyNorth Managed Portfolio.

The portfolios harness the depth and breadth of Australia’s leading research provider, allowing users to build high-quality retirement solutions incorporating Lonsec’s best investment ideas. Underpinning the portfolios is Lonsec’s strict quality criteria, requiring funds to be rated ‘Recommended’ or higher by its investment research team.

“Our managed portfolios give financial advisers access to investment solutions supported by one of Australia’s largest investment research and consulting teams,” said Lonsec CEO Charlie Haynes.

“Being able to draw on our investment selection and portfolio construction expertise is a real plus, and we’re proud to be able to extend this access via the North platform users.”

Lonsec’s Retirement Managed Portfolios are objectives-based and focused on delivering an attractive and sustainable level of income while generating capital growth through a diversified portfolio of managed investments.

Lonsec offers three Retirement portfolios: Conservative, Balanced and Growth. Each are designed to achieve different risk and investment objectives over various timeframes. They are constructed using a range of funds that play a specific role, such as income generation, capital growth and risk control, and backed by Lonsec’s rigorous governance and review processes.

“Our Retirement Managed Portfolios have been constructed to manage the risks most relevant to investors in the retirement phase,” said Lonsec’s Chief Investment Officer Lukasz de Pourbaix.

“By diversifying across asset classes, managers and return sources, we aim to manage risks such as capital drawdown, which can materially impact the longevity of a retirement portfolio, particularly in the early stages of transitioning from superannuation to the pension phase of investing.”

“We’re very excited to be working with AMP to make these portfolios available to AMP’s North wrap users.”

Inclusion on North further expands the distribution of Lonsec’s Managed Account offering, following its existing availability on the BT, Macquarie, HUB24, Netwealth and Praemium platforms.

Lonsec’s retirement portfolios have been constructed to meet the income and capital objectives of investors in the retirement phase as well as to manage risks that are specifically relevant to retirees.

AMP’s North platform offers advisers flexible and efficient access to a range of investment products, which now include Lonsec’s retirement portfolios, giving advisers the tools they need to meet their clients’ goals.

The FASEA Code of Ethics Standard is now in force as of 1 January 2020, and the challenge for advisers is not just to pass the exam but also to make the necessary changes to their business practices.

According to leading research house Lonsec, the Code now requires advisers to demonstrate that they are acting in their client’s best interest while avoiding even a ‘perception’ of conflicted recommendations.

“For advisers the FASEA standards are no longer an intellectual exercise. Despite the practicality issues, they are now the yardstick against which they will be judged by regulators, clients and the community,” said Lonsec CEO Charlie Haynes.

“The reality is that the only way an adviser can comply with the standards effectively and efficiently is to access quality investment research and technology tools that enable them to provide detailed product comparisons across all asset classes, including superannuation funds and investment options.

“This goes to the heart of Standard 9 of the Code of Ethics, which requires advisers to make recommendations with competence.”

Lonsec also foreshadowed that conflicted remuneration, even if an adviser considers it to be minor, manageable, or largely irrelevant, could put licensees in breach of the standards.

Standard 3 of the FASEA Guidelines states that an adviser is in breach “if a disinterested person, in possession of all the facts, might reasonably conclude that the form of variable income could induce an adviser to act in a manner inconsistent with the best interests of the client.”

This means that all conflicts, even a preference to use an in-house practice or dealer group product, could be viewed as an inducement to act in a way that isn’t in the client’s best interest.

“Avoiding even perceived conflicts is now a requirement for advisers, so practices should strongly consider moving to a conflict-free environment to safeguard their position,” said Mr Haynes.

“Lonsec is now offering to solve this and help advisers moving forward by acquiring the investment management rights from existing portfolios and to manage the investment process on behalf of the adviser without ongoing conflict.”

Standard 6 also raises the bar for advisers, stating: “Where your clients indicate they only wish to invest in ethical or responsible investments, you will need to consider whether limiting your product recommendations in this manner is appropriate.”

According to Lonsec, meeting this standard means going beyond recommending branded ‘ethical’ products to understanding exactly what the product invests in and whether this indeed aligns with the client’s expectations.

“Advisers now have a legal responsibility to ensure their client’s preferences are taken into account,” said Mr Haynes. “For example, if the client doesn’t want fossil fuels in their portfolio, simply recommending an ESG product probably won’t be sufficient from now on. The adviser needs to have a complete understanding of the product’s underlying investments and its process.

“That’s why Lonsec is introducing a new sustainability rating and will provide data on how individual investment products stack up against the United Nation’s 17 Sustainable Development Goals. We want to give advisers all the tools and information they need to deliver advice that they can clearly demonstrate meets the FASEA standards and their best interest duty.”

Super members have every reason to be optimistic about 2020, but when it comes to a repeat of 2019’s double-digit returns, it would be wise to temper expectations.

According to estimates from leading research house SuperRatings, 2019 was the best year for superannuation funds since 2013, with the median balanced option returning 13.8%. Despite a selloff in Australian shares in December, funds entered the new year in a strong position as markets shrugged off a string of negative economic news and rising geopolitical tension.

However, funds are already battling the new normal of lower yields and returns, which will make a repeat of 2019’s results unlikely in 2020.

Looking back over 2019, the median balanced accumulation option returned 13.8% over the year to the end of December and has returned 7.7% p.a. over the past decade. December saw an estimated fall of 0.9%, ending an otherwise stellar year for Australian shares, on a sour note. Markets were driven predominately by the health care and materials sectors, while the financial services sector, despite delivering a positive result, remains largely beaten down, thanks mostly to the major banks.

The median growth option returned an estimated -1.1% in December and 16.0% over the year, while the capital stable option returned an estimated -1.0% and 7.0% respectively.

Estimated accumulation returns (% p.a. to end of December 2019)

  1 mth 1 yr 3 yrs 5 yrs 7 yrs 10 yrs
SR50 Growth (77-90) Index -1.1% 16.0% 9.0% 8.2% 10.0% 8.2%
SR50 Balanced (60-76) Index -0.9% 13.8% 8.1% 7.4% 8.8% 7.7%
SR50 Capital Stable (20-40) Index -1.0% 7.0% 4.7% 4.5% 5.2% 5.4%

Source: SuperRatings

Pensions performed similarly well in 2019, with the median balanced option returning an estimated 14.9% over 2019, compared to 18.2% for the growth option and 8.0% for the capital stable option.

Estimated pension returns (% p.a. to end of December 2019)

  1 mth 1 yr 3 yrs 5 yrs 7 yrs 10 yrs
SRP50 Growth (77-90) Index -1.2% 18.2% 9.9% 9.3% 11.1% 9.1%
SRP50 Balanced (60-76) Index -1.0% 14.9% 8.8% 8.0% 9.7% 8.5%
SRP50 Capital Stable (20-40) Index -1.0% 8.0% 5.4% 5.2% 5.8% 6.1%

Source: SuperRatings

“We’re anticipating a solid year for super in 2020, but the key challenge for funds will be the low return environment,” said SuperRatings Executive Director Kirby Rappell.

“Even with the possibility of a pickup in economic growth, yields are extremely low and it’s getting harder to find opportunities in the market. Company earnings growth is slowing, and Australian consumers are under pressure, so fundamentally it will be more challenging than 2019. That doesn’t mean it will be a bad year, but super members should not expect to bank another 13 per cent.”

Super’s long-term growth story still a winner

As the chart below shows, 2019’s double-digit return compares favourably to recent years and is significantly higher than the average return (6.4% over the past 20 years). Based on SuperRatings’ estimate of 13.8%, 2019 would represent the highest return since 2013 and the fourth-highest over the past two decades.

Median balanced option calendar year returns 2000-2019

* Estimate

Source: SuperRatings

Following the volatility of 2018, super funds saw steady growth over 2019 with only three down months during the year, with the largest fall in the median balanced option estimated to be -0.9% in December.

The main drivers of performance typically come from equities, of which Australian shares generally make up the greatest proportion. As the chart below shows, the Australian share market delivered a return of 18.4%, while international shares delivered 25.4% (unhedged) and 25.8% (40% hedged in Australian dollars). Meanwhile, listed property returned 14.2%, fixed interest – another major asset class for funds – returned 4.4%, and cash returned 1.5%. Another important asset class is Alternatives (including private equity), although market-based measures of performance are harder to determine as they are offered within diversified portfolios rather than standalone options.

Asset class returns in 2019

Returns based on the following indices: S&P/ASX 200 Index, MSCI World ex-Australia Index (USD), S&P/ASX 300 A-REIT Index (Industry), Vanguard Australian Fixed Interest Index ETF, Bloomberg AusBond Bank Bill Index (AUD). Hedging based on AUD/USD exchange rate of 0.7058.

Since the GFC, funds have ridden market turbulence through 2011, 2015 and 2018 to build significant wealth for members. Looking back over the past 15 years to 2005 (before the GFC hit), the median balanced option with a starting balance of $100,000 would have grown to an estimated $259,340 by the end of 2019 (a return of 159.3%). Similarly, the median growth fund would have risen to an estimated $264,208 (a return of 164.2%).

Growth in $100,000 invested over 15 years to 31 December 2019

Source: SuperRatings

Expect further fund consolidation in 2020

Over the course of 2019 there was a number of high-profile mergers, and 2020 is expected to see more funds come together to achieve greater scale. Mergers have typically been based on geographic proximity, similar industry sectors and strategic fits, with funds seeking merger partners that are strong in areas in which they may be weaker.

A key driver of mergers will be the sustainability of operating expenses, which as the chart below shows, is a challenge for some funds across all size categories. Though, smaller funds are more likely to have a high cost per member (CPM) and management expense ratio (MER), which measure the operational costs of the fund relative to its size.

Sustainability of cost structures

Source: SuperRatings

“With the increased regulatory scrutiny on the sector, funds are focused on the challenge of increasing scale and driving down fees,” said Mr Rappell. “It’s pleasing to see that there’s a clear focus among providers on their plans to adapt to the changing landscape, which should support continued uplift in member outcomes.”

However, there remains a number of providers who are struggling to deliver sufficient value for money and the industry’s ability to address this is critical. APRA released its MySuper Heatmaps in December 2019 which highlight laggards based on investment returns, fees and sustainability metrics and has emphasised a tougher approach going forward. APRA also now has stronger powers to force underperforming funds to merge, which is likely to further drive consolidation across the industry.

Release ends

We welcome media enquiries regarding our research or information held in our database. We are also able to provide commentary and customised tables or charts for your use.

For more information contact:

Kirby Rappell
Executive Director
Tel: 1300 826 395
Mob: +61 408 250 725
Kirby.Rappell@superratings.com.au

The question no-one wants to ask is – Why are APRA collecting, interpreting and then publishing information in the public domain? The answer is simple – They shouldn’t be!

Instead of regulating, APRA are now trying to play the shame game through their just released heatmaps. But there is a real risk that some of those shamed will be the wrong funds. As the founder of SuperRatings, Jeff Bresnahan says, “The problem is that no one in the industry wants to tell the regulator that they have got it wrong.”

Effectively, APRA is putting into circulation data which analyses just parts of a super fund, not the whole. By ignoring things like Governance, Advice, Insurance and Member servicing structures, consumers are not being provided with the whole picture.

As Bresnahan says, “While conflicts of interest were identified as a major issue in superannuation during the Royal Commission, it seems ironic that APRA has deliberately avoided reporting any measurement of a Fund’s Governance structure”.

In an industry which carries inherently conflicted Directors, it would appear that Governance is ignored in favour of more easily assessable information. Whether such omissions create any legal liabilities for APRA in the future remains debatable.

As a result, APRA continues its foray into unchartered territory. This is not the first time APRA have got it wrong. They have been producing performance tables for over a decade. Unfortunately, the performance tables were flawed from a usefulness perspective, in that they don’t reflect the performance of a super fund’s investment options. However, they continue to produce them and in doing so confuse and possibly mislead Australians.

And so it continues with the heatmaps. Having reviewed the heatmap methodology, SuperRatings is of the opinion that their release into the public domain may create more questions than they answer and that consumers could well be influenced into products that are inappropriate for them.

Aside from the bigger question of why APRA is publishing such data, there remain a number of problems with the methodology adopted. Critically, APRA appears to ignore implicit asset fees when measuring net investment performance.  As Bresnahan says, “This methodology can easily overstate the net benefit a member receives. Similarly, a low-cost investment option with high administration fees creates the very real possibility of consumers investing monies in cheap investment options that have no chance of outperforming the relevant index over any time period, whilst getting slugged high administration fees.”

Investment analysis since the onset of the Superannuation Guarantee in 1992 has shown that all implicit fees and performance must be analysed together on an actual net of fees basis. Many leading funds, in terms of balanced option performance, have had higher allocations than the average fund to traditionally more expensive asset classes such as infrastructure, private equity and unlisted property. These asset classes have continually outperformed cheaper alternatives.

It’s only when all actual fees and returns are combined that the range of results is clearly evident in dollar terms, as the following graph indicates. The graph shows the disparity of net earnings on a $50,000 starting balance (and $50,000 salary) with SGC contributions mapped over both the last 3 and 10 years. Notably, many of the funds that added the most value, over both the short and long term, invested into the more expensive asset classes. Driving people into low-cost options will come at the expense of future earnings, something that taxpayers will ultimately have to bear.

Net benefit trend analysis (over 3 and 10 years)

Source: SuperRatings

And the anomalies continue. The heatmaps are judging funds on short term performance over just 3 and 5 years. Whilst it will be claimed this is necessary due to the limited performance history of MySuper products, it should be noted that most funds have been around for over 25 years and that their default option provides an accurate MySuper proxy.

As Bresnahan said, “Given super is a key plank of Australia’s economic future, it seems counter-intuitive for the Government’s regulator to not measure funds over a more realistic period. Certainly, it is commonly accepted that 7, 10 and 15 year performance analysis is best practice given the long term (60 years plus) nature of superannuation membership.”

Again, a consumer moving funds due to seeing a 3-year performance gap, mid-way through an economic cycle, will no doubt be moving for the wrong reasons.

The way forward

Bresnahan says, “Australians are not stupid, but they remain frustratingly unengaged with their superannuation.” This problem remains the real challenge for much of the industry. APRA’s endeavours are admirable, but questionable at the same time. He goes on to say, “A regulator should set the structure under which funds need to operate. The morphing of this regulatory process into public comparisons leaves it open to being seen as stepping across the line. One wonders what they are actually trying to achieve by moving into this public domain.”

If APRA must continue down this path, then SuperRatings suggests that they need to concentrate on the whole picture, rather than isolated parts therein. This should, aside from earlier mentioned issues, also include:

  1. Regulations to enable consistent fee disclosures, including the inequitable use of tax deductions and transparency to members;
  2. The disclosure of risk within portfolios, both via the assumptions within their growth/defensive disclosures and accepted risk measures;
  3. Compulsory disclosure of major asset holdings;
  4. Moving members into go-forward products and removing legacy structures;
  5. Continued rationalisation of member accounts; and
  6. Increased focus on the decumulation phase and the optimisation of the alignment with retiree objectives.

Identifying poorly run funds is not difficult and APRA would be well aware of them. A series of simple measures such as the non-public fee analysis shown below, when combined with other key assessments, quickly shows those funds who have spent the past few decades masking conflicts of interest at the expense of members.

When it costs a fund over $1,200 to run every account (versus a median of $300) or a fund’s operating expenses as a percentage of assets are over two and a half times the median, then those funds bear further scrutiny. Similar work can be done across Investments, Governance, Administration and Insurance, to name a few. By putting together the whole picture, the poor funds are very quickly exposed.

Operating expenses versus size and members

Source: SuperRatings

But it’s not all gloom and doom for the process. Importantly, after 14 years of industry debate, APRA has finally made a call on what constitutes a growth asset and what constitutes a defensive asset. The growth/defensive debate remains loud within the industry but with APRA’s call of Australian Unlisted Property and Australian Unlisted Infrastructure being 25% defensive, at least there is a starting point. SuperRatings suspect this will not however be the final position.

Certainly, APRA’s front foot involvement with data will give cause for reflection for all super funds, as the funds review their results and assess whether it has any implications for their future.

SuperRatings continues to watch the evolution of the market and continues to monitor funds on their effectiveness in responding to key challenges. We look forward to seeing whether the heatmaps evolve over time and remain broadly supportive of APRA’s underlying intentions. However, we underline that this remains only part of the picture and that the risk of making providers look alike is real. In an environment where innovation is needed, regulatory settings to support innovation are vital to ensure a vibrant industry that thrives into the future resulting in better outcomes for members.

Release ends

We welcome media enquiries regarding our research or information held in our database. We are also able to provide commentary and customised tables or charts for your use.
For more information contact:

Jeff Bresnahan
Founder & Chairman
Tel: 1300 826 395
Jeff.Bresnahan@superratings.com.au

Kirby Rappell
Executive Director
Tel: 1300 826 395
Kirby.Rappell@superratings.com.au

Super funds are off to a positive start in the December quarter, regaining momentum following a rocky September and paving the way for double-digit returns for the 2019 calendar year.

While markets have come under pressure in recent months, super funds have once again proved they are up to the task of navigating the significant uncertainty in markets, geopolitics, and the global economy.

Super fund returns held up well in October, despite weakness from Australian shares and signs of softer economic growth globally. The major financials sector has come under pressure due to constrained lending, lower net interest margins, and continued fallout from the Royal Commission. IT shares also suffered a dip as investors questioned the lofty valuations of Australia’s local tech darlings.

According to SuperRatings’ estimates, the median balanced option returned a modest 0.3% in October, but the year-to-date return for 2019 is sitting at a very healthy 12.5%. The median growth option has fared even better, returning 14.4%, while the median capital stable option has delivered a respectable 7.1% to the end of October.

Over the past five years, the median balanced option has returned an estimated 7.6% p.a., compared to 8.3% p.a. from growth and 4.7% p.a. from capital stable (see table below).

Estimated accumulation returns (% p.a. to end of October 2019)

  YTD 1 yr 3 yrs 5 yrs 7 yrs 10 yrs
SR50 Growth (77-90) Index 14.4% 11.9% 10.1% 8.3% 10.1% 8.5%
SR50 Balanced (60-76) Index 12.5% 10.5% 8.9% 7.6% 9.1% 7.9%
SR50 Capital Stable (20-40) Index 7.1% 6.8% 5.0% 4.7% 5.3% 5.6%

Source: SuperRatings

Estimated pension returns (% p.a. to end of October 2019)

  YTD 1 yr 3 yrs 5 yrs 7 yrs 10 yrs
SRP50 Growth (77-90) Index 16.4% 13.3% 11.2% 9.4% 11.4% 9.5%
SRP50 Balanced (60-76) Index 13.8% 11.7% 9.8% 8.3% 9.9% 8.7%
SRP50 Capital Stable (20-40) Index 8.3% 7.7% 5.9% 5.5% 6.0% 6.4%

Source: SuperRatings

“This year has provided further solid evidence of the ability of super funds to deliver for their members through a challenging market environment,” said SuperRatings Executive Director Kirby Rappell.

“Whether it’s the US-China trade conflict, the weaker economic outlook, falling interest rates, or the rolling Brexit saga, there’s been a lot for funds to take in. This has been a real test of their discipline and ability to manage risks on the downside. Growing wealth in this environment while protecting members’ capital is a tall order, but they have managed it well.”

Shifting asset allocation key to managing risk

One of the most important trends in the superannuation industry is the broadening of members’ investments across different asset classes. Over the past five years, super funds have shifted away from Australian shares and fixed income and moved a higher proportion of funds into international shares and alternatives (see chart below).

Change in asset allocation (2009 to 2019)

Super fund asset allocations have shifted towards alternatives

Source: SuperRatings

The shift to alternatives is significant and has been the subject of debate within the industry. Alternatives include private market assets and hedge funds, which despite the negative connotations can provide an important source of diversification and downside protection when markets take a turn for the worse.

These assets tend to be less liquid, but they can play an important role for funds looking to generate income while managing risks for their members in a world characterised by low yields and growing uncertainty. However, funds should be clear about their alternatives strategy and the risks they could potentially add to members’ portfolios.

“This shift in asset allocation is in part being driven by the low interest rate environment, which has prompted super funds to reach for yield by allocating to alternatives and other less liquid assets,” said Mr Rappell.

“This isn’t necessarily a bad thing, and it may in fact result in a more robust asset allocation, but it’s something members should be aware of. Alternatives can help protect capital under certain market conditions, but they can also be used to boost returns by taking on some additional risk. We generally think the shift to a broader asset allocation is positive, but funds should not be complacent in ensuring risk is appropriately managed.”

Important information: Any express or implied rating or advice is limited to general advice, it doesn’t consider any personal needs, goals or objectives.  Before making any decision about financial products, consider whether it is personally appropriate for you in light of your personal circumstances. Obtain and consider the Product Disclosure Statement for each financial product and seek professional personal advice before making any decisions regarding a financial product.