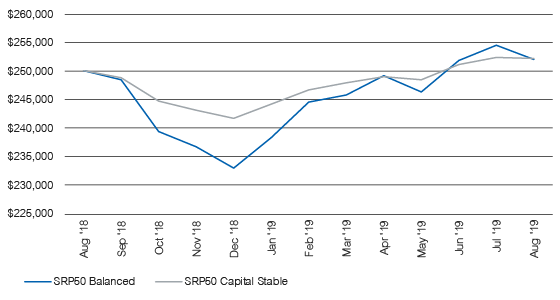
Australia’s superannuation fund members have reason to expect a pickup in performance in the second half of 2018, following a volatile first half that saw super funds scrambling to recover from a global selloff earlier in the year.
SuperRatings’ data shows the median balanced option grew at an estimated 1.3% in June, bringing the June quarter return to 3.3%, ending the financial year on a high in what is historically the weakest quarter for superannuation.
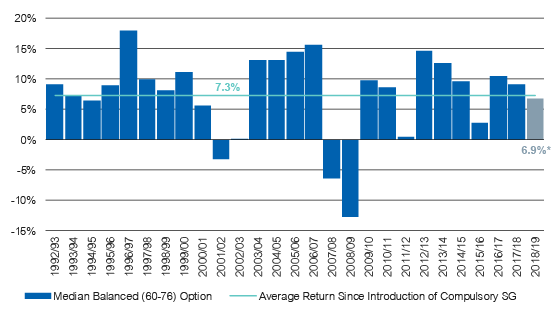
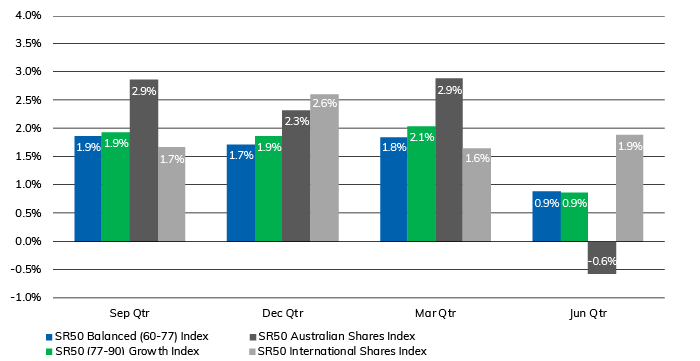
According to SuperRatings’ analysis, super funds have historically recorded higher returns in the second half of the calendar year. Over the past 10 years, balanced options have delivered an average return of 1.9% in the September quarter and 1.7% in the December quarter. In contrast, the average return for the June quarter is only 0.9%, reflecting the historic seasonal impact on equity markets.
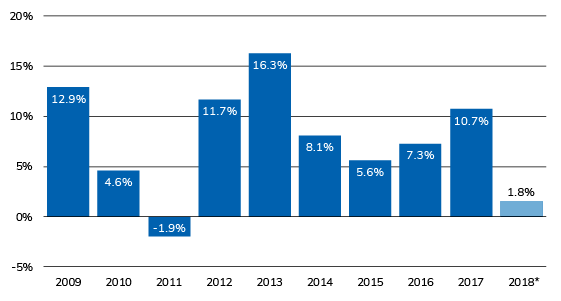
The results are even more exaggerated for higher growth options. For example, options with a pure Australian shares focus have an average return of 2.3% in the December quarter and -0.6% in the June quarter (see chart below).
Average option returns for each FY quarter (2008-2018)
Source: SuperRatings
“Luckily this year investors forgot the old adage of ‘sell in May and go away’”, said SuperRatings CEO Kirby Rappell. “Instead we saw a strong recovery which ended up producing a very positive June quarter for superannuation.”
“If history is a guide, members can anticipate a bit of a kick in coming periods, although this is conditional on the management of some downside risks to the Australian economy, as well as the broader global growth picture.”
According to SuperRatings, Australian shares are set to move higher through the rest of 2018, but will likely continue to underperform global markets.
“With the Australian share market dominated by the banks, it is sensible to expect softer growth in the wake of the Royal Commission into Financial Services,” said Mr Rappell. “The Australian economy has a bit of extra baggage, including low wage growth and a cooling property sector which could impact sentiment, but overall our outlook is positive.”
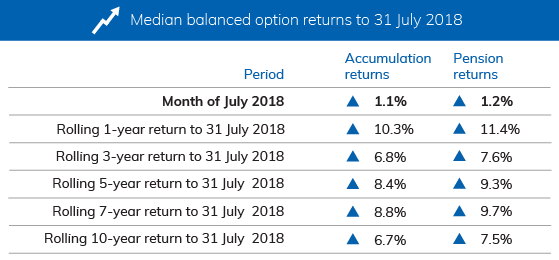
Despite the comeback in the June quarter, the financial-year return for the median balanced option is expected to be in single-digit territory at around 9.2%, bringing the 5-year return to 8.9% p.a. and the 10-year return to 6.5% p.a.
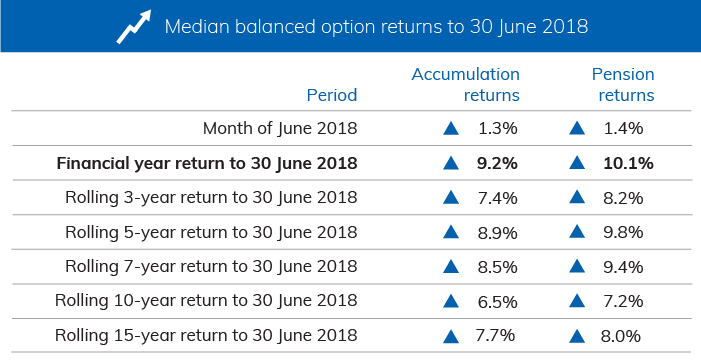
Interim results only. Median Balanced Option refers to ‘Balanced’ options with exposure to growth style assets of between 60% and 76%. Approximately 60% to 70% of Australians in our major funds are invested in their fund’s default investment option, which in most cases is the balanced investment option. Returns are net of investment fees, tax and implicit asset-based administration fees
Super funds add $150 billion over past financial year
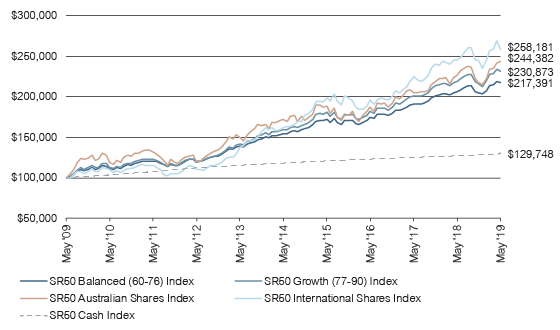
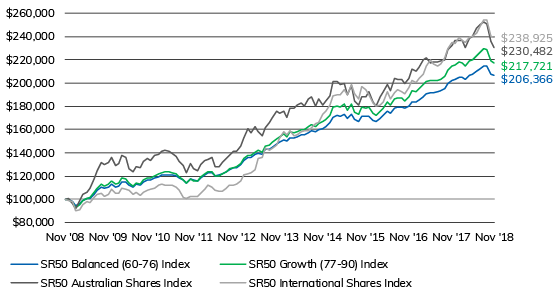
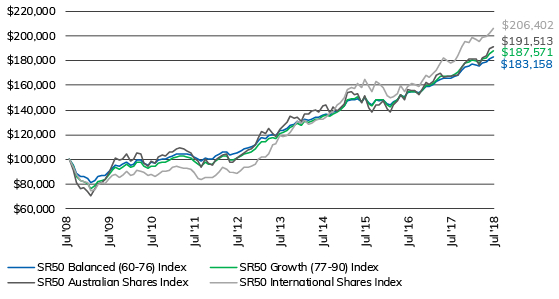
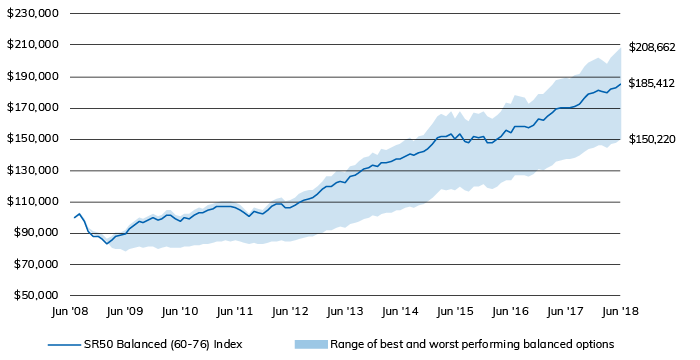
Super funds continue to amass wealth for members, with the median balanced option adding more than 85% over the past 10 years, while members in growth options have seen their savings grow by over 90%. This is despite the significant drawdowns members experienced during the Global Financial Crisis, with balanced options taking nearly two years to fully recover.
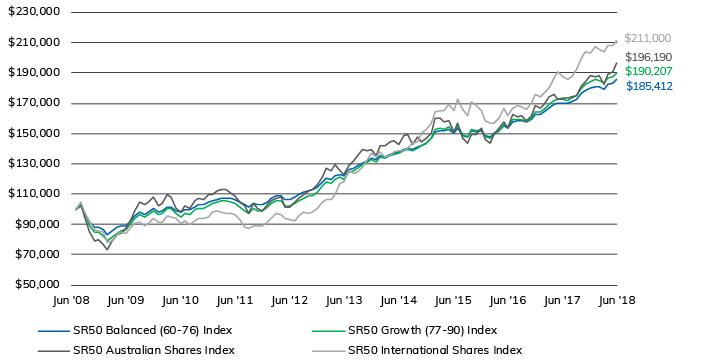
Growth in $100,000 invested for 10 years to 30 June 2018
Select index
SR50 Balanced (60-76) Index
SR50 Growth (77-90) Index
SR50 Australian Shares Index
SR50 International Shares Index
SR50 Cash Index
Source: SuperRatings
Interim results only
Source: SuperRatings
Interim results
Over the last ten years the median balanced option has returned 6.5% p.a., meaning an account balance of $100,000 in 2008 has now accumulated to $185,412. Growth members have experienced a modest bonus, with a similar starting balance growing to $190,207.
Share focused options have delivered the highest returns, with the median Australian share option growing to $196,190 and the median international share option growing to $211,000, more than doubling in size.
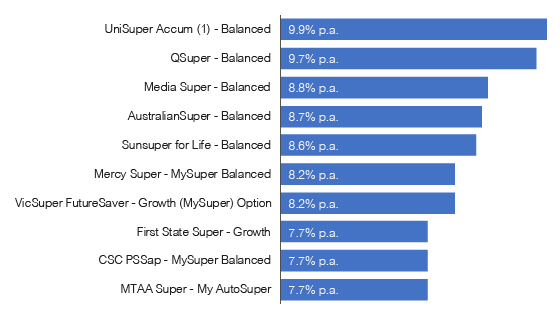
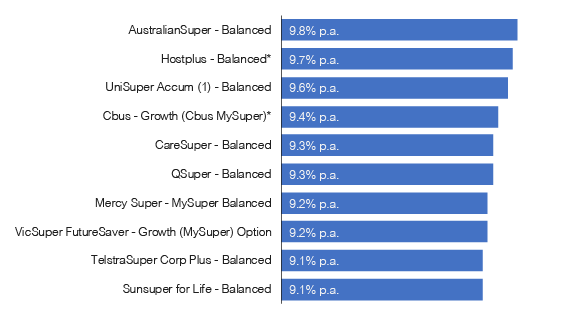
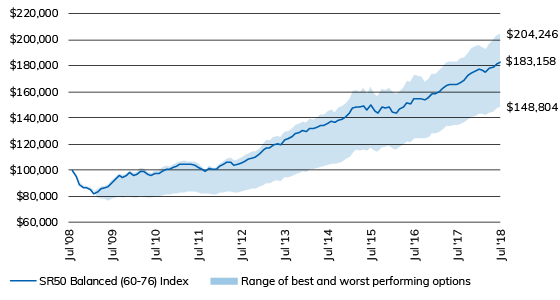
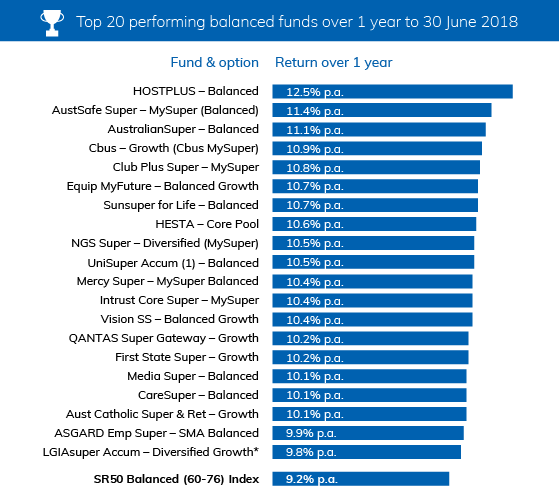
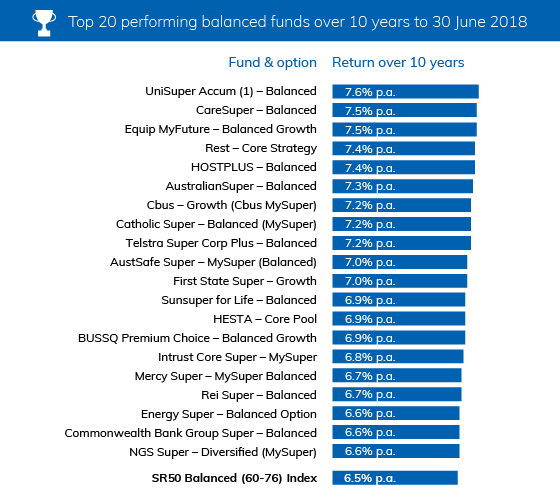
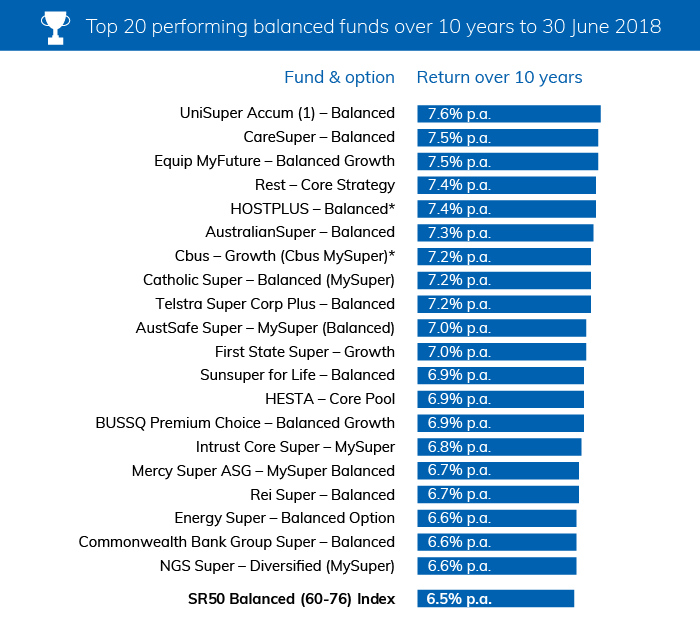
Best and worst performing balanced options to 30 June 2018
Source: SuperRatings
Interim results
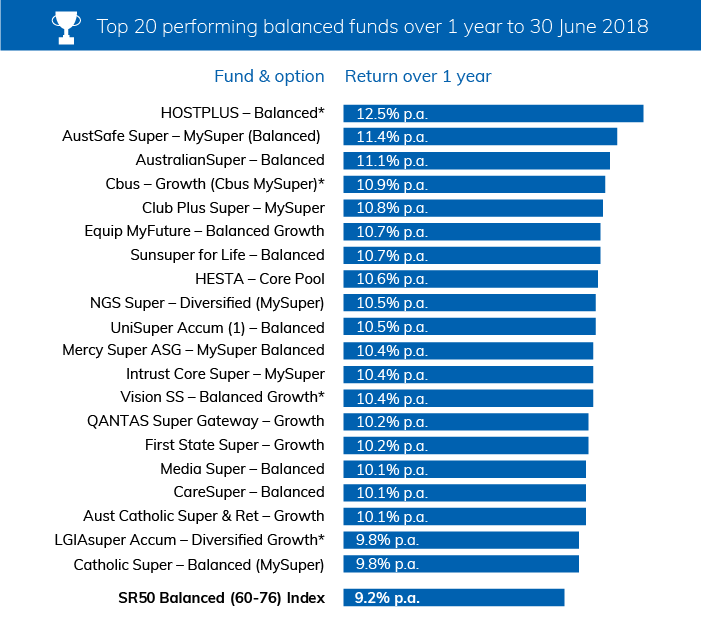
SuperRatings’ data shows HOSTPLUS was the best performing balanced option for the 2017-18 financial year, returning 12.5%, followed by AustSafe on 11.4% and AustralianSuper on 11.1%.
Over 10 years, the results show UniSuper narrowly moving ahead of both CareSuper and Rest in the balanced option rankings, while Equip has moved up into third sport. Each has returned well over 7.0% p.a. over the past 10 years, compared to the median balanced option return of 6.5% p.a.
Source: SuperRatings
*Interim results. Includes public offer funds only
Source: SuperRatings
*Interim results
Release ends
Warnings: Past performance is not a reliable indicator of future performance. Any express or implied rating or advice presented in this document is limited to “General Advice” (as defined in the Corporations Act 2001(Cth)) and based solely on consideration of the merits of the superannuation or pension financial product(s) alone, without taking into account the objectives, financial situation or particular needs (‘financial circumstances’) of any particular person. Before making an investment decision based on the rating(s) or advice, the reader must consider whether it is personally appropriate in light of his or her financial circumstances, or should seek independent financial advice on its appropriateness. If SuperRatings advice relates to the acquisition or possible acquisition of particular financial product(s), the reader should obtain and consider the Product Disclosure Statement for each superannuation or pension financial product before making any decision about whether to acquire a financial product. SuperRatings research process relies upon the participation of the superannuation fund or product issuer(s). Should the superannuation fund or product issuer(s) no longer be an active participant in SuperRatings research process, SuperRatings reserves the right to withdraw the rating and document at any time and discontinue future coverage of the superannuation and pension financial product(s). Copyright © 2018 SuperRatings Pty Ltd (ABN 95 100 192 283 AFSL No. 311880 (SuperRatings)). This media release is subject to the copyright of SuperRatings. Except for the temporary copy held in a computer’s cache and a single permanent copy for your personal reference or other than as permitted under the Copyright Act 1968 (Cth.), no part of this media release may, in any form or by any means (electronic, mechanical, micro-copying, photocopying, recording or otherwise), be reproduced, stored or transmitted without the prior written permission of SuperRatings. This media release may also contain third party supplied material that is subject to copyright. Any such material is the intellectual property of that third party or its content providers. The same restrictions applying above to SuperRatings copyrighted material, applies to such third party content.
// GLOBAL PARAMETERS
var chartHeight = 376;
var chartWidth = 700;
var startAmt = 100000;
var numAxes = 8;
var dateNum = 10;
// DATA
// SR50 Balanced (60-76) Index
var balancedPrices = [
100000,
102333.7,
97657.04991,
91165.6881454324,
88330.4352441095,
88221.6121478887,
86592.2471931294,
83422.5379846249,
85291.2028354804,
87896.8490821044,
88784.6072578336,
89255.1656763002,
92486.2026737822,
95367.1478870705,
97799.0101581908,
96771.4359584587,
98039.1417695145,
100188.649952811,
98014.5562488351,
98834.8400700817,
101701.050432114,
101617.452168659,
99053.4406155392,
97832.5079065121,
99790.0385572135,
99398.1630757993,
101624.681928697,
102984.318548221,
102801.624367117,
104534.756952322,
105569.65104615,
106720.360242553,
107083.209467378,
107238.480121105,
106965.021996796,
106259.052851618,
104790.23396405,
102866.075688002,
101002.553860838,
103807.293779,
102757.594424306,
102645.588646384,
104990.937701365,
106875.525033105,
108470.000991073,
108795.410994047,
106408.004495193,
106674.769362463,
107821.523133109,
109589.796112492,
111209.09493985,
112155.595546883,
112753.945649126,
114913.860231981,
117857.263847963,
120155.480492998,
119932.351765722,
122353.066353762,
123197.302511603,
122452.944409828,
126177.105808164,
126733.546844778,
128424.04562614,
130692.784816172,
131718.723176979,
133615.472790727,
132484.952275445,
135256.669961999,
134776.508783634,
135750.403836105,
137180.805841326,
137427.73129184,
139104.3496136,
140309.549698653,
139471.480758303,
141180.843226476,
142233.911136103,
143893.780879061,
146670.499168684,
151018.252775542,
151926.023492975,
151469.030014309,
152936.007569997,
149846.700217083,
153323.143662119,
148849.940945777,
147366.800134193,
151770.414855803,
151279.58933416,
151525.267387238,
148108.372607656,
147375.236163248,
149895.057951168,
151948.920035214,
155420.952858019,
153866.743329439,
157946.366162076,
158399.514286595,
158470.794068024,
157266.416033107,
159100.299710469,
162520.956154244,
162342.183102474,
164127.947116601,
166573.453528639,
168891.82285485,
169691.525636068,
169725.463941195,
169810.326673166,
170823.924513078,
172421.128207275,
176333.018764042,
178544.058486324,
179597.468431393,
181106.087166217,
180755.64688755,
179454.20622996,
182361.364370885,
183032.636553135,
185412.060828325
];
// SR50 Growth (77-90) Index
var growthPrices = [
100000,
102722.4,
97004.7684936,
88728.2246409576,
85130.2951317667,
84781.2609217265,
82713.3611865846,
78858.9185552898,
81170.3523170639,
84368.4641983562,
85621.3358917018,
86434.738582673,
90255.1540280271,
93540.4416346473,
96262.4684862155,
94788.8826186286,
96177.5397489915,
98764.7155682393,
96019.0564754423,
96966.4765056855,
100534.842841095,
100323.719671128,
96872.5837144416,
95177.3134994389,
97490.1222174752,
96719.9502519572,
99316.8809162222,
100873.176440179,
100641.168134367,
102570.157403998,
103688.172119702,
104963.536636774,
105246.938185694,
105289.036960968,
104741.533968771,
103736.015242671,
101790.964956871,
99232.1436797847,
97015.4960542657,
100462.941706554,
98989.1503517189,
98753.6551630322,
101390.377755885,
103529.714726534,
105364.364801203,
105575.093530806,
102333.199133755,
102594.558124343,
103858.728269551,
105748.957124057,
107440.940438042,
108466.679096404,
109122.5771049,
111512.361543497,
115028.569327686,
117536.19213903,
117189.46037222,
119951.967521574,
120902.826768118,
119971.875002003,
124451.504842703,
125002.327203137,
126964.738737899,
129554.819408152,
130752.6832684,
132818.57566404,
131251.316471205,
134515.536711844,
133802.604367271,
134873.025202209,
136445.240056991,
136520.284939023,
138548.839852932,
139814.899151508,
138802.080022054,
140633.573467945,
141857.507457837,
143855.57045038,
146980.113440562,
152363.701035663,
153308.203618384,
152802.439854646,
154599.243744897,
150799.812730623,
154976.967543261,
149310.389702009,
147444.009830734,
152672.079531312,
152098.490528513,
152322.835802043,
147947.971634972,
146793.977456219,
149685.08484222,
152111.779437682,
156253.935303549,
154019.504028708,
158921.020724918,
159256.661920689,
159215.573701913,
157496.045505933,
159952.983815825,
164407.514462112,
163947.173421618,
166062.091958757,
168868.54131286,
171503.903768589,
172237.768972815,
172099.978757636,
172032.859765921,
173144.192040009,
175052.414180482,
179788.982403377,
182505.953505457,
183819.996370696,
185484.302617836,
184953.075575139,
182881.601128697,
186685.538432174,
187525.623355119,
190207.239769097
];
// SR50 Australian Shares Index
var australianPrices = [
100000,
103600,
94742.2,
84660.9667246,
79369.6563043125,
79798.1730786995,
76606.2461555515,
73115.4527307353,
78861.4499299383,
83062.4782291561,
84291.8029069476,
87216.7284678187,
93156.1876764771,
98980.8714671365,
104622.781140763,
102948.816642511,
104318.035903857,
108072.233379964,
102333.597787488,
103916.800878859,
109339.179548717,
107895.902378674,
100632.781814152,
97990.1649637119,
102076.354842699,
100769.777500712,
105299.378999369,
107185.817374143,
106178.91380573,
109660.414210506,
109901.667121769,
112220.592298039,
112961.248207206,
112556.395093631,
110572.701186501,
108704.022536449,
105060.589813095,
102575.906864015,
97297.350696793,
103653.300131061,
100273.995240188,
98991.3905670709,
103309.098049435,
105633.552755547,
106974.99324199,
107897.866508688,
101425.612986165,
101422.468792162,
104607.134312236,
107313.843912565,
109352.806946904,
112020.796730795,
112580.900714448,
116093.424816739,
121549.815783126,
127313.221848299,
125199.822365617,
129368.976450392,
125306.79058985,
122665.072830634,
128608.318274352,
131744.946548745,
135045.94792947,
139576.33434466,
138180.571001213,
139368.923911824,
135638.296556552,
141511.434797451,
141974.743234978,
144097.265646341,
144934.758954277,
142949.152756604,
148181.091747495,
149272.741850399,
142815.053765209,
147742.173120109,
144078.16722673,
146599.535153198,
150368.316002916,
159684.986494141,
160072.222586389,
157810.402081243,
158683.409225557,
151066.60558273,
157148.396056885,
146611.596101271,
143494.633568158,
149492.709251307,
149477.759980382,
153071.05585255,
145682.928270771,
143362.199223418,
149212.953935925,
153073.540693109,
158002.508703427,
153522.50557165,
162242.58388812,
160942.37182084,
161496.335464648,
158185.660587622,
162032.735853113,
168019.845442886,
166709.290648431,
169326.626511612,
174287.896668402,
175799.147020414,
172375.986029632,
173141.335407604,
173223.058117916,
174124.337689304,
174599.871255533,
181237.634561055,
184305.987714173,
187977.547295428,
187563.996691378,
188140.755981204,
182628.231830954,
188928.905829122,
190828.208119422,
196190.480767578
];
// SR50 International Shares Index
var internationalPrices = [
100000,
104478.9,
98084.79132,
91630.812051144,
86801.8682560487,
85675.1800060852,
85049.7511920408,
78143.7113952471,
78843.5664745029,
83313.9966936072,
84901.1283306204,
84129.9713819934,
88509.6094321972,
90810.8592774343,
91746.2111279919,
88866.2058144731,
90950.1183408225,
94096.992435415,
91283.4923615961,
91739.909823404,
95198.5044237464,
94706.9945454066,
93713.8022936089,
90691.53216964,
92045.7381279971,
90131.1867749347,
92067.745453981,
94051.5291652779,
94080.8732423775,
95150.2905285236,
97852.5587795336,
98537.5266909904,
97808.348993477,
97315.7861479459,
97454.3638274206,
96040.4959170124,
93389.7782297028,
88429.3801590322,
87483.1857913305,
89379.9962256581,
88934.4369444732,
88952.2238318621,
91087.0772038268,
94200.3424155764,
97564.0482425518,
96335.1314908886,
93770.2086149437,
93184.9887429778,
92593.2640644599,
95537.0817088613,
97834.4619127143,
97509.5536647022,
98461.8319657916,
100732.952581915,
104802.563866224,
106227.878734805,
106632.819408542,
109348.544053238,
117226.45056101,
118211.152745722,
125026.853179583,
123539.033626745,
124801.726089444,
127577.316477674,
132797.142381358,
137102.691331646,
134851.190934598,
137893.568653273,
134425.545401643,
134894.421704004,
137484.124811878,
138451.325629929,
138409.79023224,
140506.698554259,
143639.997932019,
144176.636964293,
150289.726371579,
152761.24092176,
156887.474800297,
163921.838507918,
165144.531501349,
164658.676289672,
168953.303884659,
165228.22144061,
172535.439533821,
165840.891944469,
161546.442047567,
170797.399051421,
168422.461217611,
165037.169747137,
158690.170273002,
156574.512922922,
157140.0600636,
159678.657733927,
166848.389144838,
162121.407431976,
166567.42490939,
168602.046004658,
167464.488000265,
165957.307608263,
170288.959294146,
175645.909375621,
174258.306691554,
176959.310445273,
180126.882102243,
186161.132652668,
190688.943721046,
187581.476694168,
186087.390232299,
187546.687546501,
192230.853614662,
199401.833377904,
204067.836278947,
202925.056395785,
207399.756814368,
205761.298735534,
203950.599306662,
208029.611292795,
208440.261745487,
210999.763727431
];
// SR50 Cash Index
var cashPrices = [
100000,
100535,
100972.32725,
101547.869515325,
101948.272764824,
102280.318289219,
102611.195118885,
102847.200867658,
103048.575686957,
103268.7904932,
103492.88376857,
103725.639264166,
103964.208234473,
104192.929492589,
104442.992523371,
104672.767106923,
104934.44902469,
105217.772037057,
105522.903575964,
105818.367705977,
106123.759515176,
106442.55528876,
106772.527210155,
107129.254223564,
107504.206613347,
107869.720915832,
108230.329392854,
108618.335123727,
108987.637463148,
109388.929944287,
109793.668985081,
110155.988092732,
110552.549649866,
110939.48357364,
111338.865714505,
111739.685631077,
112130.774530786,
112533.77253445,
112920.438576878,
113326.952155755,
113700.931097869,
114083.762132876,
114462.520223157,
114805.907783826,
115187.063397668,
115567.180706881,
115948.552403213,
116254.656581558,
116576.449470976,
116901.231459202,
117220.605623548,
117537.101258732,
117819.777987259,
118126.934148472,
118414.100725387,
118672.48029317,
118939.018683908,
119224.591267768,
119498.807827684,
119749.755324122,
120025.179761368,
120276.872563327,
120519.59129216,
120760.630474744,
120999.011959302,
121232.419053371,
121469.307200201,
121691.960440299,
121930.354990802,
122162.022665284,
122401.948877799,
122646.752775555,
122892.046281106,
123128.121902012,
123359.479643066,
123600.894144727,
123833.88183019,
124092.694643215,
124352.917023882,
124578.741921197,
124808.4651213,
125017.644108843,
125227.548733302,
125422.778481777,
125621.448162892,
125822.442479953,
126009.666274363,
126211.281740402,
126398.831705068,
126596.393079023,
126800.086675487,
126990.286805501,
127196.900002133,
127413.134732137,
127628.462929834,
127819.905624229,
128021.094155681,
128218.374661775,
128391.982341067,
128571.731116345,
128743.88866431,
128924.001364551,
129104.494966461,
129272.330809918,
129453.312073052,
129630.015844031,
129820.183077275,
129998.556008823,
130168.98411575,
130338.203795101,
130507.643460035,
130690.354160879,
130856.722981725,
131025.135584203,
131211.84640241,
131369.300618093,
131540.080708897,
131724.870783733,
131917.452544819,
132101.023981894
];
// Dates
var dates = [“Jul 2008″,”Aug 2008″,”Sep 2008″,”Oct 2008″,”Nov 2008″,”Dec 2008″,”Jan 2009″,”Feb 2009″,”Mar 2009″,”Apr 2009″,”May 2009″,”Jun 2009″,”Jul 2009″,”Aug 2009″,”Sep 2009″,”Oct 2009″,”Nov 2009″,”Dec 2009″,”Jan 2010″,”Feb 2010″,”Mar 2010″,”Apr 2010″,”May 2010″,”Jun 2010″,”Jul 2010″,”Aug 2010″,”Sep 2010″,”Oct 2010″,”Nov 2010″,”Dec 2010″,”Jan 2011″,”Feb 2011″,”Mar 2011″,”Apr 2011″,”May 2011″,”Jun 2011″,”Jul 2011″,”Aug 2011″,”Sep 2011″,”Oct 2011″,”Nov 2011″,”Dec 2011″,”Jan 2012″,”Feb 2012″,”Mar 2012″,”Apr 2012″,”May 2012″,”Jun 2012″,”Jul 2012″,”Aug 2012″,”Sep 2012″,”Oct 2012″,”Nov 2012″,”Dec 2012″,”Jan 2013″,”Feb 2013″,”Mar 2013″,”Apr 2013″,”May 2013″,”Jun 2013″,”Jul 2013″,”Aug 2013″,”Sep 2013″,”Oct 2013″,”Nov 2013″,”Dec 2013″,”Jan 2014″,”Feb 2014″,”Mar 2014″,”Apr 2014″,”May 2014″,”Jun 2014″,”Jul 2014″,”Aug 2014″,”Sep 2014″,”Oct 2014″,”Nov 2014″,”Dec 2014″,”Jan 2015″,”Feb 2015″,”Mar 2015″,”Apr 2015″,”May 2015″,”Jun 2015″,”Jul 2015″,”Aug 2015″,”Sep 2015″,”Oct 2015″,”Nov 2015″,”Dec 2015″,”Jan 2016″,”Feb 2016″,”Mar 2016″,”Apr 2016″,”May 2016″,”Jun 2016″,”Jul 2016″,”Aug 2016″,”Sep 2016″,”Oct 2016″,”Nov 2016″,”Dec 2016″,”Jan 2017″,”Feb 2017″,”Mar 2017″,”Apr 2017″,”May 2017″,”Jun 2017″,”Jul 2017″,”Aug 2017″,”Sep 2017″,”Oct 2017″,”Nov 2017″,”Dec 2017″,”Jan 2018″,”Feb 2018″,”Mar 2018″,”Apr 2018″,”May 2018″,”Jun 2018”];
// All prices
var allPrices = balancedPrices.concat(growthPrices, australianPrices, internationalPrices, cashPrices);
// FUNCTIONS
var balancedPoints = calcpoints(balancedPrices, chartHeight, chartWidth);
createchart(balancedPoints, balancedPrices);
createaxes(balancedPrices);
createDates();
function removeChart(){
var lines = document.getElementsByClassName(“line”);
while(lines.length > 0){
lines[0].parentNode.removeChild(lines[0]);
};
var labels = document.getElementsByClassName(“price-label”);
while(labels.length > 0){
labels[0].parentNode.removeChild(labels[0]);
};
var polyline = document.getElementById(“polyline-id”);
polyline.setAttribute(“points”, “”);
var polylineFill = document.getElementById(“polyline-fill”);
polylineFill.setAttribute(“points”, “”);
};
function report(portfolio){
if(portfolio == “balanced”){
removeChart();
createaxes(balancedPrices);
createDates();
var balancedPoints = calcpoints(balancedPrices, chartHeight, chartWidth);
createchart(balancedPoints, balancedPrices);
} else if(portfolio == “growth”){
removeChart();
createaxes(growthPrices);
createDates();
var growthPoints = calcpoints(growthPrices, chartHeight, chartWidth);
createchart(growthPoints, growthPrices);
} else if(portfolio == “australian”){
removeChart();
createaxes(australianPrices);
createDates();
var australianPoints = calcpoints(australianPrices, chartHeight, chartWidth);
createchart(australianPoints, australianPrices);
} else if(portfolio == “international”){
removeChart();
createaxes(internationalPrices);
createDates();
var internationalPoints = calcpoints(internationalPrices, chartHeight, chartWidth);
createchart(internationalPoints, internationalPrices);
} else if(portfolio == “cash”){
removeChart();
createaxes(cashPrices);
createDates();
var cashPoints = calcpoints(cashPrices, chartHeight, chartWidth);
createchart(cashPoints, cashPrices);
};
};
function numberWithCommas(num){
var parts = num.toString().split(“.”);
parts[0] = parts[0].replace(/B(?=(d{3})+(?!d))/g, “,”);
return parts.join(“.”);
};
function dataconvert(prices, dates){
var data = [];
for(var i = 0; i < prices.length; i++){
var datum = {
price: prices[i],
date: dates[i]
};
data.push(datum);
};
return data;
};
function calcdollar(data, startAmt){
var oneData = [];
for(var i = 0; i < data.length; i++){
oneData.push(data[i] + 1);
};
var dollarAmts = [];
var start = startAmt;
var accum = start;
for(var i = 0; i < oneData.length; i++){
accum = oneData[i] * accum;
dollarAmts.push(accum);
};
return dollarAmts;
};
function calcpoints(prices, chartHeight, chartWidth){
var points = [];
var xPoint = 0;
var step = chartWidth / prices.length;
var max = Math.max.apply(null, allPrices);
var min = Math.min.apply(null, allPrices);
var range = max – min;
var firstInterval = range / numAxes;
var interval = 20000;
var minAxis = 60000 // startAmt – (interval * Math.ceil((startAmt – min) / interval));
var maxAxis = 220000 // minAxis + (numAxes * interval);
var axisRange = maxAxis – minAxis;
for(var i = 0; i < prices.length; i++){
if(prices[i] === maxAxis){
var yPoint = 0;
} else if(prices[i] === minAxis){
var yPoint = chartHeight;
} else {
var yPoint = ((maxAxis – prices[i]) / axisRange) * chartHeight;
}
var xandy = {
x: xPoint,
y: yPoint
};
points.push(xandy);
var xPoint = xPoint + step;
};
return points;
};
function createaxes(prices){
var max = Math.max.apply(null, allPrices);
var min = Math.min.apply(null, allPrices);
var range = max – min;
var firstInterval = range / numAxes;
var interval = 20000;
var minAxis = 60000 // startAmt – (interval * Math.ceil((startAmt – min) / interval));
var maxAxis = 220000 // minAxis + (numAxes * interval);
var axisRange = maxAxis – minAxis;
var step = chartHeight / numAxes;
var accum = step;
var d = "";
// DRAW AXES
for(var i = 1; i minAxis; i = i – interval){
accum = accum + step;
var div = document.createElement(“div”);
div.style.position = “absolute”;
div.className = “price-label”;
div.style.left = chartWidth + 5 + “px”;
div.style.top = accum – 12 + “px”;
var commaNum = numberWithCommas(priceLabel);
div.innerHTML = “$” + commaNum;
document.getElementById(“main-chart”).appendChild(div);
priceLabel = priceLabel – interval;
};
};
// DRAW DATES
function createDates() {
var step = chartWidth / dateNum;
var stepFirst = (chartWidth / dateNum) * (11/12);
var left = 0 – 25 + stepFirst;
var div = document.createElement(“div”);
div.className = “price-label”;
div.style.position = “absolute”;
div.style.top = chartHeight + 5 + “px”;
div.style.left = left + “px”;
div.style.zIndex = “4”;
div.innerHTML = dates[11];
document.getElementById(“main-chart”).appendChild(div);
left += step;
for(var i = 23; i < dateNum * 12; i += 12) {
var date = dates[i];
var div = document.createElement("div");
div.className = "price-label";
div.style.position = "absolute";
div.style.top = chartHeight + 5 + "px";
div.style.left = left + "px";
div.style.zIndex = "4";
div.innerHTML = date;
document.getElementById("main-chart").appendChild(div);
var step
left += step;
};
};
function createchart(points, prices){
// DRAW CHART LINE
var pairs = [];
for(var i = 0; i < points.length; i++){
var xPoint = points[i].x;
var yPoint = points[i].y;
pairs.push(xPoint);
pairs.push(yPoint);
var chart = document.getElementById("chart");
var point = chart.createSVGPoint();
point.x = xPoint;
point.y = yPoint;
var polyline = document.getElementById("polyline-id");
polyline.points.appendItem(point);
};
// DRAW CHART FILL
for(var i = 0; i < points.length; i++){
var xPoint = points[i].x;
var yPoint = points[i].y;
pairs.push(xPoint);
pairs.push(yPoint);
var chart = document.getElementById("chart");
var point = chart.createSVGPoint();
point.x = xPoint;
point.y = yPoint;
var polyline = document.getElementById("polyline-fill");
polyline.points.appendItem(point);
};
var num = points.length – 1;
var chart = document.getElementById("chart");
var point = chart.createSVGPoint();
point.x = points[num].x;
point.y = chartHeight;
var polyline = document.getElementById("polyline-fill");
polyline.points.appendItem(point);
var chart = document.getElementById("chart");
var point = chart.createSVGPoint();
point.x = 0;
point.y = chartHeight;
var polyline = document.getElementById("polyline-fill");
polyline.points.appendItem(point);
var chart = document.getElementById("chart");
var point = chart.createSVGPoint();
point.x = 0;
point.y = points[0].y;
var polyline = document.getElementById("polyline-fill");
polyline.points.appendItem(point);
var left = 0;
var step = chartWidth / points.length;
// CREATE INTERACTIVE ELEMENTS
for(var i = 0; i < points.length; i++){
var top = points[i].y;
var div = document.createElement("div");
div.id = left;
div.className = "line";
div.style.position = "absolute";
div.style.height = chartHeight + "px";
div.style.width = step + "px";
div.style.left = left – (step / 2) + "px";
div.style.top = "0px";
document.getElementById("chart-container").appendChild(div);
var div = document.createElement("div");
div.className = "cursor";
div.style.height = chartHeight – points[i].y + "px";
div.style.top = chartHeight – (chartHeight – points[i].y) + "px";
div.style.left = "2px";
div.style.position = "absolute";
div.style.zIndex = "2";
document.getElementById(left).appendChild(div);
var div = document.createElement("div");
div.className = "dot";
div.style.position = "absolute";
div.style.top = points[i].y – 7 + "px";
div.style.left = 0 – (step / 2) + "px";
div.style.zIndex = "3";
document.getElementById(left).appendChild(div);
var div = document.createElement("div");
div.className = "label-chart";
div.style.position = "absolute";
div.style.top = chartHeight – 26 + "px";
div.style.left = "-50px";
div.style.zIndex = "4";
var num = Math.round(prices[i]);
var commaNum = numberWithCommas(num);
div.innerHTML = dates[i] + ": $" + commaNum;
document.getElementById(left).appendChild(div);
var left = left + step;
};
};