Markets were buoyed in July by data from the US suggesting that inflation may have peaked. All asset classes enjoyed strong returns and we saw a sharp rebound in segments of the market which were previously sold down on the back of inflation fears, such as the technology sector. During the month we observed a sharp reversal in short-term price momentum indicators which turned from red to bright green suggesting market sentiment had turned positive. So, is this the start of the next bull market or is it a false start and more pain is to come?

Despite the uptick in market performance, if we look at the facts, not much has changed. Inflation still remains high, the market continues to price in interest rate rises and there is evidence that the global economy is slowing. While we are starting to see some ‘green shoots’ in terms of the external drivers that have contributed to inflation showing some signs of easing, such as the improvement in global supply chains, the jury is still out as to the effectiveness of the current rate hiking cycle on controlling inflation. Since July the US Federal Reserve has reconfirmed their commitment to rate rises until they see clear evidence of inflation abating. Furthermore, we may see more aggressive quantitative tightening (QT), which in effect seeks to reduce central bank balance sheets to fight inflation. This has resulted in a resumption of market volatility. There are also the ‘X-Factors’ such as the conflict in Ukraine and the resultant pressure on energy prices, as well as the growing tensions between China and the West in relation to Taiwan. Both ‘X-Factor’ events are unpredictable and are contributing to the inflationary pressures we are currently observing.

We at Lonsec still believe that inflation will eventually peak and we may see central banks seek to reduce rates at some point in the coming 12 months as the economy shows further signs of slowing. The global economy is already showing signs of slowing with consumer sentiment falling, certain parts of the market such as construction under increased pressure, and indicators such as PMIs, while still broadly positive, showing signs of weakening. If central banks overshoot in their rate hikes the economic slow down will be more pronounced plunging world economies into a recession.

From a portfolio perspective, we have maintained our neutral asset allocation stance and continue to keep our portfolios relatively diversified. We expect more of the same in the coming six months with markets overreacting to short-term news, be it positive or negative, as markets try to navigate where inflation will land. We are continuing to look for evidence of inflation peaking and subsequent stabilisation of bond yields. Staffing remains an issue across sectors and companies are more hesitant in providing forward guidance. We are also closely watching company earnings. To date, companies have been able to pass on rising costs to the end consumer. However, the extent to which this will continue is yet to be seen.


IMPORTANT NOTICE: This document is published by Lonsec Investment Solutions Pty Ltd ACN 608 837 583, a Corporate Authorised Representative (CAR 1236821) (LIS) of Lonsec Research Pty Ltd ABN 11 151 658 561 AFSL 421 445 (Lonsec Research).  LIS creates the model portfolios it distributes using the investment research provided by Lonsec Research but LIS has not had any involvement in the investment research process for Lonsec Research. LIS and Lonsec Research are owned by Lonsec Holdings Pty Ltd ACN 151 235 406. Please read the following before making any investment decision about any financial product mentioned in this document.

DISCLOSURE AT THE DATE OF PUBLICATION: Lonsec Research receives a fee from the relevant fund manager or product issuer(s) for researching financial products (using objective criteria) which may be referred to in this document. Lonsec Research may also receive a fee from the fund manager or product issuer(s) for subscribing to research content and other Lonsec Research services.  LIS receives a fee for providing the model portfolios to financial services organisations and professionals. LIS’ and Lonsec Research’s fees are not linked to the financial product rating(s) outcome or the inclusion of the financial product(s) in model portfolios. LIS and Lonsec Research and their representatives and/or their associates may hold any financial product(s) referred to in this document, but details of these holdings are not known to the Lonsec Research analyst(s).

WARNINGS: Past performance is not a reliable indicator of future performance. Any express or implied rating or advice presented in this document is limited to general advice and based solely on consideration of the investment merits of the financial product(s) alone, without taking into account the investment objectives, financial situation and particular needs (“financial circumstances”) of any particular person. Before making an investment decision based on the rating or advice, the reader must consider whether it is personally appropriate in light of his or her financial circumstances or should seek independent financial advice on its appropriateness.  If the financial advice relates to the acquisition or possible acquisition of a particular financial product, the reader should obtain and consider the Investment Statement or the Product Disclosure Statement for each financial product before making any decision about whether to acquire the financial product.

DISCLAIMER: No representation, warranty or undertaking is given or made in relation to the accuracy or completeness of the information presented in this document, which is drawn from public information not verified by LIS. The information contained in this document is current as at the date of publication. Financial conclusions, ratings and advice are reasonably held at the time of publication but subject to change without notice. LIS assumes no obligation to update this document following publication. Except for any liability which cannot be excluded, LIS and Lonsec Research, their directors, officers, employees and agents disclaim all liability for any error or inaccuracy in, misstatement or omission from, this document or any loss or damage suffered by the reader or any other person as a consequence of relying upon it.

Copyright © 2022 Lonsec Investment Solutions Pty Ltd ACN 608 837 583 (LIS). This document may also contain third party supplied material that is subject to copyright.  The same restrictions that apply to LIS copyrighted material, apply to such third-party content.

The challenges of owning a ‘balanced’ portfolio consisting of equities and bonds is front of mind given the broad market volatility that has occurred in 2022. ‘Balanced’ portfolios can differ in the proportion of growth assets they hold, anywhere from 50% – 70% growth and 30% to 50% defensive assets. For the purposes of Lonsec’s analysis in this thought piece, we have used 60% growth and 40% defensive assets as the benchmark portfolio, consisting of 30% S&P/ASX 200 TR Index, 15% MSCI AC World Index ex Australia NR Index (AUD Hedged), 15% MSCI AC World Index ex Australia TR Index (AUD), 20% Bloomberg AusBond Composite 0 Year Index AUD, and 20% Bloomberg Global Aggregate TR Index (AUD Hedged). This represents a broad and fairly vanilla exposure to 60% equities and 40% bonds.

The so called ‘death of the 60/40 portfolio’ has been raised many times following the GFC. That being said, this portfolio has performed exceptionally well over this period. The average calendar year return from 2009 to 2021 has been 9.3%, with the highest returning year being 17.8% (2019) and the lowest returning year being -0.5% (2018). With volatility mostly at the lower end of historical norms, risk adjusted returns have also been strong. Those adopting a buy and hold, static approach to portfolio construction have generally been well rewarded.

That has all changed this year. ‘Balanced’ portfolio returns have been challenged by the war in Ukraine and central banks that have pivoted more quickly than expected to raising interest rates in response to inflation. Figure 1 shows the extent of the sell-off in 2022. For the calendar year until the end of May, the ‘Balanced’ portfolio is down -7.1%. This is the worst start to a calendar year over the 20-year period assessed. Of course, 2002 and, in particular, 2008 ended with deeper drawdowns and at this stage it is highly uncertain how the rest of 2022 will shape up.

Figure 1

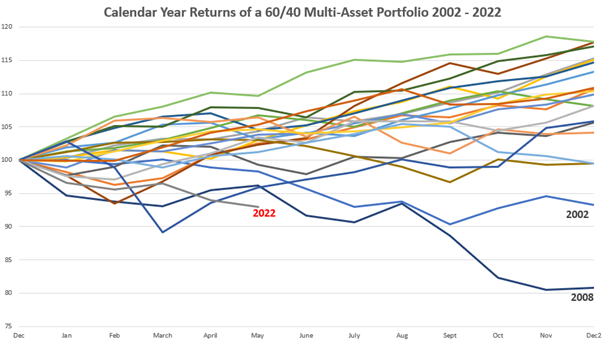
Source: Lonsec iRate, data is calendar year returns for a 60/40 portfolio consisting of 30% S&P/ASX 200 TR Index, 15% MSCI AC World Index ex Australia NR Index (AUD Hedged), 15% MSCI AC World Index ex Australia TR Index (AUD), 20% Bloomberg AusBond Composite 0 Year Index AUD, and 20% Bloomberg Global Aggregate TR Index (AUD Hedged). YTD 2022 as at 31 May 2022.

What is different in the 2022 sell-off is the performance of bonds and the breakdown in diversification benefits that they typically offer to a balanced portfolio. While the concept of diversification, the idea of not putting your eggs all in one basket, is fairly well understood, the concept of correlation is less so. If the returns of two asset classes are correlated it means they move up and down together. If assets are negatively correlated it means when the value of one asset rises, the other falls. Ideally, portfolios should be made up of asset class constituents that have a low correlation to each other so that when parts of the portfolio fall in value, other areas of the portfolio rise in value. A negative correlation between risky assets, such as equities, and risk-free assets, such as bonds, has tended to hold for much of recent history, especially in market stress events. However, in 2022, the correlation between equities and bonds has been positive. As depicted in Figure 2, both asset classes have sold off together this year, whereas in 2002 and 2008, bonds offered diversification benefits to falling equity markets.

Figure 2

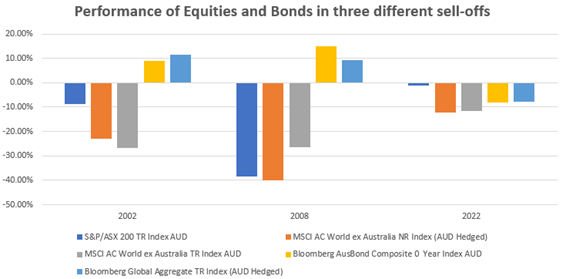
Source: Lonsec iRate, 2022 correct as at 31 May 2022.

While the negative correlation between equities and bonds is often written about as if a universal law of investing, figure 3 shows that correlations between the two asset classes certainly aren’t static through time and can be highly sensitive to changes in market conditions and regimes. Rolling one-year correlations have been quite volatile over the 20 year period under assessment. A more medium-term representation, as shown by the rolling three year correlation, shows that the two asset classes were generally negatively correlated in the period from 2002 to 2012, but turned more positive in the last several years and spiked early in 2022. The takeaway from this is that positive correlations between equities and bonds are not necessarily anything new, rather the correlations are time varying in nature. Of course, a positive correlation between the two asset classes is less acceptable when markets are falling as they have been this year.

Figure 3

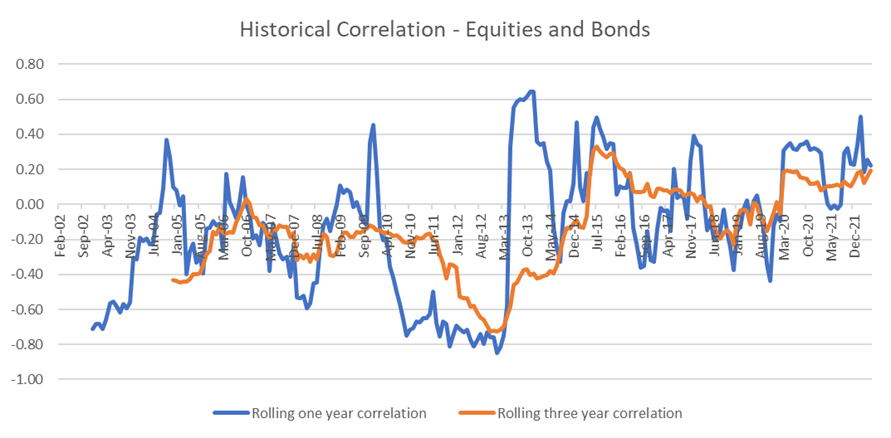
Source:  Lonsec iRate, for the period January 2022 to May 2022. Equities consists of 50% S&P/ASX 200 TR Index, 25% MSCI AC World Index ex Australia NR Index (AUD Hedged), 25% MSCI AC World Index ex Australia TR Index (AUD). Bonds consists of 50% Bloomberg AusBond Composite 0 Year Index AUD, and 50% Bloomberg Global Aggregate TR Index (AUD Hedged).

What does the future state hold? ‘Regime change’ has become the topic de jour, a term used to describe a structural shift in the economic environment. For much of the last 20-30 years, the environment has been dominated by low inflation (and falling interest rates) and moderate growth, an environment which, all else equal, is favourable for both equities and bonds. Importantly, bonds have been a great diversifier while delivering positive returns.

Conversely, a backdrop of higher inflation (and rising interest rates) and low growth is less favourable for equities and bonds. It is this environment that is dominating markets this year. The duration of these changes is never certain and one can never be certain how long a certain regime will persist. High valuations in both equity and bond markets at the start of this year had certainly made markets more susceptible to a correction when sentiment turned. That being said, markets can be fast moving and naturally reset themselves after periods of extreme market performance. 10 year bond yields in the US and Australia have already priced in a number of rate rises and some multi-asset managers, after a period of little exposure to bonds, are now talking about them offering better value in some circumstances.

While stress in financial markets can be worrying, it is important to focus on your long-term investment strategy and ensure portfolio asset allocations are aligned with your goals and objectives. Figure 5 shows that the variance of shorter-term returns can be wide, however the range of potential outcomes tends to narrow over longer-term time horizons. This highlights the time diversification inherent in many multi-asset portfolios.

Figure 4

  Rolling one-year returns Rolling three year returns p.a. Rolling five year returns p.a. Rolling 10 year returns p.a.
Average annualised return 8.07% 7.77% 7.51% 7.60%
Best annualised return 24.62% 15.82% 12.94% 10.00%
Worst annualised return -20.26% -4.21% 1.29% 5.31%

Source: Lonsec iRate using monthly time series of 60/40 Balanced portfolio from 2002 to May 2022 consisting of 30% S&P/ASX 200 TR Index, 15% MSCI AC World Index ex Australia NR Index (AUD Hedged), 15% MSCI AC World Index ex Australia TR Index (AUD), 20% Bloomberg AusBond Composite 0 Year Index AUD, and 20% Bloomberg Global Aggregate TR Index (AUD Hedged).

Note, the average annualised return of the ‘Balanced’ portfolio is between 7.5% and 8.1% p.a. over each rolling timeframe. For those investors with shorter term time horizons, the range of potential outcomes has been exceptionally wide. An investor withdrawing in November 2008 after one year invested experienced a loss of -20.3%. Somewhat unsurprisingly the strongest 12-month return was in the aftermath of the financial crisis in February 2010 with a return of 24.6%. While an obvious lesson here is that investors tend to be well rewarded for investing at the bottom of the cycle (notwithstanding the difficulties of picking the bottom), a major takeaway is that those invested over longer time horizons have a much narrower range of potential outcomes (somewhat easier than picking when to invest). Rolling 10-year periods over the 20 year time period assessed were in the range of 5.3% and 7.6% p.a. The 5.3% p.a. return was for the 10-year period ending December 2011 and included the drawdowns of 2002 and 2008, highlighting that staying the course can be a valuable strategy in itself when correctly aligned to your risk profile and overall objectives.

The multi-asset universe is exceptionally broad consisting of static asset allocation approaches as referenced in the analysis above, in addition to those taking active asset allocation and/or active security selection decisions. If the forward-looking environment continues to be challenged, multi-asset managers will have to lean on these asset allocation and security selection levers to enhance the risk and return profile of their portfolios. Many multi-asset funds have the flexibility in their mandates to tilt portfolios away from their reference asset class benchmark, in addition to introducing other asset classes within their portfolios to support diversification benefits. Forward looking scenario testing and testing of correlation assumptions may also be part of their investment process. Theoretically, this increases the level of diversification and potential return sources available and allows active managers to be more dynamic in responding to changing market conditions or regimes. Funds with greater asset allocation tools can be useful for investors who require greater certainty in outcomes, are close to or in retirement, or have a specific goal suited to the fund in question.

Key takeaways for multi-asset investors

  1. Investing in the right asset allocation for your risk profile and goals is highly important. This may well be a static asset allocation approach, as is the one described in our analysis, or one that is much more dynamic and tactical in its approach.
  2. Return outcomes over shorter term time horizons can be wide. Investors who are willing to invest over the longer term have tended to be well rewarded for taking risk.
  3. The correlation between equities and bonds is time varying and dependent on market regimes. To date, 2022 has been an exceptionally unusual year in the last 20 years with both equities and bonds selling off together.

IMPORTANT NOTICE: This document is published by Lonsec Research Pty Ltd ABN 11 151 658 561, AFSL No. 421445 (Lonsec). Please read the following before making any investment decision about any financial product mentioned in this document.
Disclosure as at the date of publication: Lonsec receives fees from fund managers or product issuers for researching their financial product(s) using comprehensive and objective criteria. Lonsec receives subscriptions for providing research content to subscribers including fund managers and product issuers. Lonsec receives fees for providing investment consulting advice to clients, which includes model portfolios, approved product lists and other advice. Lonsec’s fees are not linked to the product rating outcome or the inclusion of products in model portfolios, or in approved product lists. Lonsec and its representatives, Authorised Representatives and their respective associates may have positions in the financial product(s) mentioned in this document, which may change during the life of this document, but Lonsec considers such holdings not to be sufficiently material to compromise any recommendation or advice.
Warnings: Past performance is not a reliable indicator of future performance. The information contained in this document is obtained from various sources deemed to be reliable. It is not guaranteed as accurate or complete and should not be relied upon as such. Opinions expressed are subject to change. This document is but one tool to help make investment decisions. The changing character of markets requires constant analysis and may result in changes. Any express or implied rating or advice presented in this document is limited to “General Advice” (as defined in the Corporations Act 2001 (Cth)) and based solely on consideration of the investment merits of the financial product(s) alone, without taking into account the investment objectives, financial situation and particular needs (‘financial circumstances’) of any particular person. It does not constitute a recommendation to purchase, redeem or sell the relevant financial product(s).
Before making an investment decision based on the rating(s) or advice, the reader must consider whether it is personally appropriate in light of his or her financial circumstances, or should seek independent financial advice on its appropriateness. If our advice relates to the acquisition or possible acquisition of particular financial product(s), the reader should obtain and consider the Investment Statement or Product Disclosure Statement for each financial product before making any decision about whether to acquire a financial product. Where Lonsec’s research process relies upon the participation of the fund manager(s) or product issuer(s) and they are no longer an active participant in Lonsec’s research process, Lonsec reserves the right to withdraw the document at any time and discontinue future coverage of the financial product(s).
Disclaimer: This document is for the exclusive use of the person to whom it is provided by Lonsec and must not be used or relied upon by any other person. No representation, warranty or undertaking is given or made in relation to the accuracy or completeness of the information presented in this document, which is drawn from public information not verified by Lonsec. Financial conclusions, ratings and advice are reasonably held at the time of completion but subject to change without notice. Lonsec assumes no obligation to update this document following publication. Except for any liability which cannot be excluded, Lonsec, its directors, officers, employees and agents disclaim all liability for any error or inaccuracy in, misstatement or omission from, this document or any loss or damage suffered by the reader or any other person as a consequence of relying upon it.
Copyright © 2022 Lonsec Research Pty Ltd (ABN 11 151 658 561, AFSL No. 421445) (Lonsec). This document is subject to copyright of Lonsec. Except for the temporary copy held in a computer’s cache and a single permanent copy for your personal reference or other than as permitted under the Copyright Act 1968 (Cth), no part of this document may, in any form or by any means (electronic, mechanical, micro-copying, photocopying, recording or otherwise), be reproduced, stored or transmitted without the prior written permission of Lonsec.
This document may also contain third party supplied material that is subject to copyright. Any such material is the intellectual property of that third party or its content providers. The same restrictions applying above to Lonsec copyrighted material, applies to such third party content.

It has been a challenging period for multi-asset investors with both equity and bond markets recording some of the worse starts to a year in decades. Global equity markets fell significantly over the quarter and domestically the ASX 300 index has fallen more than 10% since the start of the calendar year. However, what has been most damaging to balanced portfolios has been the significant losses experienced in the bond markets. Bond market indices are down 10%, as persistent and high inflation has seen bond yields rise sharply. The defensive part of many investor portfolios failed when it was needed most.

Deanne Baker explains how the Multi-Asset portfolios are positioned to best navigate through the current challenging environment.


The information in this video is prepared by Lonsec Investment Solutions Pty Ltd ABN 95 608 837 583 (LIS, we, us, our), a Corporate Authorised Representative (CAR) No. 1236821 of Lonsec Research Pty Ltd ABN 11 151 658 561, AFSL No. 421445 (Lonsec Research). Any express or implied rating or advice presented in this video is limited to general advice and based solely on consideration of the investment merits of the financial product(s) alone, without taking into account the investment objectives, financial situation and particular needs (“financial circumstances”) of any particular person. Before making an investment decision you must consider your financial circumstances or seek personal financial advice on its appropriateness. Read the Product Disclosure Statement for each financial product before making any decision about whether to acquire a financial product.

Past performance is not a reliable indicator of future performance. No representation, warranty or undertaking is given or made in relation to the accuracy or completeness of the information presented in this video, which is drawn from information not verified by LIS. This video may also contain third party material that is subject to copyright. To the extent that copyright subsists in a third party it remains with the original owner and permission may be required to reuse the material.

The information contained in this video is current as at the date of publication. Financial conclusions, ratings and advice are reasonably held at the time of publication but subject to change without notice. LIS assumes no obligation to update this document following publication. This video is not intended for use by a retail client or a member of the public and should not be used or relied upon by any other person. This video is not to be distributed without the consent of LIS. Except for any liability which cannot be excluded, LIS and Lonsec Research, their directors, officers, employees and agents disclaim all liability for any error or inaccuracy in, misstatement or omission from, this video or any loss or damage suffered by the reader or any other person as a consequence of relying upon it. Copyright © 2022 Lonsec Investment Solutions Pty Ltd.

You may not reproduce, transmit, disseminate, sell or publish this video without our written consent.

We are currently in an environment we haven’t seen since the mid-1990s, of extremely high inflation and low growth, which has surprised many investors and has been damaging for those that have a low tolerance to risk, such as retirees. Despite negative returns, and while we haven’t been able to avoid the losses entirely, the Retirement portfolios have significantly outperformed the peer group benchmark, protecting retirees. The portfolio also delivered top quartile returns with less risk than the peer group over the 12 months to June 2022. In terms of total return, the portfolio remains comfortably above its Cash plus 2.4% objective over the 4-year recommended investment timeframe.

True to our investment philosophy and approach, having true diversification in the portfolios, being dynamic in how we positioned the portfolio this year, investing in high-quality strategies, and having a strong risk control, have paid off.


The information in this video is prepared by Lonsec Investment Solutions Pty Ltd ABN 95 608 837 583 (LIS, we, us, our), a Corporate Authorised Representative (CAR) No. 1236821 of Lonsec Research Pty Ltd ABN 11 151 658 561, AFSL No. 421445 (Lonsec Research). Any express or implied rating or advice presented in this video is limited to general advice and based solely on consideration of the investment merits of the financial product(s) alone, without taking into account the investment objectives, financial situation and particular needs (“financial circumstances”) of any particular person. Before making an investment decision you must consider your financial circumstances or seek personal financial advice on its appropriateness. Read the Product Disclosure Statement for each financial product before making any decision about whether to acquire a financial product.

Past performance is not a reliable indicator of future performance. No representation, warranty or undertaking is given or made in relation to the accuracy or completeness of the information presented in this video, which is drawn from information not verified by LIS. This video may also contain third party material that is subject to copyright. To the extent that copyright subsists in a third party it remains with the original owner and permission may be required to reuse the material.

The information contained in this video is current as at the date of publication. Financial conclusions, ratings and advice are reasonably held at the time of publication but subject to change without notice. LIS assumes no obligation to update this document following publication. This video is not intended for use by a retail client or a member of the public and should not be used or relied upon by any other person. This video is not to be distributed without the consent of LIS. Except for any liability which cannot be excluded, LIS and Lonsec Research, their directors, officers, employees and agents disclaim all liability for any error or inaccuracy in, misstatement or omission from, this video or any loss or damage suffered by the reader or any other person as a consequence of relying upon it. Copyright © 2022 Lonsec Investment Solutions Pty Ltd.

You may not reproduce, transmit, disseminate, sell or publish this video without our written consent.

It has been a challenging period for multi-asset investors with both equity and bond markets recording some of the worse starts to a year in decades. Global equity markets fell significantly over the quarter and domestically the ASX 300 index has fallen more than 10% since the start of the calendar year.

ESG and sustainable portfolios in general have felt the pain more acutely given the wide dispersion seen in sector returns and the Lonsec Sustainable portfolios were no exception. The portfolios have had a difficult quarter, lagging the peer group benchmark by some margin. Over the quarter, Dynamic Asset Allocation added value in the Balanced risk profile which benefited most from our underweight position in Fixed Income. In the higher risk profiles, DAA was flat to slightly negative as our overweight position in real assets more than offset the gains made in Fixed Income.

Looking ahead, our Sustainable positions remain diversified in order to be resilient to further market volatility. We continue to monitor developments regarding inflation, monetary policy and the global economy and we will adjust our portfolios if necessary to navigate through the challenges ahead.


The information in this video is prepared by Lonsec Investment Solutions Pty Ltd ABN 95 608 837 583 (LIS, we, us, our), a Corporate Authorised Representative (CAR) No. 1236821 of Lonsec Research Pty Ltd ABN 11 151 658 561, AFSL No. 421445 (Lonsec Research). Any express or implied rating or advice presented in this video is limited to general advice and based solely on consideration of the investment merits of the financial product(s) alone, without taking into account the investment objectives, financial situation and particular needs (“financial circumstances”) of any particular person. Before making an investment decision you must consider your financial circumstances or seek personal financial advice on its appropriateness. Read the Product Disclosure Statement for each financial product before making any decision about whether to acquire a financial product.

Past performance is not a reliable indicator of future performance. No representation, warranty or undertaking is given or made in relation to the accuracy or completeness of the information presented in this video, which is drawn from information not verified by LIS. This video may also contain third party material that is subject to copyright. To the extent that copyright subsists in a third party it remains with the original owner and permission may be required to reuse the material.

The information contained in this video is current as at the date of publication. Financial conclusions, ratings and advice are reasonably held at the time of publication but subject to change without notice. LIS assumes no obligation to update this document following publication. This video is not intended for use by a retail client or a member of the public and should not be used or relied upon by any other person. This video is not to be distributed without the consent of LIS. Except for any liability which cannot be excluded, LIS and Lonsec Research, their directors, officers, employees and agents disclaim all liability for any error or inaccuracy in, misstatement or omission from, this video or any loss or damage suffered by the reader or any other person as a consequence of relying upon it. Copyright © 2022 Lonsec Investment Solutions Pty Ltd.

You may not reproduce, transmit, disseminate, sell or publish this video without our written consent.

The heat has been on with central banks around the world trying to keep inflation under control. We have seen three consecutive rate rises by the RBA, the most numerous since 2010. We have observed similar monetary policy tightening action in other jurisdictions, notably the US where the last inflation read was 8.6%. Central banks are walking a tightrope as they try to manage inflation while at the same time trying to avoid a material economic slowdown.

One of the challenges is that many of the inflationary pressures we have observed have been driven by supply side issues caused by the pandemic and the subsequent pressure on supply chains. This has been coupled with the war in Ukraine which together have driven up the price of everything from building materials, food and energy costs.

There are some initial signs however that the heat may be coming off some of the areas that have been driving inflation. Globally, there is evidence weaker demand is coming through reflected in weaker PMI figures, opening up some spare capacity and allowing supply conditions to improve. Notably, indicators such as Global Manufacturing PMI supplier delivery times are showing signs of improvement, suggesting goods are beginning to move again and the S&P Global Supply Side Shortages Indicator is easing.

Other signs of the heat coming out of the economy are evident. The most visible and arguably high-profile, given many of us have exposure, is the housing sector. The Australian housing market is showing signs of softening with auction clearance rates at two-year lows according to CoreLogic data. Sydney has recorded the sharpest fall in house prices, falling by 1.6% in June. We have also seen a string of construction companies go into liquidation, the most recent being Langford Jones Homes in Victoria.

It is too early to assess whether rate rises are having their intended effect and whether central banks have the balance right between managing demand and keeping the economy growing. However, there are signs that demand is weakening and that supply chains are slowly working through the ‘covid’ backlog. If we see sustained evidence that inflation has peaked, and bond yields show signs of stability it is plausible that central banks will pause their tightening cycle and we may even see rates come back down next year. Until that time expect more bouts of market volatility as the market attempts to price in expectations on interest rates.

Considering this environment, we have sought to moderate any material asset allocation tilts and well as factor exposures within our suite of portfolios. We are likely to hold this position until we see sustained signs of inflation peaking and rate hiking cycle approach its climax. At that point we will reassess our portfolios positioning.


IMPORTANT NOTICE: This document is published by Lonsec Investment Solutions Pty Ltd ACN 608 837 583, a Corporate Authorised Representative (CAR 1236821) (LIS) of Lonsec Research Pty Ltd ABN 11 151 658 561 AFSL 421 445 (Lonsec Research).  LIS creates the model portfolios it distributes using the investment research provided by Lonsec Research but LIS has not had any involvement in the investment research process for Lonsec Research. LIS and Lonsec Research are owned by Lonsec Holdings Pty Ltd ACN 151 235 406. Please read the following before making any investment decision about any financial product mentioned in this document.

DISCLOSURE AT THE DATE OF PUBLICATION: Lonsec Research receives a fee from the relevant fund manager or product issuer(s) for researching financial products (using objective criteria) which may be referred to in this document. Lonsec Research may also receive a fee from the fund manager or product issuer(s) for subscribing to research content and other Lonsec Research services.  LIS receives a fee for providing the model portfolios to financial services organisations and professionals. LIS’ and Lonsec Research’s fees are not linked to the financial product rating(s) outcome or the inclusion of the financial product(s) in model portfolios. LIS and Lonsec Research and their representatives and/or their associates may hold any financial product(s) referred to in this document, but details of these holdings are not known to the Lonsec Research analyst(s).

WARNINGS: Past performance is not a reliable indicator of future performance. Any express or implied rating or advice presented in this document is limited to general advice and based solely on consideration of the investment merits of the financial product(s) alone, without taking into account the investment objectives, financial situation and particular needs (“financial circumstances”) of any particular person. Before making an investment decision based on the rating or advice, the reader must consider whether it is personally appropriate in light of his or her financial circumstances or should seek independent financial advice on its appropriateness.  If the financial advice relates to the acquisition or possible acquisition of a particular financial product, the reader should obtain and consider the Investment Statement or the Product Disclosure Statement for each financial product before making any decision about whether to acquire the financial product.

DISCLAIMER: No representation, warranty or undertaking is given or made in relation to the accuracy or completeness of the information presented in this document, which is drawn from public information not verified by LIS. The information contained in this document is current as at the date of publication. Financial conclusions, ratings and advice are reasonably held at the time of publication but subject to change without notice. LIS assumes no obligation to update this document following publication. Except for any liability which cannot be excluded, LIS and Lonsec Research, their directors, officers, employees and agents disclaim all liability for any error or inaccuracy in, misstatement or omission from, this document or any loss or damage suffered by the reader or any other person as a consequence of relying upon it.

Copyright © 2022 Lonsec Investment Solutions Pty Ltd ACN 608 837 583 (LIS). This document may also contain third party supplied material that is subject to copyright.  The same restrictions that apply to LIS copyrighted material, apply to such third-party content.

Equity markets ended the financial year on a negative note in June, with the S&P/ASX 200 falling around 9% to finish the quarter down 12%. This drove the ASX 200 index as a whole down 6.5% for FY22. Global equities also fell significantly over the quarter, but Australian investors received some protection on unhedged investments from a 6 cent (8%) depreciation in the Australian Dollar. Rising inflation and subsequent rising interest rates were the main factors causing these negative returns.

Dan Moradi, Portfolio Manager for Listed Products, explains in detail what caused these negative returns and provides an update on the portfolios’ latest performance, positioning and outlook.


The information in this video is prepared by Lonsec Investment Solutions Pty Ltd ABN 95 608 837 583 (LIS, we, us, our), a Corporate Authorised Representative (CAR) No. 1236821 of Lonsec Research Pty Ltd ABN 11 151 658 561, AFSL No. 421445 (Lonsec Research). Any express or implied rating or advice presented in this video is limited to general advice and based solely on consideration of the investment merits of the financial product(s) alone, without taking into account the investment objectives, financial situation and particular needs (“financial circumstances”) of any particular person. Before making an investment decision you must consider your financial circumstances or seek personal financial advice on its appropriateness. Read the Product Disclosure Statement for each financial product before making any decision about whether to acquire a financial product.

Past performance is not a reliable indicator of future performance. No representation, warranty or undertaking is given or made in relation to the accuracy or completeness of the information presented in this video, which is drawn from information not verified by LIS. This video may also contain third party material that is subject to copyright. To the extent that copyright subsists in a third party it remains with the original owner and permission may be required to reuse the material.

The information contained in this video is current as at the date of publication. Financial conclusions, ratings and advice are reasonably held at the time of publication but subject to change without notice. LIS assumes no obligation to update this document following publication. This video is not intended for use by a retail client or a member of the public and should not be used or relied upon by any other person. This video is not to be distributed without the consent of LIS. Except for any liability which cannot be excluded, LIS and Lonsec Research, their directors, officers, employees and agents disclaim all liability for any error or inaccuracy in, misstatement or omission from, this video or any loss or damage suffered by the reader or any other person as a consequence of relying upon it. Copyright © 2022 Lonsec Investment Solutions Pty Ltd.

You may not reproduce, transmit, disseminate, sell or publish this video without our written consent.

With a huge array of government initiatives reshaping super in recent years, none was more keenly watched than the inaugural performance test of 80 MySuper products.

The regulator found that 13 of the 80 products assessed were deemed to have underperformed the benchmark by more than 50 basis points. Since August when the results were released, 77% of these providers have announced their intentions to either merge or exit the industry.

This year, we expect to see the second round of MySuper results likely causing some MySuper solutions to be prevented from accepting new members. This will be accompanied by the first assessment of Choice options under the test. SuperRatings has conducted analysis of the industry’s performance to 31 March 2022, using its newly developed Performance Test iQ tool. Analysis was completed on over 650 options across Trustee Directed Products, including Retail, Industry, Corporate, and Government funds, excluding MySuper products.

The results from our analysis suggest that approximately 20% of options were estimated to fail the test, which allows for annualised underperformance of the benchmark of up to 50 basis points.

Option Type % Estimated to Fail
Capital Stable (20-40) 25%
Conservative Balanced (41-59) 20%
Balanced (60-76) 17%
Growth (77-90) 16%
High Growth (91-100) 26%

Breaking down the analysis further, SuperRatings found that all option types are facing challenges. In particular, options with growth assets, such as equities, making up between 91-100% of assets held were most likely to fail the test, with 26% of these options estimated as failing based on performance over the 8 years to 31 March 2022. Capital Stable options with between 20-40% growth assets are also facing a challenge to pass the test, with around a quarter of these options estimated as failing.

As the performance test captures investment returns over an eight-year period, funds have limited ability to shift their relative long-term position against the benchmark. However, with the test only accounting for the most recent level of fees charged, funds do have the ability to make fee changes to improve their performance test outcomes.

SuperRatings has been tracking an estimate of the benchmark representative administration fees and expenses (RAFE) based on the performance test calculation. While the test appears to be having an impact in terms of reducing fees for the MySuper products which were tested last year, our analysis shows that the Trustee Directed Product RAFE has remained flat.


We observed a decline in the RAFE for MySuper products each quarter since the start of the financial year, however the Trustee Directed Product RAFE saw an increase in the September quarter, followed by a return to the same RAFE in December 2021 and has remained stable since.

Since the results of the first test were published, we have observed an increase in funds seeking to simplify their investment menus, as well as a faster pace of merger announcements and shorter times for mergers to reach completion. While there are clear cost savings for funds in managing fewer options, the benefits of member choice are real, with highly engaged members particularly valuing additional choice. We suggest funds take a balanced approach when assessing the viability of offering additional options to ensure members achieve the best possible retirement outcomes.

The first performance test has had a significant impact on the future of those products which failed. Having an industry wide benchmark gives funds a clear target with significant potential benefit for members, however ensuring the test is appropriately capturing the nuances of the range of investment options in the industry remains a challenge. The regulator will be releasing the results of its second annual performance test later this year, with the industry closely monitoring potential outcomes. As the industry awaits the results of the second test, SuperRatings continues to use its comprehensive database and deep research capability to gain key insights into super fund performance and the future outlook for the industry.

In this video, Lukasz de Pourbaix, Executive Director and CIO of Lonsec Investment Solutions provides an update on what’s been happening in the markets, with market volatility and inflation. Lukasz then explains what this means for the Lonsec portfolios.


IMPORTANT NOTICE: This document is published by Lonsec Investment Solutions Pty Ltd ACN 608 837 583, a Corporate Authorised Representative (CAR 1236821) (LIS) of Lonsec Research Pty Ltd ABN 11 151 658 561 AFSL 421 445 (Lonsec Research).  LIS creates the model portfolios it distributes using the investment research provided by Lonsec Research but LIS has not had any involvement in the investment research process for Lonsec Research. LIS and Lonsec Research are owned by Lonsec Holdings Pty Ltd ACN 151 235 406. Please read the following before making any investment decision about any financial product mentioned in this document.

DISCLOSURE AT THE DATE OF PUBLICATION: Lonsec Research receives a fee from the relevant fund manager or product issuer(s) for researching financial products (using objective criteria) which may be referred to in this document. Lonsec Research may also receive a fee from the fund manager or product issuer(s) for subscribing to research content and other Lonsec Research services.  LIS receives a fee for providing the model portfolios to financial services organisations and professionals. LIS’ and Lonsec Research’s fees are not linked to the financial product rating(s) outcome or the inclusion of the financial product(s) in model portfolios. LIS and Lonsec Research and their representatives and/or their associates may hold any financial product(s) referred to in this document, but details of these holdings are not known to the Lonsec Research analyst(s).

WARNINGS: Past performance is not a reliable indicator of future performance. Any express or implied rating or advice presented in this document is limited to general advice and based solely on consideration of the investment merits of the financial product(s) alone, without taking into account the investment objectives, financial situation and particular needs (“financial circumstances”) of any particular person. Before making an investment decision based on the rating or advice, the reader must consider whether it is personally appropriate in light of his or her financial circumstances or should seek independent financial advice on its appropriateness.  If the financial advice relates to the acquisition or possible acquisition of a particular financial product, the reader should obtain and consider the Investment Statement or the Product Disclosure Statement for each financial product before making any decision about whether to acquire the financial product.

DISCLAIMER: No representation, warranty or undertaking is given or made in relation to the accuracy or completeness of the information presented in this document, which is drawn from public information not verified by LIS. The information contained in this document is current as at the date of publication. Financial conclusions, ratings and advice are reasonably held at the time of publication but subject to change without notice. LIS assumes no obligation to update this document following publication. Except for any liability which cannot be excluded, LIS and Lonsec Research, their directors, officers, employees and agents disclaim all liability for any error or inaccuracy in, misstatement or omission from, this document or any loss or damage suffered by the reader or any other person as a consequence of relying upon it.

Copyright © 2022 Lonsec Investment Solutions Pty Ltd ACN 608 837 583 (LIS). This document may also contain third party supplied material that is subject to copyright.  The same restrictions that apply to LIS copyrighted material, apply to such third-party content.

With the regulator set to release the results of its assessment of performance for Trustee Directed Products for the period to 30 June 2022, we have estimated the potential outcomes for diversified Choice options using our new Performance Test iQ analysis tool for the 8-year period to 31 March 2022.

The results indicate that approximately 20% of options were estimated to fail the test, which allows for annualised underperformance of the benchmark of up to 50 basis points.

Kirby Rappell, Executive Director, SuperRatings

Important information: Any express or implied rating or advice is limited to general advice, it doesn’t consider any personal needs, goals or objectives.  Before making any decision about financial products, consider whether it is personally appropriate for you in light of your personal circumstances. Obtain and consider the Product Disclosure Statement for each financial product and seek professional personal advice before making any decisions regarding a financial product.